
Recommended
More Related Content
Similar to CAUSES AND CONSEQUENCES OF THE U.S. TRADE DEFICIT: AN OVERVIEW
Similar to CAUSES AND CONSEQUENCES OF THE U.S. TRADE DEFICIT: AN OVERVIEW (17)
More from cravennichole326
More from cravennichole326 (20)
Recently uploaded
Recently uploaded (20)
CAUSES AND CONSEQUENCES OF THE U.S. TRADE DEFICIT: AN OVERVIEW
- 1. CAUSES AND CONSEQUENCES OF THE TRADE DEFICIT: AN OVERVIEW March 2000 In recent years, the U.S. trade deficit has grown very large by historical standards, prompting concerns that it is damaging or may pose a threat to the economy. The Senate Committee on Finance asked the Congressional Budget Office (CBO) to carry out a study of the trade deficit, its causes, and its effects on the economy. The committee also asked CBO to examine the effects of various federal policies on the trade deficit—especially those that might be considered to reduce or eliminate it. This memorandum summarizes the results of that effort. Bruce Arnold of CBO's Microeconomic and Financial Studies Division wrote the memorandum under the direction of Roger Hitchner, Robert Dennis, and David Moore. Helpful comments were received from Doug Hamilton, Juann Hung, Kim Kowalewski, Preston Miller, John Peterson, John Sabelhaus and Tom Woodward, within CBO, and from Paul Wonnacott of Middlebury College
- 2. and Catherine Mann of the Institute for International Economics. Jenny Au prepared the figures. Sherry Snyder edited the memorandum, Leah Mazade proofread it, and Rae Wiseman prepared it for publication. Laurie Brown prepared the electronic versions for CBO's World Wide Web site (www.cbo.gov). Questions about the analysis should be addressed to Bruce Arnold. CONTENTS INTRODUCTION AND SUMMARY 1 WHAT IS THE CURRENT-ACCOUNT BALANCE? 5 WHAT CAUSES THE CURRENT-ACCOUNT DEFICIT? 6 A Long Decline in Domestic Saving 7 The Business Cycle 12 Growth of Investment in the 1990s 12 DO INFLOWS OF FOREIGN CAPITAL HARM THE ECONOMY? 14 Effects on GDP, GNP, and Wages 14 Effects on Different Sectors of the Economy 15 Concerns About Foreign Finance and Economic Stability 16 SHOULD ANYTHING BE DONE ABOUT THE CURRENT-ACCOUNT DEFICIT? 19
- 3. CONCLUSION 24 TABLES 1. Effects of Various Trade-Related Policies on the Current-Account Deficit 21 FIGURES 1. The U.S. Balance of Trade, 1970-1999 2 2. Saving, Investment, and the Current-Account Balance 8 INTRODUCTION AND SUMMARY Since World War II, the United States has supported agreements among nations to eliminate barriers to international trade and investment. Despite occasional resistance, that support has generally reflected a public consensus about the benefits to be gained from free trade. Since long before the war, the United States had run an almost unbroken string of trade surpluses—that is, an excess of exports over imports—and the war damaged or destroyed much of the most significant international competition for U.S. industry. Consequently,
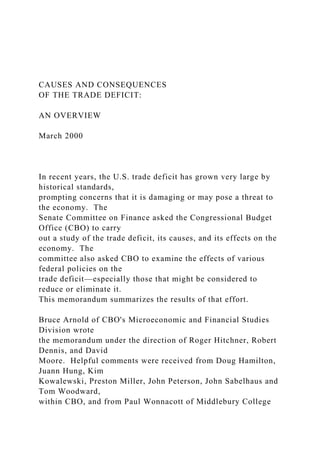
- 4. before 1970, U.S. industry seemed to have little to fear and much to gain from free trade. After 1970, however, the almost unbroken string of trade surpluses turned into one of trade deficits, and in the 1980s and 1990s, those deficits grew quite large (see Figure 1). Opponents of freer U.S. trade point to the deficits as evidence of mistaken U.S. and unfair foreign trade policies. Many are concerned that the deficits cause a number of economic ills, such as unemployment and slower economic growth, and they therefore support import restrictions and other trade policies intended to reduce or eliminate the deficits. In fact, however, the deficits are not caused by either U.S. or foreign trade policies. Rather, they are determined by the balances between saving and investment in the United States and in other countries and the effects of those balances on international flows of capital. The major changes in the U.S. trade deficit since 1970
- 5. 1. Gross domestic product is the total output of goods and services produced by factors of production (capital, labor, land, and so on) located in the United States, regardless of whether those factors are U.S. or foreign owned. 2 FIGURE 1. THE U.S. BALANCE OF TRADE, 1970-1999 SOURCE: Congressional Budget Office using data from the balance-of-payments accounts published by the Department of Commerce. NOTE: The measure plotted is the current-account balance. The value for 1999 is a CBO estimate based on published numbers for the entire year for trade in goods and services and for the first three quarters of the year for other components. can be traced to three primary sources: a long decline in saving as a share of gross domestic product (GDP) that began in the mid-1950s and accelerated in the 1980s, fluctuations in the business cycle, and relatively attractive investment opportunities in the United States in the 1990s.1 1970 1975 1980 1985 1990 1995 2000
- 6. -400 -300 -200 -100 0 100 Billions of Dollars 2. Gross saving is the portion of GDP not consumed by U.S. residents and therefore available for investment either domestically or abroad. Gross domestic investment is the total investment in the domestic economy by either U.S. residents or foreigners. 3 In the early 1980s, the percentage of GDP accounted for by gross saving fell rapidly and was reflected in a widening gap between the supply of saving and the demand for domestic investment.2 The declining share of saving had broad consequences: the economy accumulated less capital and therefore grew more slowly and paid workers lower average wages than it would have if the
- 7. share had remained higher. Inflows of capital from abroad partially filled the gap and permitted domestic investment to exceed saving. Those inflows also created a trade deficit, allowing domestic consumption and investment to exceed domestic production. The trade deficit has also fluctuated with the business cycle, increasing during economic expansions and declining during recessions. For example, the trade deficit shrank as the economy slowed in the early 1990s but has increased since the current expansion began in 1992. Some evidence suggests that demand for private investment in the 1990s has grown beyond what would be expected to occur simply as a result of a normal upswing in the business cycle. Regardless of whether that is true, substantial growth of private investment over the past decade has combined with the longer-standing low saving rate to produce today's large current-account deficits.
- 8. 4 But inflows of foreign capital carry a price tag: interest must be paid on debt owed to foreigners, and a share of profits and dividends must be paid to foreigners who invest in U.S. equities. The ease with which debt can be repaid will depend primarily on the future performance of the U.S. economy. There are no fixed required payments on equity investments; equity investors are paid only if the investment is profitable, though equity investors are generally compensated for accepting that risk with higher average expected returns. Nevertheless, the cost of paying for foreign capital invested in the United States is generally less than the benefit the United States receives from that capital. Policies promoting free trade benefit the U.S. and world economies. Although fluctuations in the trade deficit can, at times, cause painful dislocations for particular
- 9. industries and their employees and the underlying cause of the deficit can hurt the economy, deficits themselves do not cause significant long-term economic ills for the economy as a whole. The nation is generally better off allowing the inflow of capital from abroad and running a trade deficit than being forced to reduce investment to match the shortfall in savings. Trade policy normally has little if any effect on the trade deficit because it does not affect saving and investment. Policymakers could, of course, design broad and severe trade restrictions to close the deficit by choking off imports. But such polices would ultimately cause exports to decline by almost as much as imports. Hence, they 3. Unilateral current transfers include such items as government grants, taxes paid by U.S. residents to foreign governments, and taxes paid by foreign residents to the U.S. government. 4. An accounting identity is an equality that follows straight from the definitions of the terms employed and
- 10. the rules of double-entry bookkeeping. It involves no empirical observations or economic theory. 5 would reduce or eliminate both the beneficial effects of capital inflows from abroad and substantial gains from trade. They would also significantly disrupt the economy by forcing it to adjust to the lower levels of trade. Finally, trade restrictions would not reverse the long-term decline in saving as a share of GDP that brought on the deficits 20 years ago and continues to contribute to their magnitude. Rather, they would be likely to reduce investment. WHAT IS THE CURRENT-ACCOUNT BALANCE? To assess the significance of the trade balance for the economy as a whole, economists generally employ a broad measure known as the current-account balance—the sum of the balances on the trade of goods and services, income flows from foreign investments, and unilateral current transfers.3 The current-account
- 11. balance is the subject of two accounting identities that are important stepping-stones to understanding the causes and effects of trade deficits.4 o The current-account balance is equal to the negative of the financial- account balance, which is the balance on foreign investment flows. Thus, if a country runs a current-account deficit, it also runs a financial-account 5. Strictly speaking, the current-account deficit is equal to the negative of the sum of the capital- and financial- account balances. The capital-account balance of the United States is usually very small, however, and can be ignored. 6 surplus of equal magnitude, which means that the net inflow of foreign investment equals the current-account deficit.5 o The current-account balance is equal to the difference between gross saving and gross domestic investment. Thus, if a country runs a current- account deficit, its gross domestic investment is greater than its
- 12. gross saving by an amount equal to the current-account deficit. WHAT CAUSES THE CURRENT-ACCOUNT DEFICIT? According to the second accounting identity, changing the current-account balance requires changing saving, investment, or both. Events in the trade sector of the magnitude normally encountered have no significant, sustained effects on aggregate saving or investment. Such events include reduced demand for U.S. exports as a result of recessions in foreign markets, the trade policies of U.S. trading partners (even large partners such as Japan, Canada, Mexico, China, or the European Union), or any U.S. trade policy other than severe restrictions on all or almost all imports. 7 Such events can cause temporary, unintended changes. For example, an exporter whose sales to a foreign market unexpectedly decline when that market goes
- 13. into recession may be left with an unintended excess of inventory (a form of investment). But once all economic actors bring their saving and investment back in line with their intentions, total saving and investment return to their previous levels (other things being equal). Consequently, such events normally cause no more than temporary deviations of the current-account balance (perhaps a few months to a couple of years) from its long-term level. That level is determined primarily in international capital markets by the relative demands for and supplies of investment capital among countries. A Long Decline in Domestic Saving The U.S. current-account deficits of the past two decades were brought on primarily by a long downward trend in domestic saving as a percentage of GDP that began in the mid-1950s and accelerated in the early 1980s (see Figure 2). The decline led to a shortage of funds for domestic investment, which in turn
- 14. caused real (inflation- adjusted) interest rates to rise higher than they would otherwise have been. The higher interest rates attracted inflows of financial capital from abroad. The need to convert those inflows from foreign currencies into dollars increased the demand for 8 1970 1975 1980 1985 1990 1995 2000 -5 0 5 10 15 20 25 Percentage of GDP Gross Domestic Investment Gross Saving
- 15. Current-Account Balance FIGURE 2. SAVING, INVESTMENT, AND THE CURRENT- ACCOUNT BALANCE SOURCE: Congressional Budget Office using data from the national income and product accounts and the balance-of- payments accounts published by the Department of Commerce. NOTE: The value plotted for the current-account balance for 1999 is a CBO estimate based on published numbers for the entire year for trade in goods and services and for the first three quarters of the year for other components. dollars in foreign exchange markets and thereby put upward pressure on the value of the dollar relative to other currencies. As saving declined as a percentage of GDP, consumption consequently increased. The rise in consumption was larger than the decline in gross domestic investment that was induced by the higher interest rates. As a result, total domestic 9 demand for goods and services—consumption plus investment— increased, putting upward pressure on the prices of U.S. output.
- 16. The upward pressure on the dollar and the prices of U.S. output made U.S. imports less expensive for domestic purchasers and U.S. exports more expensive for foreigners. As a result, imports rose and exports fell relative to what they would otherwise have been, causing a chronic current-account deficit that equaled the net inflow of foreign investment. The larger supply of goods and services in the U.S. market partially alleviated the upward pressure on prices. Nevertheless, U.S. imports remained less expensive for domestic purchasers and U.S. exports remained more expensive for foreigners than before the drop in saving, and the deficit consequently continued. Declines in federal saving and personal saving accounted for most of the fall in gross saving over the post-World War II period. Saving by state and local governments and corporations (in the form of undistributed corporate profits)
- 17. changed comparatively little. Federal saving, as measured in the national income and product accounts, peaked in 1947 at 6.2 percent of GDP, as the federal government began paying off the debt incurred during the Great Depression and the war. It then declined for several decades, reaching negative levels in 1971 and bottoming out at -3.7 percent of GDP in 1983. Since 1992, federal saving has reversed about three- 10 fifths of that decline, reaching 2.3 percent of GDP in 1999—a reflection of the sizable federal budget surpluses. While federal saving followed a downward trend over most of the postwar period, personal saving rose from a low of 2.7 percent of GDP in 1947, peaked at 8.0 percent of GDP in the first half of the 1980s, and then began dropping precipitously. It recovered partially from 1987 through 1992 but then resumed its decline, reaching
- 18. 1.7 percent of GDP in 1999—its lowest level since the Great Depression. Although gross saving has increased significantly relative to GDP for most of the past decade, it nevertheless remains low by historical standards and continues to contribute to the large current-account deficits. The increase in saving stems largely from the improvement in the federal budget balance. A substantial portion of that improvement is cyclical, a function of the increased tax revenues and moderated spending for welfare and unemployment programs that have accompanied the record economic expansion. Some of the decline in personal saving may be cyclical as well. But even with the increase in federal saving, total gross saving was at a lower level relative to GDP in 1999 than it was throughout most of the 1950s, 1960s, and 1970s. Economists have devoted considerable research to explaining the decline in personal saving over the past two decades, but no single theory examined so far can
- 19. completely account for it. Several factors have probably contributed to the decline, 11 and it is not clear that all factors have been identified. One likely contributing factor is the large capital gains on investments in land and corporate stocks over the period, which have made people wealthier and more inclined to spend money on consumption. Another likely factor is increases in outlays in the Medicare and Social Security programs. Those programs transfer resources to the elderly, who tend to save less than other age groups do. Still another possible factor is the development and spread of new credit vehicles, such as credit cards and home-equity loans, that have eased previous constraints on consumption, but their significance is not entirely clear. Other factors appear not to have contributed to the decline in personal saving
- 20. or to have been much less significant than capital gains and spending increases in Medicare and Social Security. Those other factors include changes in interest rates, changes in the growth rate of the economy (apart from any effects that expected future changes in growth rates might have on capital gains in the stock market), and changes in the demographic composition of the population (that is, changes in the proportion of the population in age groups that typically save a smaller portion of income). 6. The 1991 surplus did not result solely from cyclical fluctuation. In 1991, the federal government received substantial sums from other countries to help defray the cost of fighting the Persian Gulf War. Those payments were included in the current-account balance. 12 The Business Cycle The chronic current-account deficit has also fluctuated with the business cycle. When a country experiences an economic boom, its investment
- 21. typically rises faster than its saving, so its current-account surplus declines (or its deficit increases). During a recession, investment typically falls faster than saving, so the current- account surplus increases (or the deficit declines). Similarly, aggregate demand (including that for imports) increases during an economic expansion and falls during a recession. In line with that typical course of events, the U.S. current-account deficit peaked in the mid-1980s when the U.S. economy was in an economic boom, declined to near zero in the early 1990s (actually becoming a slight surplus in 1991) when the country was in recession, and has increased substantially since then in line with the current prolonged economic expansion.6 Growth of Investment in the 1990s Other factors besides the business cycle may have contributed to the rapid growth of the current-account deficit in the 1990s. Although the nominal share of gross
- 22. domestic investment (government plus private) in GDP in 1999 was not particularly 13 high by historical standards, the real share of private investment was. Two factors explain why total nominal investment was not high relative to GDP in 1999: the substantial drop in federal investment in defense in the 1990s and a decline in the average price of investment goods relative to the average price of other goods and services in the economy. The real share of gross private domestic investment in GDP has trended upward since the late 1950s, and its growth since 1991 has been especially pronounced. In 1999, it reached its highest level in at least 70 years. Several factors may have boosted private investment in the 1990s beyond what one would expect in a typical economic expansion. Some analysts argue, for example, that deregulation, reduction of trade barriers, and the declining cost of
- 23. capital goods (especially computers) have increased productivity in the United States and made it a uniquely profitable place in which to invest. Whatever the merits of that argument, economic problems in Japan, several other East Asian countries, and parts of Europe have made them less attractive places for investment, further increasing the relative attractiveness of the booming U.S. economy to international investors. 7. GNP is the total output of goods and services produced by U.S.-owned factors of production (capital, labor, land, and so on) regardless of whether those factors are located in the United States or abroad. 14 DO INFLOWS OF FOREIGN CAPITAL HARM THE ECONOMY? Some observers are concerned that current-account deficits might have significant detrimental effects on the economy. In fact, the decline in saving that brought on the
- 24. continuing deficits has a number of negative economic effects, but in general, the deficits themselves do not further harm the economy as a whole. Rather, the inflows of capital from abroad benefit it by offsetting some of the negative effects of the decline in saving. Effects on GDP, GNP, and Wages The inflows of foreign investment accompanying the current- account deficit have had small positive effects on GDP and wages. Both are higher than they would have been if government policy had been used to prevent the deficit from arising in response to the decline in saving. The effect of the current-account deficit on gross national product (GNP) is even smaller, but whether the effect is positive or negative is unclear.7 GDP increases because most of the net inflow of foreign investment over time eventually translates into higher gross domestic investment in the United States (even
- 25. 15 if the initial investment is in federal debt or an already existing asset). As a result, there is more productive physical capital in the U.S. economy. The additional capital makes labor more productive, and that in turn boosts GDP and wages. The effect on GNP is smaller. Unlike GDP, GNP captures the effect of paying the cost of capital inflows from abroad—the interest and dividends paid to foreign investors. Those inflows might reduce GNP slightly if some of them ultimately translate into consumption rather than investment. Foreign investment is still generally beneficial, even in that case: people would not choose current consumption over the future income from investment unless they felt the consumption was of greater benefit. If all of the foreign capital inflows financed gross investment that added to the capital stock, the resulting additional output would probably be more
- 26. than enough to make payments to foreigners, and the current- account deficit would have a small, positive effect on GNP. Effects on Different Sectors of the Economy The inflow of foreign capital associated with the trade deficit has changed the distribution of output and employment among various sectors of the economy. Free trade, which may sometimes imply a trade deficit, can hurt certain workers and businesses in industries that face particularly stiff foreign competition. Recognizing 16 that workers in industries negatively affected by trade often cannot move swiftly to new, growing industries, the Congress has enacted laws creating a system of trade adjustment assistance to try to compensate those workers, although making the system work poses some difficult challenges. However, the inflow of capital that
- 27. accompanies a trade deficit will help other industries, particularly those in interest-sensitive sectors such as the ones that produce investment goods. On balance, allowing inflows of foreign capital strengthens the nation's productive capacity, boosting production and income. Concerns About Foreign Finance and Economic Stability The continuation of large current-account deficits caused the U.S. net international investment position (NIIP) to become negative in the late 1980s for the first time since 1915. The NIIP is the total of U.S.-owned assets in other countries minus the total of foreign-owned assets in the United States. The NIIP has become increasingly negative since the late 1980s and will continue that trend as long as deficits persist. The size and growth of the negative NIIP have prompted concerns about whether foreigners continue to finance the trade deficit and how a negative investment position affects the stability of the economy.
- 28. 17 Will Foreigners Continue to Finance the Deficits? Most investors prefer to keep a large portion of their investments in their own country, or at least in investments denominated in their own currency. They do that to avoid various risks of international investing, not the least of which is the risk of adverse movements in exchange rates. Consequently, encouraging foreigners to devote an increasingly large share of their investment portfolios to a particular country (such as the United States) often requires an increasingly large premium in the return paid on assets in that country. Indeed, real interest rates rose in the United States around 1980, when the large current-account deficits and corresponding financial- account surpluses began. Although real interest rates have not followed a rising trend since then, some observers worry that a continuation of the large current-account deficits will
- 29. eventually boost interest rates further as foreigners become sated with U.S. assets and stop increasing the share of their portfolios invested here. Should that happen, the rise in interest rates would cause gross domestic investment in the United States to decline, thereby reducing or eliminating the current-account deficit. But such an eventuality would not drive interest rates higher than they would be if the current- account deficit was eliminated by trade policy. Effects on the Stability of the Economy. Although the United States may have the largest negative NIIP in the world, it also has the largest economy against which that investment position must be compared when analyzing the NIIP's effect on economic 18 stability. Furthermore, as of 1998, about half of investment included in the NIIP was equity, not debt. Although a substantial buildup of debt decreases the stability of
- 30. GNP in the same way that leveraging a corporation decreases the stability of its profits, a buildup of equity has the opposite effect. As a result of foreign equity investment in the United States, part of the increase in profits during economic booms and part of the decrease in profits during recessions fall on foreigners rather than Americans, and that tends to moderate swings in the business cycle. Some people worry about a more extreme version of instability in which investors suddenly attempt to pull their funds out. That happened recently in a number of East Asian countries and earlier in several Latin American countries. The risk of such capital flight for the United States is very low, for at least two reasons. First, the U.S. capital market is much larger relative to the world market than are the markets of countries that have experienced such capital flight. Consequently, the scale of capital flight required to cause the same level of disruption to the U.S.
- 31. economy would be much larger relative to the world capital market and less likely to occur. Second, capital flight usually results from investors' fears of losing their money. Those fears usually arise either because the country is highly leveraged and having difficulty paying its debt as a result of slower-than- expected growth or because the country is trying to maintain an overvalued exchange rate for its currency that investors fear cannot be sustained. Neither condition applies to the United States. 19 Restricting trade to reduce the current-account deficit (with the intention of preserving economic stability) might itself decrease the stability of the economy. As a result of the free-trade policies that allow the deficits to develop, part of the increase in demand for goods and services during economic booms and part of the
- 32. reduction in demand during recessions falls on the foreign suppliers of U.S. imports and their employees rather than on their U.S. counterparts. Other effects can go in the opposite direction; for example, part of the drop in income during recessions in other countries will fall on U.S. exporters to the countries in question. Nonetheless, the net effect of free trade on average is likely to be more stable GDP, GNP, and employment. The reason is that the total sales of a firm to several countries tend to be more stable than the sales to any one country—a benefit of diversification. SHOULD ANYTHING BE DONE ABOUT THE CURRENT-ACCOUNT DEFICIT? Since the effects of the deficit are small and—in important ways—positive, there is no economic reason to use trade policy to attempt to reduce or eliminate it. In fact, such use would more likely hurt the economy. It would have little effect on saving and would close the imbalance between saving and investment primarily by reducing
- 33. investment. The case against such use of trade policy is much stronger than that, however. Most such uses would be ineffective, and those that would actually work 20 would have substantially damaging effects of their own on the economy beyond the negative effects of the deficit reduction itself. Some tools of trade policy, such as subsidizing exports and encouraging other countries to eliminate their barriers to imports from the United States, would have no significant effect on the current-account balance (see Table 1). Although using such tools might increase U.S. exports, the resulting increased demand for the dollar in foreign exchange markets (since foreigners would need more dollars to purchase the additional U.S. exports) would cause the dollar to rise relative to other currencies. That would make U.S. imports cheaper, so imports would increase by roughly the
- 34. same amount as exports. As a result, the current-account deficit would not be significantly affected. The current-account balance is also not very sensitive to import restrictions, such as tariffs (taxes on imports) or quotas (limits on the physical amount or value of a good or service that is imported). Although restrictions would reduce imports, the resulting decline in the supply of dollars to the foreign exchange market would cause the dollar to rise in value relative to other currencies. That, in turn, would make U.S. exports more expensive, causing them to fall by almost as much as imports. Thus, although tariffs would help producers that competed with imports in the industries to which the tariffs were applied, they would hurt exporters and import- competing industries that were unprotected. Sufficiently severe trade restrictions 21
- 35. TABLE 1. EFFECTS OF VARIOUS TRADE-RELATED POLICIES ON THE CURRENT- ACCOUNT DEFICIT Policy Effect on the Current-Account Deficit Trade Policy Export subsidies Increase exports and imports by roughly equal amounts because of policy-related movements in exchange rates; have little if any effect on the current-account deficit. Reduce federal saving and raise the current-account deficit if subsidies are not offset by decreases in other spending or increases in receipts. Eliminating foreign trade barriers Increase exports and imports by roughly equal amounts because of policy-related movements in exchange rates; have little if any effect on the current-account deficit. Standard tariffs and quotas Reduce exports and imports by roughly equal amounts because of policy-related movements in exchange rates; have little effect on the current-account deficit unless tariffs and quotas are sufficient to eliminate almost all trade. Higher tariff revenues, if they occur and are not spent for other purposes, increase federal saving and decrease the current-account deficit. Combined import tariffs and export subsidies (of equal rate)
- 36. Policy-related movements in exchange rates offset tariffs and subsidies; have little if any effect on imports, exports, or the current-account deficit. Exchange Rate Policy Has little if any effect on the current- account deficit. Benign Neglect—No Policy Action The current-account deficit is likely to decline on its own as a share of gross domestic product over the next decade. SOURCE: Congressional Budget Office. 22 could eliminate the deficit since they could completely shut off all imports; with no imports, there can be no trade deficit. The decline in imports and exports, however, would severely disrupt the economy. Even if not taken to that extreme, using trade barriers to reduce the deficit would be highly damaging to the economy. Fairly simple calculations indicate that imports and exports would each decline by a much larger amount than the current- account deficit—possibly several times the amount. Those
- 37. reductions would greatly diminish the gains from trade that arise from comparative advantage, specialization, and economies of scale. They would also increase unemployment temporarily as exporting industries contracted, forcing workers to find new employment in other industries. Such frictional unemployment could be severe if the trade barrier was high and broad enough. Intervening in foreign exchange markets to drive down the dollar relative to other currencies and thereby relieve pressure on U.S. exporters and importers would not reduce the deficit because it would also cause an offsetting increase in the U.S. price level. Even if accompanied by monetary policy designed to prevent the offsetting price increase, such intervention could be effective for only a short period. Furthermore, to whatever extent it actually succeeded in lowering the deficit (which would be small, at best), it would do so by lowering investment, not by increasing
- 38. saving. 23 Because of the ineffectiveness of trade and exchange rate policies in reducing the current-account deficit, the harm that can come from their use, and the benefits of being able to borrow on world capital markets, a better response from an economic standpoint is simply to wait for the trade deficit to subside on its own. The trade deficit is likely to decline significantly as a percentage of GNP over the next 10 years. Any slowing of the rapid pace of U.S. economic expansion will tend to moderate the ongoing surge of the deficit, as will the recovery of Japan and other foreign countries from their economic problems. In addition, some of the leading factors that help explain the decline in personal saving that has contributed to the deficits of the past two decades may also moderate.
- 39. The current-account deficit might be further reduced by policy reforms that have been proposed in other areas for reasons unrelated to their effects on trade. Any reform that either increases saving or reduces investment will lower the current- account deficit. Proposed reforms with the potential to significantly affect saving include changes in the tax system and reforms that would improve the federal fiscal position. Various proposals have been made to revise the structure of the federal income tax to increase incentives to save, but most of them would do little to reduce the current-account deficit. Some proposals for comprehensive tax reform, which would effectively convert the income tax to a consumption tax and integrate the corporate 24 tax with the personal tax, would increase both saving and investment, at least in the
- 40. very long term. But to reduce the deficit, saving would have to increase more than investment, and it is not clear that would happen. Other proposals—for example, expanding tax-preferred savings accounts (such as individual retirement accounts)— would slightly increase private saving. However, if the resulting drop in revenues was not offset by other tax increases or spending reductions, federal saving would almost certainly decline by even more. Increases in the federal budget surplus affect the trade deficit. Other things being equal, each dollar increase in the budget surplus would boost total saving in the economy by roughly 50 cents to 80 cents. However, the economic expansion that is contributing to current and projected budget surpluses is also accompanied by large increases in demand for domestic investment. Greater demand offsets (and will probably continue to do so) some of the reduction in the current-account balance that would otherwise result from the increases in the budget surplus.
- 41. CONCLUSION Since the trade deficit is an excess of imports over exports and obviously hurts some people, it would seem on the surface to be a problem of international trade that might be fixed or alleviated by the tools of trade policy. In fact, however, it is not. Its 25 cause lies not in international trade but in factors affecting international capital flows. In the case of the recent U.S. trade deficits, those factors are largely of domestic origin—a long decline in saving, a prolonged upswing in the business cycle, and perhaps a number of changes in the U.S. economy that have made it a particularly productive place for international investors to put their funds. Although some people are harmed by the deficits, others are helped. On balance, the continuing deficits have small, beneficial consequences for the United States.
- 42. Given the benefits of the trade deficit, there is little if any reason to try to reduce or eliminate it, particularly since it is likely to subside on its own even without any policy response. Further, if one nevertheless wanted to reduce the deficit, trade policy would not be a good way to accomplish that goal. Short of broad restrictions on imports of a magnitude much larger than is normally discussed in policy debates today, the standard tools of trade policy will not have much effect on the deficit. Under restrictions that were severe enough to substantially reduce the deficit, both imports and exports would ultimately decline much more than the deficit, disrupting the economy and causing unemployment in the export sector and possibly elsewhere. In general, the government policies that are most likely to have a large impact on the deficit are not trade policies but budget policy and any other policies that substantially influence saving and investment in the economy. Other effects of those
- 43. policies, however, are generally more important than their effects on the current- account deficit. 10 Trade Deficits: Causes and Consequences David M. Gould Senior Economist and Policy Advisor Federal Reserve Bank of Dallas Roy J. Ruffin Research Associate Federal Reserve Bank of Dallas and M. D. Anderson Professor of Economics University of Houston For the most part, trade deficits or surpluses are merely a reflection of a country’s international borrowing or lending profile over time. …Neither one, by itself,
- 44. is a better indicator of long-run economic growth than the other. On September 19, 1996, the Washington Post, Wall Street Journal, and New York Times reported trade figures released by the U.S. De- partment of Commerce showing that the monthly U.S. trade deficit increased by $3.5 billion in July 1996. Almost unanimously, analysts quoted in the articles stated that the recent trade figures showed weakness in the U.S. economy. The news was not earth shattering, nor was the interpretation of the increasing trade deficit con- troversial. The conventional wisdom is that the trade balance reflects a country’s competitive strength —the lower the trade deficit, the greater a country’s competitive strength and the higher its economic growth. But the conventional wisdom on trade bal- ances stands in stark contrast to that of the economics profession in general. Standard eco- nomic thought typically regards trade deficits as the inevitable consequence of a country’s pref- erences regarding saving and the productivity of its new capital investments. Trade deficits are not necessarily seen as a cause for concern, nor are they seen as good predictors of a country’s future economic growth. For example, large trade deficits may signal higher rates of economic growth as countries import capital to expand productive capacity. However, they also may reflect a low level of savings and make countries more vulnerable to external economic shocks,
- 45. such as dramatic reversals of capital inflows. Is the conventional wisdom wrong, or has the economics profession just failed to keep its theories well-grounded in fact? Certainly, anyone can create a theory about trade deficits and speculate about how they may, or may not, be related to a nation’s eco- nomic performance. The paramount question is not whether one can create a theory, but whether it is logically consistent and stands up to em- pirical observation. The purpose of this article is to answer the question of whether trade deficits, bilateral as well as overall, are related to a country’s eco- nomic performance. We begin by discussing the origin of popular views on trade deficits and compare these views with current economic thought on trade balances. Next, we discuss the relationship between international capital flows and trade balances and relate them to economic growth. We then empirically examine the rela- tionship between trade deficits and long-run economic growth. The evolution of ideas about trade balances The mercantilists. Much of the current popular thinking on trade balances can trace its FEDERAL RESERVE BANK OF DALLAS 11 ECONOMIC REVIEW FOURTH QUARTER 1996
- 46. intellectual roots to a group of writers in the seventeenth and eighteenth centuries called the mercantilists. The mercantilists advanced the view that a country’s gain from international commerce depends on having a “favorable” trade balance (favorable balance meaning that exports are greater than imports). The mercan- tilists were businessmen, and they looked at a country’s trade balance as analogous to a firm’s profit and loss statement. The greater are re- ceipts over outlays (exports over imports), the more profitable (competitive) is the business (country). Thus, they argued that a country could benefit from protectionist policies that encour- aged exports and discouraged imports. Because most international transactions during the seventeenth and eighteenth centuries were paid for with gold and silver, mercantilists were ad- vocating a trade surplus so that the country would accumulate the precious metals and, according to their arguments, become rich.1 In 1752, David Hume exposed a logical inconsistency in the mercantilism doctrine through his explanation of the “specie-flow mechanism.”2 The specie-flow mechanism refers to the natural movement of money and goods under a gold standard or, indeed, any fixed exchange rate system in which the domestic money supply is inextricably linked to a reserve asset. The reserve asset need not be gold.3 Hume argued that an accumulation of gold from persistent trade surpluses increases the overall supply of circulating money within the country, and this would cause inflation. The
- 47. increase in overall inflation also would be seen in an increase in input prices and wages. Hence, the country with the trade surplus soon would find its competitive price advantage disappear- ing as prices rose but the exchange rate re- mained constant. Automatically, through the specie-flow mechanism, the country with a trade surplus would find that its surplus shrank as its prices rose relative to other countries’ prices. Any attempt to restore the trade surplus by raising tariffs or imposing other protectionist policies would simply result in another round of cost inflation, leading ultimately to a balance between exports and imports once again. Several of the mercantilists —such as Gerard de Malynes (1601) and Sir Thomas Mun (1664) — understood the problems of maintaining a per- petual trade surplus as domestic prices rose but discounted this problem as a very long-run phenomenon and emphasized the benefits of accumulating gold as a means of exchange in a hostile and uncertain world.4 A few decades after Hume’s original writ- ings, economists such as Adam Smith and David Ricardo added further arguments against the mercantilistic advocacy of trade surpluses. They argued that what really matters to a country is its terms of trade —that is, the price it pays for its imports relative to the price it receives for its exports. Smith and Ricardo stood the advo- cacy of trade surpluses on its head when they showed that a country is better off the more imports it receives for a given number of exports
- 48. and not vice versa. They argued that the mer- cantilistic analogy between a country’s exports and a firm’s sales was faulty. Adam Smith in 1776 argued that money to an economy is different from money to an indi- vidual or firm. A business firm’s objective is to maximize the difference between its imports of money and its exports of money. Money “imports” are the sale of goods and money “exports” are the purchases of labor and other inputs to production. However, for the economy as a whole, wealth consists of goods and ser- vices, not gold. Money, or gold, is useful as a medium of exchange, but it cannot be worn or eaten by a country. More money, in the medium and long run, just results in a higher level of prices. In the short run, however, Adam Smith also recognized that under the gold standard, a country’s supply of gold would enable it to purchase the goods of other countries. To some extent, therefore, the argument between the most able mercantilists and the classical economists was partly a question of emphasis —the mercantilists were concentrating on the fact that in the short run, the accumula- tion of money is wealth, while the classical economists were concentrating on the fact that in the long run, it is only the quantity of goods and services available that is wealth. However, the classical economists primarily were respond- ing to the naive writings of most mercantilists, who confused the flow of money with the flow of goods in the short and long run.
- 49. National income accounting. Perhaps the great emphasis placed on national income accounting today is an important reason the naive form of mercantilism lives on in the hearts of many individuals. According to basic national income accounting, gross domestic product (GDP ) is consumption (C ) plus invest- ment (I ) plus government spending (G ) plus exports (X ) minus imports (M ) —that is, GDP = C + I + G + X – M. This makes it appear that exports increase gross domestic product while imports reduce gross 12 domestic product. This is erroneous because the definition of gross domestic product is just a tautology, and no conclusion about causality is possible. For example, it is equally true that the volume of goods and services available to an economy (C + I + G ) consists of domestic output (GDP ) plus imports minus exports —that is, C + I + G = GDP + M – X. Looked at in this way, a trade deficit appears to be “favorable” because we ultimately are interested in domestic spending. But this, too, is definitional. The question of whether defi- cits improve or hurt the economy cannot be resolved by such tautological manipulations. Theory and empirical evidence are required
- 50. to evaluate whether deficits are favorable or unfavorable. Employment and trade balances. The na- tional income accounting view often leads many to associate trade deficits with reductions in employment. For example, some have argued that for every million dollars the United States has in its trade deficit, it costs about thirty-three American jobs, assuming that the average worker earns $30,000 a year (that is, $1,000,000/$30,000 = 33.33). So this implies that the July 1996 trade deficit of $11.7 billion cost around 390,000 jobs.5 This calculation, however, is based on the fallacious assumption that capital inflows do not find their way into productive activity. Because a trade deficit is associated with capital inflows (to finance the deficit), the jobs lost by the deficit would be restored by the inflows of capital in expanding sectors of the economy. Gould, Ruffin, and Woodbridge (1993) corre- lated unemployment rates of the twenty-three OECD (Organization for Economic Cooperation and Development) countries with their import penetration ratios (the ratio of imports to GDP) and their export performance ratios (the ratio of exports to GDP) over thirty-eight years. They found that, for about half the countries, the correlation between import penetration ratios and unemployment rates (future or present) is negative (that is, higher imports are related to lower unemployment). More importantly, however, they found that there is no instance of a significant positive or negative correlation of import penetration
- 51. ratios with unemployment rates that is not the same for export performance ratios. In other words, exports and imports always had the same type of correlation with unemployment rates. Exports and imports are more related to each other than they are to other macroeconomic factors like unemployment rates because, ulti- mately, exports must pay for imports. International capital movements and the balance of payments From a public policy viewpoint, the funda- mental question is: Do trade deficits reflect a malfunctioning of the economic system? If they do, perhaps limiting their size can improve a country’s future standard of living. What is known, however, is that trade deficits or sur- pluses ultimately depend on a country’s prefer- ences regarding present and future consumption and the profitability of new capital investments. In understanding movements in the balance of trade, it helps to see their connection to move- ments in the balance of international capital flows. In a world of international capital mobil- ity, trade deficits and international capital move- ments are the result of the same set of economic circumstances. As first discussed by J. E. Cairnes (1874), international capital flows go through certain natural stages. The capital account balance (or the trade balance) should be seen as balancing a country’s propensity to save with a country’s investment opportunities and its resulting in-
- 52. come payments, rather than as negative or positive indicators. The benefit of international capital flows and trade imbalances is that, in ordinary circumstances, they can lead to an effi- cient allocation of resources around the world. Net capital importers get their scarce capital more cheaply, and net capital exporters receive a higher return on their investments. In turn, capital imports finance trade deficits and trade surpluses finance capital exports. In fact, under the right circumstances, a country can run a perpetual trade deficit or surplus. What matters for the balance of trade is how long a country has been a borrower or lender in international capital markets. How can countries maintain a perpetual trade deficit or surplus? Over time, the longer a country imports capital, the larger the interest rate payments on that capital. Eventually, a long-term debtor country will be borrowing less than its interest payments on existing debt to other countries and, in the steady-state, necessarily will have a trade surplus to pay these interest payments. A long-term creditor country will be lending less to other countries than its income receipts from other countries and will have a perpetual trade deficit. (For a fuller description of this mechanism, see the box entitled International Capital Flows and the Balance of Trade and the appendix.) FEDERAL RESERVE BANK OF DALLAS 13 ECONOMIC REVIEW FOURTH QUARTER 1996
- 53. Countries also can be in transition from a long-term creditor or debtor country to a short- term creditor or debtor country. The United States, for example, was a long-term creditor country throughout the 1970s, with trade deficits partly or wholly financed by net income pay- ments from foreigners. However, in the 1980s, the U.S. trade deficit ballooned as both capital imports and income payments financed the deficit. The country was in transition until the net income account turned negative in 1994. Today, the United States must be regarded as a short-term debtor country. Japan, on the other hand, represents a major short-term creditor country. Table 1 shows a snapshot of the 1994 balance of payments for several major countries. We show the net capital account, the net income account, and the trade and transfers account (the sum of net exports of goods and services and net transfers from the rest of the world). The current account (not shown) is the sum of the first and last columns; we separate the two components to illustrate the forces at work. It is very difficult to find examples of long-term creditor countries. The United Kingdom comes close, with its trade deficit and large net in- come from foreign investments, but the country may be entering a transition period. Austria is another example. There are more examples of long-term debtor countries, such as Canada and most of the Scandinavian countries. Today, the United States has a relatively
- 54. small obligation as far as investment income is concerned. But as we continue to be a debtor nation, the accumulated debts with the rest of the world will grow so large that the debt- service payments become larger than any amount of fresh capital borrowed by the country. If the United States continues to borrow, it will be- come a long-term debtor country. At this point, we will be in a perpetual balance-of-trade sur- plus. This must happen in order to pay the foreigners who own assets in the United States. Thus, the U.S. trade deficit in the future should completely turn around. A key conclusion from this analysis and an examination of the relationship between capi- tal flows and economic growth (see the appen- dix) is that, in the long run, there should be no link between economic growth and the trade The trade balance is a reflection of how long a country has been a borrower or lender in international capital markets. To see this relationship, it is helpful to examine the basic structure of a country’s balance of payments. Let X = exports, M = imports, T = net gifts or unilateral transfers to foreigners, ∆B = net new borrowing from abroad, B = net indebtedness to the rest of the world, and r = the rate of interest on foreign indebtedness. A country’s balance of payments must be X + ∆B = T + M + rB. The left-hand side of the equation refers to receipts from foreigners; the right-hand side refers to payments to foreigners. These must always balance. If ∆B > 0, a
- 55. country is borrowing; if B > 0, a country is a net debtor. If ∆B < 0, a country is lending, and if B < 0, a country is a net creditor. A country is considered to be a relatively short-term borrowing nation when its net indebtedness, B, is small compared with its net new borrowing, ∆B. In this case, imports will be greater than exports (M > X ). A country is considered to be a relatively long-term borrowing nation when the interest it pays on foreign indebtedness, rB, is larger than its net new borrowing from abroad, ∆B. Here, exports are greater than imports (X > M ). The opposite is true for a short-term or long-term creditor country. International Capital Flows and the Balance of Trade Table 1 The Balance of Trade and Net Capital and Income Accounts, 1994 (Millions of U.S. dollars) Trade and Capital Income Country transfers account account Australia $ –5,604 $ 15,860 $ –11,876 Austria – 630 –1,822 2,804 Belgium – Luxembourg 8,167 –10,452 4,853 Brazil 7,938 7,965 – 9,091 Canada 3,754 8,331 – 21,242 Chile 1,016 4,541 –1,773 Denmark 7,980 – 5,537 – 5,320 Finland 5,294 4,286 – 4,226 France 19,051 – 5,015 –10,962 Germany – 28,584 24,501 4,704 Japan 88,910 – 86,190 40,330 Korea – 2,301 10,610 –1,554 Mexico –17,039 12,754 –11,754
- 56. Netherlands 11,826 – 6,485 1,546 Norway 5,413 –1,321 –1,769 Spain 1,496 4,449 – 7,923 Sweden 6,690 6,390 – 5,874 Switzerland 9,949 16,469 8,545 United Kingdom –18,520 – 24,562 16,129 United States –140,440 120,806 –10,494 SOURCE: International Financial Statistics — capital account, line 78bjd; income account, line 78agd + line 78ahd; balance of trade and net transfers, line 78afd + line 78ajd + line 78akd. 14 balance. The long-run trade balance is jointly determined with the net creditor or debtor status of the country, while the long-run growth rate is determined by the growth rate of the population and technological progress. The next section is devoted to the empirical relationship between economic growth rates and trade imbalances, after controlling for other factors determining the rate of growth. Are trade balances related to long-run economic growth? Although the theoretical exposition above concludes that trade balances should not be related to long-run economic growth, the rele- vance of that theory has yet to be empirically examined. Moreover, there are other possible
- 57. elements of trade balances, not discussed above, that may have implications for long-run eco- nomic growth. For example, large trade deficits imply large inflows of international capital. But international capital inflows may be subject to dramatic reversals, due to external shocks to a country’s export sector and changes in foreign sentiment. In such cases, large trade deficits may be seen as an indicator of a country’s vulnerabil- ity to external shocks. If large inflows of capital and trade deficits make a country more vulner- able to external economic shocks, long-run eco- nomic growth may be hampered. While several studies have found that freer international trade (exports and imports) is an important determinant of cross-country growth rates, trade balances (the difference between exports and imports) have yet to be explored. This section examines the question of whether overall and bilateral trade balances are related to long-run rates of economic growth. Overall trade balances. Empirically, one can imagine circumstances in which the trade bal- ance is correlated to a nation’s rate of economic growth, even though it may not cause it. Sup- pose, for example, that a nation is moving from a relatively closed economy to integration with the world economy—perhaps East Germany after the Berlin Wall fell in 1989. A country just opening up to world markets, like East Ger- many, would have a relatively high potential for future growth and would likely experience net capital inflows. But large capital inflows would be associated with large trade deficits. Conse-
- 58. quently, there would appear to be a positive relationship between trade deficits and higher rates of economic growth. The higher rates of economic growth, however, are not caused by the larger trade deficits but by the opening up of domestic markets. In contrast, trade deficits may be nega- tively related to economic growth if they reflect impediments to the market mechanism. Here again, however, the trade deficit itself is not causing lower growth but is itself determined by another factor that affects growth and the trade deficit. For example, it has been shown that the share of government consumption in GDP is negatively correlated to economic growth across countries (Barro 1991, and Levine and Renelt 1992). If a large share of government consumption tends to stimulate the demand for imports, generates a trade deficit, and reduces growth, this would show up as a negative corre- lation between trade deficits and economic growth, even though there is no causal relation- ship between the two. What is really decreasing growth is the large share of government con- sumption in total GDP, not the trade deficit. Bilateral trade balances. While a country’s overall trade may be balanced, a country may have bilateral deficits with many of its trading partners. Consequently, the relationship between overall trade balances and economic growth (discussed earlier) should not necessarily be the same as that between bilateral trade balances and economic growth. Nonetheless, we exam- ine the empirical relationship between bilateral
- 59. trade balances and economic growth because much popular attention has focused on this aspect of our trade account. To do the analysis, we develop a summary measure of bilateral trade balances that indicates the degree to which a country’s bilateral trade flows are imbalanced (that is, bilateral exports and im- ports are unequal). As is the case with overall trade imbal- ances, there is no theoretical reason bilateral trade imbalances should be related to economic growth. It is likely that countries that specialize in primary products will have higher bilateral imbalances than countries that specialize in manu- factured goods. The reason is that a primary product producer cannot sell much to another country that produces the same primary prod- uct. On the other hand, a country that exports manufactured goods can easily sell manufac- tured goods to another country that exports manufactured goods because of the diversity of manufactured goods and intraindustry trade. In fact, the correlation between our mea- sure of bilateral imbalances (see note 12) and per capita real GDP is – 0.62. This may be ex- plained by the fact that countries with lower per capita GDPs tend to export fewer manufactured goods. Moreover, if protectionism rises with greater bilateral imbalances, bilateral imbalances FEDERAL RESERVE BANK OF DALLAS 15 ECONOMIC REVIEW FOURTH QUARTER 1996
- 60. may be negatively related to economic growth. For example, U.S. protectionism against Japa- nese products may rise as the U.S. bilateral trade deficit with Japan increases. Because several studies on the determinants of economic growth have found that protectionism tends to decrease long-run growth rates, there may be a negative correlation between bilateral imbalances and economic growth.6 The next section attempts to empirically determine whether there is any relationship between overall and bilateral trade balances and economic growth when taking into consideration the underlying fundamental determinants of economic growth. Trade balances and economic growth The benchmark model. Before examining the role of trade balances in economic growth, we first present the results of a basic benchmark growth model. The model utilizes a formulation that is common to many of the recent cross- country empirical examinations of growth and attempts to control for the underlying determi- nants of long-run economic growth.7 Equation 1 of Table 2 presents the estimation results of the benchmark model.8 The dependent variable is the average annual real per capita GDP growth rate between 1960 and 1989,9 and the explana- tory variables are (1) the log of real GDP per capita in 1960, ln(Y 60); (2) physical capital savings, which is the log of the share of in- vestment in gross domestic product, ln(I/ Y ); and (3) a proxy for human capital savings —
- 61. the log of secondary-school enrollment rates in 1960–89, ln(School ). The results of the benchmark model are consistent with most recent growth studies. Real GDP per capita in 1960 is negative and highly significant, suggesting income convergence con- ditional on human capital.10 Physical capital sav- ings and the proxy for human capital savings, ln(I/Y ) and ln(School ), are positive and signifi- cant at the 1-percent level, consistent with the empirical findings of Levine and Renelt (1992). Equation 2 of Table 2 examines the role of capital controls, as proxied by black market Table 2 The Role of Trade Balances in Growth Dependent variable: average yearly real GDP per capita growth, 1960 – 89 (1) (2) (3) (4) (5) Constant 15.327 15.653 15.187 15.17 14.279 (3.602) (4.236) (2.902) (3.336) (3.818) ln (Y60) –.837 –.933 –.801 –.863 –.943 (– 3.852) (4.354) (– 3.546) (– 3.636) (– 4.404) ln (I /Y ) 3.251 2.970 3.048 2.963 3.149 (8.521) (7.634) (7.897) (7.486) (7.651) ln (School ) .904 .922 .850 .893 .843 (6.651) (6.973) (6.185) (6.447) (5.607)
- 62. Exchange controls –.005 –.004 –.005 –.005 (– 2.495) (–1.956) (– 2.231) (– 2.414) Share of all years .007 in deficit (1.657) Trade deficit as a –.004 share of trade (–.703) Bilateral imbalance –.895 as a share of trade (–.601) R – 2 .684 .681 .664 .679 .663 RMSE 1.092 1.061 1.081 1.064 1.092 Observations 91 91 91 91 91 NOTES: t values are in parentheses. Real per capita growth is the least squares estimate; Y60 is real per capita GDP in 1960; I /Y is investment as a share of GDP, 1960– 89; School is secondary-school enrollment rates, 1960 – 89; exchange controls is the black market premium. SOURCES OF PRIMARY DATA: Real per capita growth and Y 60, Summers and Heston (1991) Penn World Tables, version 5.6; I/Y, World Bank National Accounts; School, Barro (1991); exchange controls, Levine and Renelt (1992); trade deficit as a share of total trade, bilateral imbalance as a share of total trade, and share of all years in deficit, authors’ calculations based on data from the International Monetary Fund, Direction of Trade Statistics. 16
- 63. SOURCES OF PRIMARY DATA: Same as Table 2. Table 3 Trade balances and growth Bilateral Trade deficit trade imbalance Share of as a share as a share all years Country Growth of trade of trade in deficit Angola – 2.7 – 20.7 43.5 25.0 Chad – 2.4 28.9 49.0 89.3 Mozambique – 2.0 39.4 42.8 100.0 Madagascar – 1.8 10.2 35.5 81.8 Zambia – 1.4 –11.1 52.3 21.4 Central African Republic –.5 –2.5 41.2 46.9 Ghana –.5 6.3 37.2 72.7 Liberia –.5 –15.5 39.3 4.5 Niger –.4 4.5 37.6 86.7 Benin –.2 55.3 39.8 100.0 Senegal –.2 23.3 34.8 96.9 Uganda –.2 –5.1 52.0 24.2 Guyana 0 2.8 33.2 55.2 Sierra Leone 0 11.6 47.5 68.8 Mauritania .1 –12.1 55.8 12.5 Sudan .1 34.4 44.9 90.9 Zaire .2 –16.4 39.1 7.7 Somalia .2 39.4 63.0 93.1 Bangladesh .2 41.0 47.6 95.2 Haiti .3 34.3 30.9 76.7 Mali .3 36.9 47.7 96.8 Uruguay .6 1.6 39.6 45.5
- 64. Nigeria .7 –16.5 42.7 21.9 India .8 18.0 31.1 93.9 Ethiopia .8 24.0 47.8 96.3 Papua New Guinea .8 – 4.8 45.3 48.3 Average –.3 12.2 43.4 63.7 Nepal .9 45.4 48.1 100.0 Bolivia 1.0 – 5.6 41.0 30.3 Chile 1.0 – 5.8 33.0 27.3 Sri Lanka 1.1 16.8 40.0 90.9 Nicaragua 1.1 24.0 36.6 90.3 Argentina 1.1 –15.0 40.1 22.6 Malawi 1.3 17.5 44.3 96.6 El Salvador 1.3 14.1 29.7 78.8 Honduras 1.3 6.9 29.4 90.9 Guatemala 1.5 10.8 27.4 78.8 Burkina Faso 1.6 53.9 43.7 97.0 Kenya 1.6 24.7 43.1 100.0 Zimbabwe 1.6 –1.0 31.3 40.0 South Africa 1.6 –14.5 39.8 21.2 Peru 1.7 –10.7 27.3 15.2 Mauritius 1.7 6.5 60.0 66.7 Burundi 1.7 19.7 56.7 87.5 New Zealand 1.8 .7 25.3 54.5 Togo 1.8 30.8 42.3 90.9 Jamaica 1.9 20.4 34.5 100.0 Pakistan 1.9 24.1 35.9 97.0 United States 1.9 12.5 19.8 69.7 Rwanda 2.0 30.2 50.0 89.7 United Kingdom 2.2 7.3 16.8 100.0 Switzerland 2.2 4.7 22.6 93.9 Venezuela 2.2 – 21.2 34.8 12.1
- 65. Average 1.6 11.4 36.7 70.8 Bilateral Trade deficit trade imbalance Share of as a share as a share all years Country Growth of trade of trade in deficit Tanzania 2.3 27.7 36.0 69.0 Colombia 2.3 1.9 24.9 57.6 Paraguay 2.3 13.4 38.1 66.7 Philippines 2.3 15.1 26.8 93.9 Australia 2.3 –.8 33.6 42.4 Canada 2.4 – 4.5 13.5 6.1 Costa Rica 2.5 11.9 30.0 100.0 Dominican Republic 2.5 23.7 39.9 54.5 Iraq 2.5 – 8.9 52.0 50.0 Sweden 2.6 – 2.5 19.5 54.5 Mexico 2.6 0 18.2 75.8 Ireland 2.7 –.3 21.6 75.8 Morocco 2.8 24.4 27.7 100.0 Ecuador 2.8 – 9.2 35.3 39.4 Gambia 2.9 25.0 52.6 64.3 Turkey 2.9 24.1 25.3 100.0 Denmark 2.9 2.5 18.6 81.8 Netherlands 3.0 –.2 20.0 63.6 Iran 3.1 2.3 42.8 60.0 Barbados 3.1 39.7 37.3 100.0 Jordan 3.1 54.6 53.8 100.0 Suriname 3.3 2.1 39.9 58.6 Trinidad and Tobago 3.3 – 8.0 49.2 46.9 Tunisia 3.3 22.8 30.2 100.0
- 66. Average 2.7 11.9 32.8 68.9 Germany, West 3.4 – 7.3 15.7 0 France 3.4 3.5 17.5 93.9 Norway 3.4 – 2.8 27.6 69.7 Panama 3.5 60.6 46.8 100.0 Congo 3.5 –18.3 57.1 48.5 Cameroon 3.6 2.3 36.7 54.5 Thailand 3.6 12.5 34.6 100.0 Israel 3.6 24.3 30.7 100.0 Finland 3.6 .5 19.0 69.7 Spain 3.6 21.7 25.7 97.0 Algeria 3.7 – 5.4 30.0 46.7 Austria 3.9 10.9 21.1 100.0 Malaysia 4.0 – 6.3 29.2 7.7 Italy 4.0 4.9 17.5 100.0 Syria 4.1 22.6 50.1 90.6 Egypt 4.3 43.7 43.2 93.9 Portugal 4.5 25.5 29.3 100.0 Greece 4.6 38.9 26.3 100.0 Brazil 4.6 – 8.2 29.2 51.5 Gabon 5.2 – 31.2 31.7 0 Malta 5.4 32.8 37.9 100.0 Korea, Republic of 5.6 2.3 30.8 84.4 Hong Kong 6.1 –.7 41.9 72.7 Japan 6.1 –9.8 31.6 39.4 Singapore 6.6 8.3 30.5 100.0 Average 4.3 – 9.0 31.7 72.8 FEDERAL RESERVE BANK OF DALLAS 17
- 67. ECONOMIC REVIEW FOURTH QUARTER 1996 exchange rate premia, in economic growth.11 We include a measure of capital controls in the benchmark equation to account for any negative growth effects due to the lack of capital mobility across nations. Specifically, we do not want to confuse the effects of low capital mobility with the effects of a low trade imbalance. Low capital mobility impedes the development of trade im- balances and is likely to be related to low rates of economic growth. As model 2 shows, exchange controls de- crease economic growth and the coefficient is statistically significant and economically impor- tant. Holding all else constant, the size of the coefficient suggests that a black market pre- mium of 50 percent, for example, would de- crease a country’s average growth rate in the range of 0.20 to 0.25 percentage points per year. The effects of trade balances. Can trade balances explain any variation in economic growth once capital controls and the standard determinants of growth are held constant? Before we examine this question, we first pre- sent some simple descriptive statistics on the relationship between trade balances and eco- nomic growth. Table 3 summarizes the countries in the data set and shows their average yearly growth rate, the trade deficit as a share of total trade, the share of total years in deficit, and a measure of
- 68. bilateral trade imbalances as a share of total trade. The trade deficit as a share of total trade is imports minus exports divided by total trade (imports plus exports); the share of total years in deficit is the number of years a country has had a trade deficit over the 1960 –89 period divided by the number of years in the period (30); bilateral trade imbalances are measured by sum- ming a country’s bilateral trade deficits and sur- pluses and dividing by that country’s total trade and adjusting for overall surpluses and deficits.12 In other words, our measure of bilateral imbal- ances represents the percentage of a country’s trade that is bilaterally imbalanced (after adjust- ments for total imbalances). The countries in Table 3 are grouped ac- cording to growth rates; the slowest 25 percent of countries are in the upper left and the fastest 25 percent of countries are in the lower right. Without controlling for the important determi- nants of growth, there appears to be a weak positive correlation between economic growth and the percentage of years in deficit. The fast- est growing countries seem to have more years in deficit than the slower growing countries, although those countries in the middle growth range are not distinguishable as having a higher or lower share of years in deficit. There is a nega- tive correlation between bilateral imbalances and economic growth. This correlation is stron- ger than the previous one. The greater the bilat- eral imbalance, the lower the growth; there is no ambiguity in the middle growth categories. The
- 69. overall trade deficit as a share of total trade also appears to be negatively related to growth, although it is not a strong relationship. A priori, it is difficult to see any strong relationship between measures of overall or bilateral trade imbalances and economic growth. However, the other factors determining growth should be taken into account before any conclusions can be properly made. Equation 3 in Table 2 adds the share of years a country’s trade account is in deficit to the benchmark model. As the results indicate, the variable is positively related to economic growth, but it is not statistically significant at the standard 5-percent level. However, taking the point estimate seriously, the size of the coefficient suggests that its economic effects are only moderate. For example, the United States, with 69.7 percent of its years in deficit, would experience an increase in its growth rate of about 0.5 percentage points per year. The weakness of the relationship between trade balances and economic growth is shown by an alternative measure of trade deficit: trade deficit as a share of total trade, shown in equa- tion 4 of Table 2. In this case, the coefficient is negative but is extremely small and statistically insignificant. Taking the point estimate seriously, a trade deficit that is 12 percent of total trade, which is what the United States had over the period 1960 –89, would only decrease average yearly per capita real GDP growth by about 0.05 percentage points.
- 70. Equation 5 includes bilateral imbalances as a share of trade. As the results indicate, the coefficient on this variable is negative, but, with a t value less than 1, it is not statistically signifi- cant. Thus, empirical evidence is consistent with the hypothesis that bilateral trade imbalances have no particular impact on economic growth. Conclusion In this study, we have examined, both theoretically and empirically, the relationship between trade balances and long-run economic growth. We find that trade imbalances have little effect on rates of economic growth once we account for the fundamental determinants of economic growth. For the most part, trade deficits or sur- pluses are merely a reflection of a country’s 18 international borrowing or lending profile over time. Just as companies borrow to finance in- vestment and purchases, so do countries. A country can have a perpetual trade deficit or surplus simply because income payments from investments allow it to finance the country’s desired flow of goods. Far too often, the com- mon wisdom is that large trade deficits signal a fundamentally weak economy, when the em- pirical evidence suggests that there is no long- run relationship between the two. Trade deficits
- 71. and surpluses are part of the efficient allocation of economic resources and international risk- sharing that is critical to the long-run health of the world economy. Neither one, by itself, is a better indicator of long-run economic growth than the other. Notes 1 Thomas Mun (1664) pointed out that “Our yearly con- sumption of foreign wares to be for the value of twenty thousand pounds, and our exportations to exceed that two hundred thousand pounds, which sum wee have therupon affirmed is brought to us in treasure to ballance the accompt ” [emphasis added]. Interna- tional lending must have been relatively small in the seventeenth century. 2 In the eighteenth century, precious metals were referred to as “specie.” 3 In modern times, currency boards, such as those found in Hong Kong and Argentina, use the U.S. dollar to back their currency, and many other fixed- exchange-rate regimes peg the value of their curren- cies to the U.S. dollar. 4 See Schumpeter (1954, 344– 45 and 356 – 57) for an excellent discussion of mercantilistic thought. 5 For an example of this type of analysis, see Duchin and
- 72. Lange (1988). They argue that eliminating the trade deficit in 1987 would have increased employment by 5.1 million jobs. This figure represented an increase of about 5 percent in total employment from a trade deficit that represented only about 3 percent of GDP. 6 See, for example, Krueger (1978); Bhagwati (1978); World Bank (1987); De Long and Summers (1991); Michaely, Papageorgiou, and Choksi (1991); Edwards (1992); Roubini and Sala-i-Martin (1992); and Gould and Ruffin (1995). 7 See, for example, Kormendi and Meguire (1985); Barro (1991); Romer (1990); Levine and Renelt (1992); Edwards (1992); Roubini and Sala-i-Martin (1992); Backus, Kehoe, and Kehoe (1992); and Mankiw, Romer, and Weil (1992). These empirical studies typically rely on a closed-economy version of the neoclassical Solow growth model. The closed- economy model would seem inappropriate in a world where capital is internationally mobile. However, an
- 73. implication of the open-economy neoclassical model is that countries should experience rapid income con- vergence because capital can move quickly across borders and does not have to be slowly accumulated at home. But fast income convergence is not borne out by cross-country empirical evidence. Barro, Mankiw, and Sala-i-Martin (1995) find that the transition to the long run in an open-economy neoclassical model may not be instantaneous if there are some impediments to the flow of capital across countries. Impediments to the flow of capital are likely, especially when considering the flow of human capital across nations. 8 The benchmark model utilizes a log-linear formulation for two reasons: it has a basis in Cobb – Douglas pro- duction technologies (such as Backus, Kehoe, and Kehoe 1992 and Mankiw, Romer, and Weil 1992), and this model is superior to a simple linear formulation in
- 74. minimizing the mean squared error. 9 Least squares estimates are used because they are less sensitive to the end points of the growth period. 10 Although regressing average growth rates against initial income levels suggests income convergence, it does not necessarily provide statistical evidence of convergence. Quah (1990) and Friedman (1992) note that, because of regression to the mean, a negative relationship between average growth rate and initial income does not necessarily provide statistical evidence of convergence. 11 The black market exchange rate premium is the percentage by which the official exchange rate deviates from the market exchange rate and is often a good proxy for the degree to which countries attempt to control international capital flows. 12 The formula for the bilateral trade imbalance of country i is BIM X M X M X X
- 75. M X i ij ij j n i i ij ij i i = − + = ∗ = ∑ * *, , 1 where X i is total exports of country i, M i is total imports of country i, X
- 76. ij is exports of country i to country j, and M ij is imports to country i from country j. References Backus, David K., Patrick J. Kehoe, and Timothy J. Kehoe (1992), “In Search of Scale Effects in Trade and Growth,” Journal of Economic Theory 58 (December): 377– 409. Barro, Robert J. (1991), “Economic Growth in a Cross Section of Countries,” Quarterly Journal of Economics 106 (May): 407– 43. ———, N. Gregory Mankiw, and Xavier Sala-i-Martin (1995), “Capital Mobility in Neoclassical Models of Growth,” American Economic Review 85 (March): 103 –15. Bhagwati, Jagdish (1978), Anatomy and Consequences of Exchange Control Regimes (Cambridge, Mass.: Ballinger Publishing Co.). FEDERAL RESERVE BANK OF DALLAS 19 ECONOMIC REVIEW FOURTH QUARTER 1996 Cairnes, John E. (1874), Some Leading Principles of
- 77. Political Economy Newly Expanded (New York: Macmillan and Co.). De Long, J. Bradford, and Lawrence H. Summers (1991), “Equipment Investment and Economic Growth,” Quarterly Journal of Economics 106 (May): 445 – 502. Dollar, David (1992), “Outward-Oriented Developing Economies Really Do Grow More Rapidly: Evidence from 95 LDCs, 1976 –1985,” Economic Development and Cultural Change 40 (April): 523 – 44. Duchin, Faye, and Glenn-Marie Lange (1988), “Trading Away Jobs: The Effects of the U.S. Merchandise Trade Deficit on Employment,” Economic Policy Institute, Washington, D.C., October. Edwards, Sebastian (1992), “Trade Orientation, Distor- tions, and Growth in Developing Countries,” Journal of Development Economics 39 (July): 31– 57. Friedman, Milton (1992), “Do Old Fallacies Ever Die?” Journal of Economic Literature 30 (December): 129 – 32. Gould, David M., and Roy J. Ruffin (1995), “Human Capital, Trade and Economic Growth,” Weltwirtschaftliches Archiv 131 (3): 425 – 45.
- 78. ———, ———, and Graeme L. Woodbridge (1993), “The Theory and Practice of Free Trade,” Federal Reserve Bank of Dallas Economic Review, Fourth Quarter, 1–16. Kormendi, Roger, and Philip Meguire (1985), “Macroeco- nomic Determinants of Growth: Cross-Country Evidence,” Journal of Monetary Economics 16 (September): 141– 63. Krueger, Anne (1978), Foreign Trade Regimes and Eco- nomic Development: Liberalization Attempts and Conse- quences (Cambridge, Mass.: Ballinger Publishing Co.). Levine, Ross, and David Renelt (1992), “A Sensitivity Analysis of Cross-Country Growth Regressions,” Ameri- can Economic Review 82 (September): 942– 63. Malynes, Gerard de (1601), A Treatise of the Canker of England’s Commonwealth. Mankiw, N. Gregory, David Romer, and David N. Weil (1992), “A Contribution to the Empirics of Economic Growth,” Quarterly Journal of Economics 107 (May): 407– 37. Michaely, M., D. Papageorgiou, and A. Choksi, eds. (1991), Liberalizing Foreign Trade: Lessons of Experi- ence in the Developing World, vol. 7 (Cambridge, Mass.:
- 79. Basil Blackwell). Mun, Thomas (1664), England’s Treasure by Foreign Trade: Or, the Balance of Our Foreign Trade Is the Rule of Our Treasure. Phelps, Edmund S. (1966), Golden Rules of Economic Growth (New York: Norton). Quah, Danny (1990), “Galton’s Fallacy and Tests of the Convergence Hypothesis” (Massachusetts Institute of Technology), photocopy. Romer, Paul M. (1990), “Human Capital and Growth: Theory and Evidence,” Carnegie –Rochester Conference Series on Public Policy 32: 251– 85. Roubini, Nouriel, and Xavier Sala-i-Martin (1992), “Finan- cial Repression and Economic Growth,” Journal of Development Economics 39 (July): 5 – 30. Ruffin, Roy J. (1979), “Growth and the Long-Run Theory of International Capital Movements,” American Economic Review 69 (December): 832– 42. Schumpeter, Joseph A. (1954), History of Economic Analysis (New York: Oxford University Press). Solow, Robert (1956), “A Contribution to the Theory of Economic Growth,” Quarterly Journal of Economics 70
- 80. (February): 65 – 94. Summers, Robert, and Alan Heston (1991), “The Penn World Table (Mark 5): An Expanded Set of International Comparisons, 1950–1988,” Quarterly Review of Eco- nomics 106 (May): 327– 68. World Bank (1987), World Development Report 1987 (New York: Oxford University Press). 20 Appendix A Simple Dynamic Model of Growth, the Balance of Trade, And International Capital Movements It is not obvious that a long-term creditor country must have a trade deficit, or that a long- term debtor country must have a trade surplus. In other words, why should it be that net investment income necessarily exceeds net capital outflows for a long-term creditor country, or that net debt payments must necessarily exceed net capital inflows for a long-term debtor country? To demon- strate this claim, we consider a world consisting of two countries —home and foreign. For the sake of simplicity, both countries produce a single, identi- cal good that can be either consumed or used as capital.1 Moreover, to keep the notation simple, we assume both countries have the same population and that there is no depreciation of capital (capital
- 81. lasts forever or is used up in consumption). To keep one country from overrunning the other, we suppose the labor forces grow at the same rate. Finally, we suppose that the single good is pro- duced under constant returns to scale by only two factors, labor and capital. Let k and k * denote the owned capital per unit of labor in the home and foreign countries, respectively. Capital movements take place by the home country’s borrowing B units of capital from the foreign country, so the capital per unit labor located in the home country is k + b, where b = B /L, while the capital per unit labor located in the foreign country is k * – b. If capital is freely mobile, the equilibrium per capita stock of foreign investment, b, is determined by equating the marginal products of capital in both countries — that is, (A.1) f ′(k + b) = g ′ (k * – b) = r, where f and g denote the per capita production functions in the home and foreign countries, respectively, and f ′ and g′ denote the derivatives or the marginal products of capital. Let s and s * denote the constant saving rates in the home and foreign countries, and let n denote the rate of growth of the labor force in both countries. Per capita incomes are f (k + b) – rb in the home country and g (k * – b) + rb in the foreign country. According to the Solow growth model (Solow 1956), the countries will be in steady-state when savings equal required investment:
- 82. (A.2) s[f (k + b) – rb] – nk = 0, and (A.3) s *[g (k * – b) + r b ] + nk * = 0. Solving equations A.1– A.3 yields steady-state values of k, k *, and b.2 Thus, in the long run, db /dt = 0. In the short run, db /dt may be nonzero. Let us look at the short-run and long-run dynamics of the balance of payments as envisioned by Cairnes (1874). Since b = B /L, the rate of change in the per capita stock of foreign investment is (A.4) db /dt = (dB /dt )/L – nb, where n = (dL /dt )/L and (dB /dt )/L is the per capita inflow of capital to the home country from the foreign country. Equation A.3 may be used to describe the determinants of the per capita trade balance. By definition, the per capita trade surplus, x – m (exports minus imports), will be per capita foreign debt service, rb, where r is the rate of interest [r = f ′ (k + b) ] – per capita capital inflows. In other words, (A.5) x – m = rb – (dB /dt )/L. Combining equations A.4 and A.5 results in (A.6) x – m = (r – n)b – db /dt. This is our key equation. The home country’s per capita trade balance equals (r – n)b minus the
- 83. change in its per capita net indebtedness. In the steady-state, db /dt = 0, the per capita trade sur- plus (x – m ) = (r – n)b. Assuming r > n, if the home country is a net debtor, b > 0, there will be a sur- plus. In contrast, if b < 0, the country will have a long-run deficit. Cairnes claimed that the net creditor’s long-run trade balance would be nega- tive, implying that r > n in the long run. Remark- ably, the condition that r > n is the condition for dynamic economic efficiency (Phelps 1966). In the above model, the long-run growth rate is simply equal to the population growth rate. This follows because in the steady-state, b, k, and k * are constant; accordingly, per capita income remains constant. If we reinterpreted the model in terms of the effective labor supply and labor- augmenting technological progress, per capita income would increase by the rate of technological progress. Whatever interpretation is made, the model is then so constructed that both countries grow at exactly the same rate. A key conclusion from this analysis is that in the long run, there should be no link between economic growth and the trade balance. The long- run trade balance is determined by the net creditor or debtor status of the country, while the long-run growth rate is determined by the growth rate of the population and technological progress. 1 This model is based on Ruffin (1979). 2 Ruffin (1979) demonstrates the conditions under which the above model has a unique solution.