Cows in the cloud, Down to earth, 8-9 September 2015
•Download as PPTX, PDF•
1 like•593 views

Farming involves entrepreneurship, setting milestones and preparing for the future. In addition, farming is continuously subject to change, due to growth, society, regulations, finance, subsidy, etc. Therefore solid advice is key for a sustainable, profitable and enjoyable future in farming. A variety of speakers from different disciplines will share interesting insights and knowledge to help you in supporting farmers to reach their chosen milestones.

Recommended
Recommended
More Related Content
What's hot
What's hot (8)
Similar to Cows in the cloud, Down to earth, 8-9 September 2015
Similar to Cows in the cloud, Down to earth, 8-9 September 2015 (20)
Recently uploaded
Recently uploaded (20)
Cows in the cloud, Down to earth, 8-9 September 2015
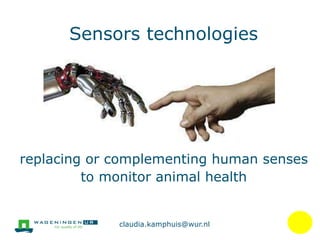
- 1. Sensors technologies replacing or complementing human senses to monitor animal health claudia.kamphuis@wur.nl
- 2. What can you expect Claudia Kamphuis Sensor technologies in dairy Theory and Economic potential vs. reality Performance of sensor technologies Working with sensor technologies Current work
- 3. 3
- 4. 2004: Graduated, Preventive Animal Heath and Welfare, Wageningen University 2006: PhD, Utrecht University 2010: Defended successfully PhD, Utrecht University 2011: Scientist role at DairyNZ, New Zealand 2013: Post-Doc, Business Economics Wageningen University
- 5. What can you expect Claudia Kamphuis Sensor technologies in dairy
- 6. Boosted by development of automatic milking systems in 1990s
- 7. 6 main brands Boosted by development of automatic milking systems in 1990s
- 8. 6 main brands 1992 first farm in NL (Bottema, 1992) >10,000 farms globally 2013 (Rodenburg, 2013) 3,615 (19.5%) Dutch farms (Stichting KOM, 2015) Forced to replace human senses Boosted by development of automatic milking systems in 1990s
- 9. And further pushed by increased animal welfare concerns Increasing herds Government Society
- 10. Cheap technology Low in maintenance costs Udder or quarter level Most used to detect abnormal milk or mastitis Limited performance for mastitis detection (Rutten et al., 2013) Electrical Conductivity handheldIn-line
- 11. Other (more sophisticated and expensive) sensor technologies were introduced to monitor cow health and productivity Udder Health - Electrical Conductivity - Milk yield - Somatic Cell Count - (Milk) Temperature - Colour
- 12. Other (more sophisticated and expensive) sensor technologies were introduced to monitor cow health and productivity Udder Health - Electrical Conductivity - Milk yield - Somatic Cell Count - (Milk) Temperature - Colour Milk Composition - Milk yield - Fat and protein content - Lactose content - Somatic cell count
- 13. Other (more sophisticated and expensive) sensor technologies were introduced to monitor cow health and productivity Fertility - Progesterone - Activity - Rumination Cow ‘Composition’ - Weight - Body Condition Score
- 14. Other (more sophisticated and expensive) sensor technologies were introduced to monitor cow health and productivity Metabolic disorders - Activity - Rumination - Milk yield - SCC - pH Cow Mobility - Weight - Activity - Rumination - Milk yield
- 15. There are A LOT of sensor technologies 15
- 16. With A LOT of benefits Improve health, welfare Increase productivity Increase efficiency Improve product quality Objective monitoring Improve social lifestyle
- 17. Use of sensor technologies in the Netherlands (Steeneveld and Hogeveen, 2015) Survey study 1,672 farmers approached via email 512 farmers replied (31%) 202 farmers (41%) replied to have sensor technologies 17
- 18. When did CMS farmers invest in sensors (n = 81) (Steeneveld and Hogeveen, 2015) 0 5 10 15 20 25 30 35 40 2004 2005 2006 2007 2008 2009 2010 2011 2012 2013 Mastitis Rumination Estrus Year Farmers(n)
- 19. When did AMS farmers invest in sensors (n = 121) (Steeneveld and Hogeveen, 2015) 0 5 10 15 20 25 30 35 2004 2005 2006 2007 2008 2009 2010 2011 2012 2013 Mastitis Rumination Estrus Year Farmers(n)
- 20. Use of sensor technologies (%) in the Netherlands (Steeneveld and Hogeveen, 2015) 20 Sensor AMS (n = 121) CMS (n = 81) Colour 60 1 Electrical Conductivity 93 35 Milk temperature 50 6 Weighing platform 27 5 Fat and protein 20 0 Somatic cell count 17 1 Activity meters/pedometers dairy cows 41 70 Activity meters/pedometers young stock 12 28 Temperature 6 14 Rumination 9 12 Lactate dehydrogenase (LDH) 2 1 Progesterone 2 1
- 21. What can you expect Claudia Kamphuis Sensor technologies in dairy Theory and Economic potential vs. reality
- 22. Reasons why AMS farmers invested in sensors (Steeneveld and Hogeveen, 2015) 22 Investment reason EC (n = 112) Rumination (n = 11) Activity (n = 50) Reduce labor 1 9 6 Improve health / reproduction 14 55 72 Insight in health 14 82 42 Not a conscious decision 97 54 48 Improve farm profitability 13 45 48
- 23. Automated mastitis detection: theory Not a conscious decision (we have to?) Managing bulk milk SCC levels Mastitis detection Dry-cow therapy decisions 23
- 24. Automated mastitis detection: economics 24
- 25. Automated mastitis detection: reality (Steeneveld et al., 2015) Farms AMS farms CMS farms No sensors Before sensors After sensors Before sensors After sensors Number of cows % growth in size Milk production (kg / cow / year) 86 3.5 8,343 82 2.6 8,398 97 4.2 8,558 127 6.0 8,371 159 9.7 8,179
- 26. 190 195 200 205 210 215 220 225 230 235 240 No sensor system AMS farms before investment AMS farms after investment CMS farms before investment CMS farms after investment Somaticcellcount(x1,000cells/ml)Automated mastitis detection: reality (Steeneveld et al., 2015)
- 27. Automated oestrus detection: theory Advantages two-fold Improve farm profitability Better detection rates -> improved pregnancy rates
- 28. Automated oestrus detection: theory Advantages twofold Improve farm profitability Better detection rates -> improved pregnancy rates Clear management (decision support) associated with information
- 29. Automated oestrus detection: theory Advantages twofold Improve farm profitability Better detection rates -> improved pregnancy rates Clear management (decision support) associated with information OK performance: 80% SN with 95% SP (Rutten et al., 2013)
- 30. Automated oestrus detection: theory Advantages twofold Improve farm profitability Better detection rates -> improved pregnancy rates Clear management (decision support) associated with information OK performance Investment is economically beneficial (Rutten et al., 2014)
- 31. Automated oestrus detection: economics
- 32. General culling Calving Ovulation Heat detection P(1st ovulation) P(heat) P(heat detected) P(culling) P(culling) P(culling) Simulated cow Parity, production level Insemination after voluntary waiting period Culling due to fertility issues - Max 6 inseminations - Not pregnant in wk 35 Replacement heifer Cow pregnant P(pregnant) P(early embryonic death) Next parity ∆ Milk yield ∆ Number of inseminations ∆ Number of calves produced ∆ Feed intake ∆ Number of culled cows ∆ Number of false alerts from PLF Output cow place /year Milk price Labour costs Cost for AI Costs/revenues of calves Costs feed Costs for culling Costs of false alerts PLF (labour or AI) x € At farm level Probabilities are adjusted for each simulated week Costs of PLF technology: investment, maintenance, depreciation, replacement of faulty sensors Cow Model SN 50% SP 100% SN 80% SP 95% €108/cow €3600/herd 10years Checking each alert visually
- 33. Automated oestrus detection: economics Cash flow: 2,287 € / year Cost-Benefit ratio: € 1.23 Discounted payback period: 8 years Investment pays off (Rutten et al., 2014) SN 80%;SP 95% € 108/cow € 3600/herd 10years Checking each alert visually
- 34. Automated oestrus detection: reality (Steeneveld et al., 2015) Farms AMS farms CMS farms No sensors Before sensors After sensors Before sensors After sensors Number of cows % growth in size Milk production (kg/cow/year) 85 3.5 8,342 86 2.8 8,473 102 5.3 8,632 104 4.0 8,245 131 6.1 8,177
- 35. Automated oestrus detection: reality (Steeneveld et al., 2015) 70 80 90 100 110 120 130 No sensor system AMS farms before investment AMS farms after investment CMS farms before investment CMS farms after investment Daystofirstservice
- 36. Investment in sensor technologies: reality (€/100 kg milk) (Steeneveld et al., unpublished) No sensor AMS CMS Before After Before After Capital costs 10.38 9.72a 13.97b 11.08c 11.35c Labour costs 12.38 11.69a 11.30a 11.30c 10.43c Variable costs 1945 18.66a 19.80a 18.28c 19.24c Revenues 46.28 43.93a 46.38b 45.77c 47.18c Profit 4.07 3.86a 1.31b 5.11c 6.16c
- 37. So, just a mid re-cap 1,672 farms approached 512 farmers replied 202 indicated to have sensors (Steeneveld and Hogeveen, 2015) Economic theory is not matching reality 12%
- 38. What can you expect Claudia Kamphuis Sensor technologies in dairy Theory and Economic potential vs. reality Performance of sensor technologies
- 39. Sensors are state-of-the-art pieces of technology that develop and improve rapidly
- 40. Sensors are state-of-the-art pieces of technology that develop and improve rapidly
- 41. It’s all about monitoring parameters associated with events of interest, but sensors May not accurately or precisely monitor these parameters
- 42. It’s all about monitoring parameters associated with events of interest, but sensors May not accurately monitor these parameters Monitor a proxy for these parameters viscosity measurements; Whyte et al., 2004
- 43. It’s all about monitoring parameters associated with events of interest, but sensors May not accurately monitor these parameters Monitor a proxy for these parameters Monitor parameters that are not unique for the event
- 44. It’s all about monitoring parameters associated with events of interest, but sensors May not accurately monitor these parameters Monitor a proxy for these parameters Monitor parameters that are not unique for the event Monitor one single aspect of a complex event
- 45. Always a trade-of between Sensitivity How many events do you detect (true positive alerts) and how many do you miss (false negative alerts) Specificity How many healthy cows do not receive an alert (true negative alert) and how many do receive an alert falsely (false positive alert)
- 46. Trade-off dependants Event being monitored Dairying system in which sensor is implemented Economic consequences of decision-making based on inaccurate sensor information Farmer’s preference (risk attitude)
- 47. Example automated mastitis detection High SN no additional labour for checking alerts Checking a few false positives is always better than checking 2,000 cows High SP nuisance of fetching cows and checking alerts Willing to accept mildly infected cows remain undetected (Mollenhorst et al., 2012; Hogeveen and Steeneveld, 2013)
- 48. Example of automated oestrus detection Field evaluation of SCR systems in New Zealand: 75% SN and 99%SP Visual observation using tail paint: 91% SN and 99.8% SP 48
- 49. Example automated oestrus detection with 75% sensitivity Year-round calving might be OK But what about seasonal calving? 6wks time to get all cows pregnant Economic losses in case oestrus events are missed
- 50. Farmers’ attitude Being in control Letting-go Convenience seekersBusiness optimisers
- 51. Farmers’ attitude Eager to understand and learn the system Not having the time or skills Innovators/ambassadors Convenience seekers /business optimisers
- 52. Sensors are not about ‘one size fits all’ Waiting for ‘improved’ systems (Borchers and Bewley, 2015; Steeneveld and Hogeveen, 2015; Russell and Bewley, 2013) 52
- 53. What can you expect Claudia Kamphuis Sensor technologies in dairy Theory and Economic potential vs. reality Performance of sensor technologies Working with sensor technologies
- 54. Reasons why AMS farmers invested in sensors (Steeneveld and Hogeveen, 2015) 54 Investment reason EC (n = 112) Rumination (n = 11) Activity (n = 50) Reduce labor 1 9 6 Improve health / reproduction 14 55 72 Insight in health 14 82 42 Not a conscious decision 97 54 48 Improve farm profitability 13 45 48
- 55. Use of sensor information is limited Sensor AMS (%) CMS (%) Never/ sometimes Daily Never/ sometimes Daily Colour (n=72 / 1) 49 32 100 0 Fat and protein sensor (n = 24) 63 17 Electrical conductivity (n = 112 / 28) 5 77 25 21 Weighing platform (n = 33 / 4) 39 21 25 50 Activity meters/pedometers dairy cows (n = 50 / 57) 6 74 6 74
- 56. Use of sensor information is limited (Hogeveen et al., 2013) 5% of generated mastitis alerts are visually checked
- 57. Use of sensor information is limited (Hogeveen et al., 2013) 5% of generated mastitis alert lists are visually checked Reasons not to check alerts included: No deviation in yield (19%)No flakes on filter (28%) Repeatedly on list (10%) Too busy (10%)Malfunctioning (4%) No EC increase (5%)
- 58. Use of sensor information is limited (Hogeveen et al., 2013) 5% of generated mastitis alert lists are visually checked Reasons not to check alerts Consequence: 75% of detected mastitis is not ‘seen’
- 59. 190 195 200 205 210 215 220 225 230 235 240 No sensor system AMS farms before investment AMS farms after investment CMS farms before investment CMS farms after investment Somaticcellcount(x1,000cells/ml)Automated mastitis detection: reality (Steeneveld et al., 2015)
- 60. Use of sensor information is limited 22% of farm owners indicated that expectations did not match performance reality 24% of farm owners indicated that learning support was not as expected (Eastwood et al., 2015)
- 61. Too much information without knowing what to do with it (Russell and Bewley, 2013) 61
- 62. What can you expect Claudia Kamphuis Sensor technologies in dairy Theory and Economic potential vs. reality Performance of sensor technologies Working with sensor technologies Current work
- 63. 63 The cow central Farmer rules Real time models of different parties Sensors of different companies Other data sources InfoBroker: Open platform for sensor data Work instructions What’s currently being done?
- 64. What’s currently being done? Develop a blueprint for successful PLF technologies Social impact Economic viability
- 65. What’s currently being done? Tools to estimate economic and social value Value Creation Tool potential economic benefits of sensor technology in different dairying situations Break-even Tool how much change of a parameter is required to break-even with the investment Adaptive Conjoint Analysis assessing utilities of costumers for economic or social aspects
- 66. What can you expect What I would like you to remember
- 67. Sensors are exciting, high-tech and have potential But we need their information combined with To complement management decisions on animal health
- 68. Thank you for your attention www.slideshare.net/claudiakamphuis ckamphuis