More Related Content
More from Honolulu Civil Beat
More from Honolulu Civil Beat (20)
Tze cor charts may 2010
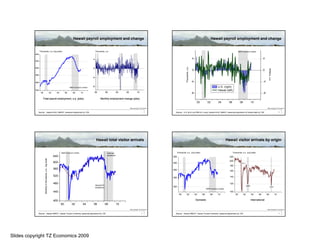
- 1. Hawaii payroll employment and change Hawaii payroll employment and change
Thousands, s.a. (log scale) Thousands, s.a. NBER recessions shaded
640
4 4 .4
620
Thousands, s.a.
600 0
Millions, s.a.
0 .0
580
-4
560 -4 -.4
NBER recessions shaded -8 U.S. (right)
540 Hawaii (left)
00 02 04 06 08 10 90 95 00 05 10 -8 -.8
Total payroll employment, s.a. (jobs)
s.a. Monthly employment change (jobs)
00 02 04 06 08 10
Slide copyright TZ Economics Slide copyright TZ Economics
Source: Hawaii DLIR, DBEDT; seasonal adjustment by TZE 1 Source: U.S. BLS (via FRB St. Louis), Hawaii DLIR, DBEDT; seasonal adjustment of Hawaii data by TZE 2
Hawaii total visitor arrivals Hawaii visitor arrivals by origin
NBER recessions shaded Lehman Thousands, s.a., (log scale) Thousands, s.a., (log scale)
640 shutdown
500 220
Monthly in thousands, s.a., log scale
200
600 450 9/11
180
560 400 160
520 140
350
480 120
Aloha/ATA SARS
shutdowns 300 H1N1
NBER recessions shaded
440 100
00 02 04 06 08 10 00 02 04 06 08 10
400 Domestic International
00 02 04 06 08 10
Slide copyright TZ Economics Slide copyright TZ Economics
Source: Hawaii DBEDT, Hawaii Tourism Authority; seasonal adjustment by TZE 3 Source: Hawaii DBEDT, Hawaii Tourism Authority; seasonal adjustment by TZE 4
Slides copyright TZ Economics 2009
- 2. Hawaii real private building permit values Hawaii real private building permit values
800
Million 2009$, s.a., (log scale) Million 2009%, s.a., (log scale)
320 320
Million 2009$, s.a., (log scale)
400
160 160
80 80
200
40 40
NBER recessions shaded
20 20 100
90 92 94 96 98 00 02 04 06 08 10 90 92 94 96 98 00 02 04 06 08 10
NBER recessions shaded
New residential Nonresidential incl. additions/alterations
90 92 94 96 98 00 02 04 06 08 10
Slide copyright TZ Economics Slide copyright TZ Economics
Source: Hawaii DBEDT, U.S. Bureau of the Census; deflation using Census cost index, seasonal adjustment by TZE 5 Source: Hawaii DBEDT, U.S. Bureau of the Census; deflation using Census cost index, seasonal adjustment by TZE 6
Hawaii real contracting (through 2009) Hawaii real retail sales (through 2009)
8
2.8
Monthly, billion 2009$, s.a., (log scale)
Monthly, billion 2009$, s.a., (log scale)
2.4
4
2.0
2 1.6
NBER recessions shaded NBER recessions shaded
80 85 90 95 00 05 10 90 92 94 96 98 00 02 04 06 08 10
Slide copyright TZ Economics Slide copyright TZ Economics
Source: Hawaii DoTax, U.S. Bureau of the Census; deflation using Census cost index, seasonal adjustment by TZE 7 Source: Hawaii DoTax, U.S. BLS; deflation using U.S. CPI-U, seasonal adjustment by TZE 8
Slides copyright TZ Economics 2009