Morning tea 10 03-2017
•
0 likes•36 views

The document provides a daily market summary and analysis for March 10th, 2017. It discusses the performance of world markets including the US, Asia, and India. It also provides technical analysis recommendations to buy two Indian stocks (PIIND and ITDCEM) based on chart patterns and indicators. In addition, it lists upcoming corporate actions and results calendars.

Recommended
More Related Content
What's hot
What's hot (20)
Viewers also liked
Viewers also liked (15)
Similar to Morning tea 10 03-2017
Similar to Morning tea 10 03-2017 (20)
Recently uploaded
Recently uploaded (20)
Morning tea 10 03-2017
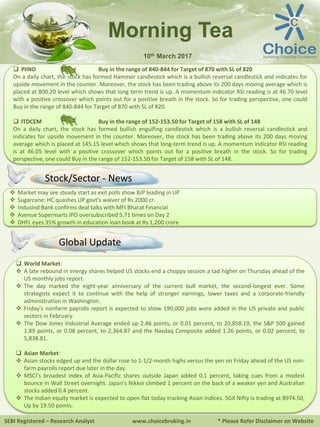
- 1. SEBI Registered – Research Analyst www.choicebroking.in * Please Refer Disclaimer on Website Morning Tea 10th March 2017 World Market: A late rebound in energy shares helped US stocks end a choppy session a tad higher on Thursday ahead of the US monthly jobs report. The day marked the eight-year anniversary of the current bull market, the second-longest ever. Some strategists expect it to continue with the help of stronger earnings, lower taxes and a corporate-friendly administration in Washington. Friday's nonfarm payrolls report is expected to show 190,000 jobs were added in the US private and public sectors in February. The Dow Jones Industrial Average ended up 2.46 points, or 0.01 percent, to 20,858.19, the S&P 500 gained 1.89 points, or 0.08 percent, to 2,364.87 and the Nasdaq Composite added 1.26 points, or 0.02 percent, to 5,838.81. Asian Market: Asian stocks edged up and the dollar rose to 1-1/2-month highs versus the yen on Friday ahead of the US non- farm payrolls report due later in the day. MSCI's broadest index of Asia-Pacific shares outside Japan added 0.1 percent, taking cues from a modest bounce in Wall Street overnight. Japan's Nikkei climbed 1 percent on the back of a weaker yen and Australian stocks added 0.4 percent. The Indian equity market is expected to open flat today tracking Asian indices. SGX Nifty is trading at 8974.50, Up by 19.50 points. Market may see steady start as exit polls show BJP leading in UP Sugarcane: HC quashes UP govt's waiver of Rs 2000 cr. IndusInd Bank confirms deal talks with MFI Bharat Financial Avenue Supermarts IPO oversubscribed 5.71 times on Day 2 DHFL eyes 35% growth in education loan book at Rs 1,200 crore PIIND Buy in the range of 840-844 for Target of 870 with SL of 820 On a daily chart, the stock has formed Hammer candlestick which is a bullish reversal candlestick and indicates for upside movement in the counter. Moreover, the stock has been trading above its 200 days moving average which is placed at 800.20 level which shows that long term trend is up. A momentum indicator RSI reading is at 46.70 level with a positive crossover which points out for a positive breath in the stock. So for trading perspective, one could Buy in the range of 840-844 for Target of 870 with SL of 820. ITDCEM Buy in the range of 152-153.50 for Target of 158 with SL of 148 On a daily chart, the stock has formed bullish engulfing candlestick which is a bullish reversal candlestick and indicates for upside movement in the counter. Moreover, the stock has been trading above its 200 days moving average which is placed at 145.15 level which shows that long-term trend is up. A momentum indicator RSI reading is at 46.05 level with a positive crossover which points out for a positive breath in the stock. So for trading perspective, one could Buy in the range of 152-153.50 for Target of 158 with SL of 148. Stock/Sector - News Global Update
- 2. CMI Limited; Extraordinary General Meeting Result Calendar: SUNTV SEBI Registered – Research Analyst www.choicebroking.in * Please Refer Disclaimer on Website Morning Tea 10th March 2017 Corporate Action / Result Calendar JETAIRWAYS, JPASSOCIAT & RCOM Security in Ban Bulk Deal Deal Date Security Code Security Name Client Name Deal Type Quantity Price 9/3/2017 500325 RELIANCE DEVARSHI COMMERCIALS LLP B 355,400,105 1284.13 9/3/2017 500325 RELIANCE ABHAYAPRADA ENTERPRISES LLP S 124,514,068 1284.62 9/3/2017 500325 RELIANCE TRILOKESH COMMERCIALS LLP S 124,513,068 1283.63 9/3/2017 500325 RELIANCE TARAN ENTERPRISES LLP S 106,372,969 1284.12 9/3/2017 500325 RELIANCE ADISESH ENTERPRISES LLP S 40,685,783 1283.25 9/3/2017 500325 RELIANCE TATTVAMENTERPRISES LLP B 40,685,783 1283.25 8/3/2017 532843 FORTIS AMANSA HOLDINGS PRIVATE LIMITED B 2,597,604 178.5 9/3/2017 539725 GOKULAGRO ELEGANT CAPITALS PRIVATE LIMITED S 2,133,888 33 9/3/2017 539725 GOKULAGRO RATHI GLOBAL B 2,133,888 33 9/3/2017 532323 SHIVACEM BINITA GADODIA S 1,000,000 18.97
- 3. SEBI Registered – Research Analyst www.choicebroking.in * Please Refer Disclaimer on Website Morning Tea Contact Us Research Team Mr. Sumeet Bagadia Associate Director Kkunal Parar Sr. Research Associate Amit Pathania Research Associate Vikas Chaudhari Research Associate Kapil Shah Research Associate Rajnath Yadav Research Associate Satish Kumar Research Associate www.choicebroking.incustomercare@choiceindia.com Disclaimer This is solely for information of clients of Choice Broking and does not construe to be an investment advice. It is also not intended as an offer or solicitation for the purchase and sale of any financial instruments. Any action taken by you on the basis of the information contained herein is your responsibility alone and Choice Broking its subsidiaries or its employees or associates will not be liable in any manner for the consequences of such action taken by you. We have exercised due diligence in checking the correctness and authenticity of the information contained in this recommendation, but Choice Broking or any of its subsidiaries or associates or employees shall not be in any way responsible for any loss or damage that may arise to any person from any inadvertent error in the information contained in this recommendation or any action taken on basis of this information. Technical analysis studies market psychology, price patterns and volume levels. It is used to forecast future price and market movements. Technical analysis is complementary to fundamental analysis and news sources. The recommendations issued herewith might be contrary to recommendations issued by Choice Broking in the company research undertaken as the recommendations stated in this report is derived purely from technical analysis. Choice Broking has based this document on information obtained from sources it believes to be reliable but which it has not independently verified; Choice Broking makes no guarantee, representation or warranty and accepts no responsibility or liability as to its accuracy or completeness. The opinions contained within the report are based upon publicly available information at the time of publication and are subject to change without notice. The information and any disclosures provided herein are in summary form and have been prepared for informational purposes. The recommendations and suggested price levels are intended purely for trading purposes. The recommendations are valid for the day of the report however trading trends and volumes might vary substantially on an intraday basis and the recommendations may be subject to change. The information and any disclosures provided herein may be considered confidential. Any use, distribution, modification, copying, forwarding or disclosure by any person is strictly prohibited. The information and any disclosures provided herein do not constitute a solicitation or offer to purchase or sell any security or other financial product or instrument. The current performance may be unaudited. Past performance does not guarantee future returns. There can be no assurance that investments will achieve any targeted rates of return, and there is no guarantee against the loss of your entire investment. POTENTIAL CONFLICT OF INTEREST DISCLOSURE (as on date of report) Disclosure of interest statement – • Analyst interest of the stock /Instrument(s): - No. • Firm interest of the stock / Instrument (s): - No. 10th March 2017 Kkunal Parar Digitally signed by Kkunal Parar DN: cn=Kkunal Parar, o=Choice Equity Broking Pvt Ltd., ou=Research Dept., email=kkunal.parar@choiceindia.com, c=IN Date: 2017.03.10 08:44:36 +05'30'