SlideShare a Scribd company logo
1 of 98
b l u e p r i n t i CONSUMER PERCEPTIONS
HQW DQ
Perceptions Impact
Your Market?
By Nicole Olynk Widmar and
Melissa McKendree, Purdue University
I aintaining existing mar-
kets for pork products,
I cultivating new markets
for existing products and
creating new products for new markets
are some avenues that the U.S. pork
industry has sought, and continues to
explore, for growth. When it comes to
maintaining markets, there are several
relationships that must be considered.
End consumers, whether in restaurant
or supermarket settings, are increas-
ingly interested in social issues and the
production processes employed in food
production. Livestock products (meat
and dairy products) certainly seem
to get the majority of the spotlight in
regard to consumers' concern for pro-
duction processes.
Shoppers in supermarkets and din-
ers in restaurants have increased access
to information via the Internet, and are
in constant communication with one
another via social media and alterna-
tive news sources about perceptions
of animal agriculture. Even though
most U.S. consumers are not directly
in contact with livestock, concern for
the treatment of animals, including
those employed in food production,
is evident — and increasing. While
in the past consumers were mainly
concerned with factors like the fat or
nutritional content of pork, for exam-
ple, today's savvy shoppers are con-
sidering other factors, like the welfare
of livestock (pigs), safety of workers
employed on farms and potential envi-
ronmental impacts (externalities) of
livestock operations.
Large-scale changes in production
practices are taking place in livestock
24 April 15, 2014
production due to pressures from vari-
ous interested parties. Changes such
as the discontinued use of gestation
stalls, for example, are being sought
via traditional regulatory channels in
some states, but are also being pushed
via non-traditional market channels.
Consider the cumbersome process
of changing regulations, versus the
oftentimes faster (and perhaps easier)
channel of influencing key market
actors. It is no surprise that consum-
ers' concerns are increasingly voiced to
supermarkets and restaurants which,
in turn, take action to satisfy their
customers by placing pressure on sup-
ply-chain players. Changes sought via
"the market," rather than legislation or
regulation, are increasingly common,
and the use of market channels for
communicating throughout the supply
chain is unlikely to stop anytime soon.
www.nationalhogfarmer.com
Figure 1. Reported Recollection of Exposure to Media
Stories Regarding Pig Welfare, by Source
7 0 %
0 %
Television Internet
Media source
Printed Magazines
Newspaper
Books I have not seen
any media stories
regarding pig
welfare.
Melissa McKendree (left) and Nicole Olynk Widmar
A national-scale study completed
at Purdue University by Nicole Olynk
Widmar, Melissa McKendree, and
Candace Croney in 2013 was focused
on assessing consumers' perceptions of
various pork products. A total of 798
individuals from across the U.S. com-
pleted the survey, which was analyzed
to investigate relationships between
various consumer- and household-lev-
el characteristics, and their views on
animal welfare.
The average age of survey respon-
dents was 47, 48% of respondents were
male, and the average household size
was approximately two adults and 0.5
children. In addition to general house-
hold characteristics, survey respon-
dents were asked in-depth questions
regarding their perceptions of pork
production prac-
tices, and views on
the treatment of both
companion and live-
stock animals.
Respondents were
asked a number of
questions related to
pig welfare. When
asked specifically
about whether they
recalled seeing media
stories regarding the
welfare of pigs, the
majority of respon-
dents, 65%, report-
ed that they had not seen any media
stories. Yet, a total of 14% of survey
respondents reportedly reduced total
pork consumption in the past three
years due to animal welfare concerns.
Even if consumers are not explicitly
recalling having seen media stories on
pig welfare, it is highly likely that they
have been exposed to animal welfare
information via media or social inter-
actions.
Figure 1. Reported Recollection of
Exposure to Media Stories Regarding
Pig Welfare, by Source
Consumers report concern for the
welfare of livestock animals, in gen-
eral. Consumers were asked to report
their level of concern for the welfare of
livestock animals both raised domesti-
cally and produced outside
the U.S. It is evident that
there are, in general, larger
proportions of consumers
reporting extreme concern
for livestock raised outside
the U.S. Nonetheless, only
43% of respondents rated
their level of concern for
domestically produced live-
stock at 3 or below on the
scale provided, as seen in
Figure 2, page 26.
Figure 2. Reported
Concern for Livestock
Raised Both Domestically
and Outside the U.S.
There are, presumably,
a number of factors that
may be related to consumer
perceptions of pig welfare.
Demographics, including
age, gender, and/or political
affiliation, were investigat-
ed with regard to reported levels of
concern for domestically reared live-
stock. Those who indicated concern
for the welfare of animals employed in
domestic food production were more
frequently women, younger, and more
often owned a dog and/or cat than the
participants who were neutral or not
concerned. Of those reportedly con-
cerned about the welfare of domestic
food animals, 73% were dog and/or cat
owners, while 58% of those who were
reportedly neutral or not concerned
owned dogs and/or cats.
Not surprisingly, those who report-
ed concern for domestic food animals
more often reported reducing pork
consumption due to animal welfare
concerns. Those who reported being
not concerned about the welfare of
domestic food animals more fre-
quently self-reported as a member of
the Republican political party, while
those who reported being concerned
were more frequently members of the
Democratic Party.
Recently, a great deal of attention
has been paid to linkages in consum-
ers' minds between the welfare of pets
or companion animal species and the
welfare of farm animals. It is common
for animal welfare campaigns to link
companion animals and farm animal
issues. Given the vast number of U.S.
households with pets and the relatively
small number of people with direct
www.nationalhogfarmer.com April 15,2014 25
b l u e p r i n t i CONSUMER PERCEPTIONS
experience with livestock care, it is
certainly believable that companion
species may be the point of reference
for many people when it comes to
animal welfare. The study highlights
key demographic factors — including
pet ownership — related to consumers'
perceptions of animal welfare. A total
66% of households surveyed reported
owning at least one animal; 48% of
households owned dogs, 41% owned
cats, 3% owned horses and 10% owned
other animals. Interestingly, all those
who owned a horse also reportedly
owned a cat and/or a dog.
Dog and/or cat owners were found
to be statistically different from those
who do not own a cat or dog across
many different factors. When analyz-
ing demographic characteristics, those
who reported being dog and/or cat
owners were more frequently female,
younger, had larger households (more
adults and children in the house), and
higher weekly food expenditures. Dog
and/or cat owners also had visited a
farm with animals raised for meat or
milk production more recently, and
were more concerned about food-
animal welfare for both domestically
raised animals and animals raised out-
side the U.S. Dog and/or cat owners
also more frequently reported having a
source for animal welfare information,
whether The Humane Society of the
Figure 2. Reported Concern for Livestock Raised
Domestically and Outside the United States
4->
40.00
35.00
30.00
Level of concern
• Domestically pro(juce(d
• Produced outside of the U.S.
1 2
Not
concerned
United States (HSUS) or People for the
Ethical Treatment of Animals (PETA),
or another source, than those who did
not own a cat or dog. However, nearly
half of the dog and/or cat owners did
not report having a source for animal
welfare information. It is hypothesized
AV-E DIGEST
A proven replacement for ALL otiier /
premium protein ingredients in pig starters. /
y/100% Poultry Based |
y^ Proven Safe JE'
• From a USDA
inspected facility /
y^ Proven , I
Performance U '•
Best Value
I'm taking no chances and INSISTiNG
on AV-E DiGEST in ali my pig starters
3850 Merle Hay Rd.,Ste. 212 - D e s Moines, Iowa 50310
800-424-0185 • 515-270-0185 • Fax 515-270-0214
Email; in/[email protected])roducts.com mm.xfeproauas.com
5 6 7
Extremely
concerned
that owning a pet, regardless of your
information source, predisposes one
to be concerned about animal welfare.
Therefore, the existence of the human-
animal bond with dogs or cats poten-
tially influences a person's perceptions
of food-animal welfare.
Due to recent media attention on
livestock housing, especially regarding
cages and housing systems for pigs and
chickens, dog and cat owners were also
asked if they confined their cats and/or
dogs to a cage or kennel. If one accepts
the potential for the public to link
companion animal care with livestock
treatment, the question of caging pets
becomes of great interest to animal
agriculture as various livestock pro-
ducers, especially those raising pigs,
face continued pressures to disadopt
the use of stalls in favor of group hous-
ing or other alternative systems.
Potentially, survey respondents who
cage their own animals may feel dif-
ferently about caging other animals,
including livestock, than those who
do not cage their animals. Of the 65%
of households that owned cats and/
or dogs, 416 (80%) indicated that they
did not confine their cats and/or dogs.
The majority of those who specified
they did confine their cat and/or dog
only did so for less than six hours per
26 April 15,2014
b l u e p r i n t i OONSUMER PEROEPTIONS
day. Specifically, 56 (11%) households
confined their cat and/or dog for less
than six hours per day, 27 (5%) house-
holds did so seven to 12 hours per day,
13 (3%) households did so 13 to 18
hours per day and six (1%) households
did so 19 to 24 hours per day. Those
who cage their dog and/or cat more
frequently stated that they reduced
their pork consumption due to animal
welfare concerns, and recalled media
stories regarding pig welfare (Eigure
3, page 30).
Figure 3. Cross Tabulations for
Dog and/or Cat Owners Who Report
Caging Their Dog and/or Cat, vs.
Those Who Report Not Caging Their
Dog and/or Cat
When looking at information sourc-
es on animal welfare, those who cage
their dog and/or cat more common-
ly stated that they had an informa-
tion source. Additionally, those who
cage their dog and/or cat more fre-
quently reported using sources other
than HSUS or PETA. More dog and/
or cat owners who cage their animals
also reported being concerned about
domestic food-animal welfare; how-
ever, only one statistical difference was
found when looking at specific pork
industry practices.
It is worth noting that no statistical
differences were found among dog and
cat owners who cage and do not cage
their animals regarding pig housing
(i.e., confining hogs indoors, farrow-
ing crates, gestation crates and group
pens). Agricultural industries have
long speculated that people who cage
their animals would be less apt to be
concerned about the housing of hogs
in crates or stalls.
However, this analysis finds that
those who cage their cat and/or dog
do not differ in their mean level of
concern for pig housing situations
from those who do not cage their cat
and/or dog. On the contrary, as evi-
denced by higher reporting of reduc-
tion in pork consumption due to
animal welfare concerns and more
concern for domestic food-animal
welfare, those who cage their animals
seem to be overall more concerned
about food-animal treatment.
Given the concern for understand-
ing key consumer markets, analy-
ses were conducted by regions of
the country in which respondents
lived. Those from the Midwest region
(204 respondents) were statistically
less concerned about pig welfare at
the farm level than those from the
Northeast (198 respondents) or West
(184 respondents) regions of the U.S.
A stark difference in animal welfare
concern for pork industry practices
is evident. Eor nearly all practices
in question, respondents from the
Midwest region were statistically less
concerned than those from other
regions of the U.S.
Additionally, those from the
Midwest more frequently reported
not having a source for animal wel-
fare information than those from
the Northeast or West regions. The
Midwest states are among the top-pro-
ducing hog states in the U.S.; poten-
June 25 & 26, 2014
Boone. Iowa
THE NATION'S LAB6IST 2-DAY HAY & FORAGE EVENT
HayExpo.com
(866) 264-7469
[email protected]
Host Publications:
íHay^aragel
; Agriculturist |
Leaves of gold I
Ä ^ Apply maniira I
YOUR one-stop hay and forage
: teaming and shopping
opportunity
• Mowing and conditioning
demonstrations
• Baling and handling demos
Silage demonstrations
- Major and shortline hay/forage
manufacturer exhibits, production
and storage equipment
• Seed companies and many
additional exhibitors
• Educational opportunities
Exhibit Hours:
9 a.m. to 4 p.m.
'arking: $10 per vehicle.
Imission to event is free.
Improve Your Productivity &
Bottom Line
NEW! Hay & Forage Expo introduces its new name
and its alliance with Hay & Forage Grower magazine,
the industry's comprehensive information leader.
You can't afford to miss this event!
If hay and/or forage production is a part of your f a r m -
no matter the size — this show is for you.
Plan Now
to Attend!
JOHN DEERE
4-RamPtOgress. Penton Farm Progress Group 255 38th Avenue,
Suite P St. Charles, IL60174-5410 PentonFarmProgress.com
[email protected]^^^_
2 8 April 15, 2014 www.nationalhogfarmer.conn
tially, the results suggest that those
who are living in geographic areas
familiar with hog farming may be less
concerned about hog production prac-
tices. Beyond concern for pork pro-
duction practices, respondents from
the Midwest had a statistically lower
mean level of concern for the welfare
of livestock produced in the U.S.
Regional Differences
Recognition of regional differences
is important, because if those who are
most likely to interact with livestock
animals (or any animals) are not cogni-
zant or aware of concerns surrounding
animal welfare, then potential prob-
lems could go unrecognized. Inherent
differences across regions in terms of
animal welfare concerns, especially
when comparing livestock- and hog-
producing regions to other regions, can
yield challenges for communicating
with consumers effectively.
The perceptions of today's pork con-
sumers regarding the treatment of live-
stock animals will impact the industry
in the future via multiple avenues,
including what products consumers
demand, what they are willing to pay
for those products, and fundamen-
tally which markets will continue to
exist, grow, shrink or cease to exist.
Understanding the consumer demo-
graphics and characteristics which may
be related to perceptions of livestock
welfare, such as pet ownership, views
of livestock practices, etc., can aid the
pork industry in effectively communi-
cating with its end consumers — and
in understanding their concerns.
A key factor that was associated
with general animal welfare concern
was pet ownership. It is hypothesized
that the bond between humans and
animals and whether the individual
reports having any source for animal
welfare information play a primary
role in an individual's concern for ani-
mal welfare, more so than whether
their source of information for animal
welfare was HSUS or PETA.
Potentially, those who own pets feel
stronger moral obligations to food
animals and will be more concerned
about their well-being. The increased
altruism for food animals may stem
from concerns arising from interac-
tions with pets and then other addi-
tional factors, such as the source for
April 15,2014 29
animal welfare information, educa-
tion, age and gender, which could
further increase concern for animal
welfare. This finding, which connects
pet ownership to increased concern
for livestock animals, will have impli-
cations for education, communication,
and marketing.
Although a causal relationship can-
not be established, pet ownership and
increased concern for food-animal wel-
fare appear to be correlated. Also, it is
not necessarily that activists targeting
pet owners cause people to become
concerned about animal well-being,
but it may be that those already con-
cerned are connecting with groups that
share their concerns. Any latent moral
beliefs about perceived obligations to
animals seem to be connected with (not
necessarily caused by) pet ownership
and human-animal bonds.
© 2014 Penton Media, Inc. All rights reserved.
[Title]-Stem cell treatment and the positive impact on
autoimmune diseases.
Research Question-What positive impact has the use of the stem
cell treatment in patients with autoimmune diseases?
Objectives of the project.
1. To investigate the use of stem cell treatment in autoimmune
diseases.
2. To demonstrate the positive impact of using stem cells to
treat autoimmune diseases.
3. To present through a systematic review of the literature
therapeutic options with stem cells that have the ability to
successfully treat patients with autoimmune diseases.
Theoretical Framework- La teoría de la consecución de
objetivos desarrollada por Imogene King.
My job no needed PICOT question due to be a literature review.
My References-I Needs more references
Ahmed, Z., Imdad, A., Connelly, J. A., & Acra, S. (2019).
Autoimmune Enteropathy: An Updated Review with Special
Focus on Stem Cell Transplant Therapy. Digestive Diseases &
Sciences, 64(3), 643–654. https://doi-org.librarylogin-
cupey.uagm.edu/10.1007/s10620-018-5364-1
Snowden, J. A., Sharrack, B., Akil, M., Kiely, D. G., Lobo, A.,
Kazmi, M., Muraro, P. A., & Lindsay, J. O. (2018). Autologous
haematopoietic stem cell transplantation (aHSCT) for severe
resistant autoimmune and inflammatory diseases -- a guide for
the generalist. Clinical Medicine, 18(4), 329–334. https://doi-
org.librarylogin-cupey.uagm.edu/10.7861/clinmedicine.18-4-
329
Ferreira Zombrilli, A., Leopoldo, V. C., Oliveira, M. C., Cirioli
de Oliveira, M. de F., Ehmke Dolci, M., Merizio Martins Braga,
F. T., & de Campos Pereira Silveira, R. C. (2019). Virtual
learning object in hematopoietic stem cell transplantation for
autoimmune diseases. Revista Brasileira de Enfermagem, 72(4),
994–1000. https://doi-org.librarylogin-
cupey.uagm.edu/10.1590/0034-7167-2018-0669
Balassa, K., Danby, R., & Rocha, V. (2019). Haematopoietic
stem cell transplants: principles and indications. British Journal
of Hospital Medicine (17508460), 80(1), 33–39. https://doi-
org.librarylogin cupey.uagm.edu/10.12968/hmed.2019.80.1.33
Van Laar, J. M., Naraghi, K., & Tyndall, A. (2015).
Haematopoietic stem cell transplantation for poor-prognosis
systemic sclerosis. Rheumatology, 54(12), 2126–2133.
https://doi-org.librarylogin-
cupey.uagm.edu/10.1093/rheumatology/kev117
Atkins, H., Freedman, M., Atkins, H. L., & Freedman, M. S.
(2017). Five Questions Answered: A Review of Autologous
Hematopoietic Stem Cell Transplantation for the Treatment of
Multiple Sclerosis. Neurotherapeutics, 14(4), 888–893.
https://doi-org.librarylogin-cupey.uagm.edu/10.1007/s13311-
017-0564-5
Currò, D., Mancardi, G., & Currò, D. (2016). Autologous
hematopoietic stem cell transplantation in multiple sclerosis: 20
years of experience. Neurological Sciences, 37(6), 857–865.
https://doi-org.librarylogin-cupey.uagm.edu/10.1007/s10072-
016-2564-3
Baharlou, R., Rashidi, N., Ahmadi-Vasmehjani, A., Khoubyari,
M., Sheikh, M., & Erfanian, S. (2019). Immunomodulatory
Effects of Human Adipose Tissue-derived Mesenchymal Stem
Cells on T Cell Subsets in Patients with Rheumatoid Arthritis.
Iranian Journal of Allergy, Asthma & Immunology, 18(1), 114–
119.
Ferreira Zombrilli, A., Leopoldo, V. C., Oliveira, M. C., Cirioli
de Oliveira, M. de F., Ehmke Dolci, M., Merizio Martins Braga,
F. T., & de Campos Pereira Silveira, R. C. (2019). Virtual
learning object in hematopoietic stem cell transplantation for
autoimmune diseases. Revista Brasileira de Enfermagem, 72(4),
994–1000. https://doi-org.librarylogin-
cupey.uagm.edu/10.1590/0034-7167-2018-0669
Snowden, J. A., Sharrack, B., Akil, M., Kiely, D. G., Lobo, A.,
Kazmi, M., Muraro, P. A., & Lindsay, J. O. (2018). Autologous
haematopoietic stem cell transplantation (aHSCT) for severe
resistant autoimmune and inflammatory diseases -- a guide for
the generalist. Clinical Medicine, 18(4), 329–334. https://doi-
org.librarylogin-cupey.uagm.edu/10.7861/clinmedicine.18-4-
329
Ahmed, Z., Imdad, A., Connelly, J. A., & Acra, S. (2019).
Autoimmune Enteropathy: An Updated Review with Special
Focus on Stem Cell Transplant Therapy. Digestive Diseases &
Sciences, 64(3), 643–654. https://doi-org.librarylogin-
cupey.uagm.edu/10.1007/s10620-018-5364-1
APA -Rebeiro, P., & Moore, J. (2016). The role of autologous
haemopoietic stem cell transplantation in the treatment of
autoimmune disorders. Internal medicine journal, 46(1), 17-28
APA- Snowden, J. A., Badoglio, M., Labopin, M., Giebel, S.,
McGrath, E., Marjanovic, Z., ... & Kazmi, M. (2017). Evolution,
trends, outcomes, and economics of hematopoietic stem cell
transplantation in severe autoimmune diseases. Blood advances,
1(27), 2742-2755.
Xiaoxiao Lu, Xilian Wang, Hong Nian, Dan Yang & Ruihua
Wei. Mesenchymal stem cells for treating autoimmune
dacryoadenitis Stem Cell Research & Therapy, volume 8,
Article number: 126 (2017)
How to write a Proposal
1. Literature review
2. Case study (You need a letter of approval from the patient
and/or the provider, describe how you are handling
confidentially of the information)
3. Pre and post-education (You may need to write a consent
form, and you need a letter of approval from your organization)
Components of the Proposal
I. Title
II. Introduction
An introduction should announce your topic. You can start your
introduction with a few sentences, which announce the topic of
your paper and give an indication of the kind of research
questions you will be asking. The first few sentences should act
as an indication of a broader problem, which you will then
focus on more closely in the rest of your introduction, leading
to your specific research questions. The introduction should
include the purpose of the project and the Methods.
III. The Problem
1. Research Question
The research question should be concise and closely focused.
The research question might recall some of the key words
established in the first few sentences and the title of your paper.
You have to write the Question.
2. Objective or Objectives
Objectives must always be set after having formulated a
good research question. After all, they are to explain the way in
which such a question is going to be answered. Objectives are
usually headed by infinitive verbs such as:
·
· To identify
· To establish
· To describe
· To determine
· To estimate
· To develop
· To compare
· To analyze
· To collect
3. You need to explain the contribution of the research to the
topic and to the advanced nursing practice. Use references.
IV. Review of Literature.
The purpose is to offer an overview of the significant literature
published on a topic:
1. identifies areas of prior scholarship
2. Describes the relationship of each source to the others that
you have selected
3. Points the way forward for further research.
The literature review should include the following:
1. Objective of the literature review
2. Overview of the subject under consideration.
3. Particular position, those opposed, and those offering
completely different arguments.
4. Discussion of both the distinctiveness of each source and its
similarities with the others.
No less than 30 references (15 for NURS 502, and 15 for NURS
503).
No older than 2015.
Include a nursing theory or a conceptual model and describe
it.
V. Methodology.
· Describe the design
· Identify the variable
· Describe the reliability and validity of the instrument
· Describe the population and the sample.
· Describe the steps to protect the rights of human according to
IRB criteria.
· Discuss the procedure to complete the study.
VI. Data analysis.
4. Describe the data analysis according to the design and
variables.
Addendum:
1. Copy of the proposal.
2. Copy of instruments.
3. Copy of consents.
4. IRB F01 (or F08).
5. CV
6. CITI training.
7. APA.
NOTE: This is a template and guide. Delete all highlighted
materials.
Note that there is no heading that says Introduction. The
paragraph or two that follows the title on the first page of your
text is assumed to be your introduction. Your introduction
follows the title of your paper (note that the title is not bolded).
You should start your introduction with a powerful statement or
two to stimulate interest. You should identify the purpose of
your paper. Remember that formal papers are in third person, so
no I, me, we except in specified areas. The introduction should
include the purpose of the project and the Methods.
Significance of the Practice Problem
Start this section with identification of the practice problem.
This section should also answer the question “why is this
important?” You should address the significance to the
patient/client (e.g., pain, suffering, quality of life, impact on
income potential, etc.), the family, healthcare system (e.g.,
impact on cost or delivery systems), and society (e.g., cost of
care, need for healthcare policy). Discuss the incidence and/or
prevalence and include the financial impact if possible. You
might discuss the impact on length of stay, readmission, home
health care requirements, disability and/or mortality. Also, you
should address any quality, safety, legal, and ethical
implications. This discussion must be substantiated by citations
from professional literature.
Research Question
This section should include your research question, but also
should include the three objectives that will assist you to
answer your question. This section contains your operational
definitions of the variables in the question. If you use
definitions from the literature, be sure to cite them.
Theoretical Framework
This section should include the theoretical framework that
supports your MSN Project. Describe the theory or model that
served as the foundation for your project. This may be a nursing
theory or a theory from another discipline if pertinent and
applicable.
Synthesis of the Literature
Synthesize at least 30 primary research studies (15 during
NURS 502 & 15 during NURS503) and/or systematic reviews;
do not include summary articles. This section is all about the
scientific evidence rather than someone else’s opinion of the
evidence. Do not use secondary sources; you need to get the
article, read it, and make your own decision about quality and
applicability to your question even if you did find out about the
study in a review of the literature. The studies that you cite in
this section must relate directly to your research question. This
is a synthesis rather than a study-by-study review. Address the
similarities, differences, and controversies in the body of
evidence.
Practice Recommendations
So. . . using available evidence, what is the answer to your
question? This section is for you to summarize the strength of
the body of evidence (quality, quantity, and consistency), make
a summary statement, and based on your conclusions drawn
from the review, give a recommendation for practice change
based on scientific evidence. This would logically be the
intervention of your PICOT question. You might want to design
an algorithm and include it in as a figure. Perhaps you found
substantiation for usual practice, and you recommend
reinforcement and education regarding this best practice.
Project Description
Describe the form that the literature review will carry out, how
many articles, and how many years old. Add the websites that
you will research for the search of articles, keywords that you
will use for your search
Here you should include the impact that your research will
have. It must also include that it will be kept for 5 years in a
locked office of the home of the principal investigator, and that
after that time has elapsed, it will be destroyed.
This section may be in first person.
Project Evaluation Results
This section must include how you will evaluate the planned
change project. Remember that you must have evaluated the
outcome(s) identified in your PICOT question
Here you should mention the tables A and B that you will use
for the evaluation of the results of your literature review.
Describe each of the tables (A & B) that are at the end of the
template. Tables and Figures should follow the References
This section may be in first person.
Discussion and Implications for Nursing and Healthcare
Discuss the conclusions you can make from the project
evaluation results: review and answer your PICOT question.
Examine, interpret, and qualify the results. Discuss internal
validity and limitations of the project evaluation. Take into
account sources of potential bias and other threats to internal
validity, the imprecision of measures, and other limitations and
weaknesses of the evaluation (adapted from APA, 2010, p. 35).
Describe the implications of your project and the project
evaluation on nursing practice and healthcare. Do not overstate
the significance. Identify the impact on the appropriate
microsystem. Include any recommendations you have as a result
of this project and project evaluation. Also, include what you
might recommend with replication of this project and project
evaluation and your potential next steps for this practice
problem.
Plans for Dissemination
This section should include your plan for sharing the results of
your project within the institution and within the professional
community. Discuss who you invited to the presentation of
results at the institution and how you presented the information.
Describe the response of stakeholders to your presentation and
about the potential for sustainability. Also, discuss your plans
for presentation at regional or national meetings and/or
publication. If publication is planned, discuss what journal you
will submit your manuscript to and why. The dissemination
must be among the classmates with a PowerPoint presentation; a
poster with a brief summary of project plan, evaluation, and
results to be exposed in the hall at Ana G Mendez, SFC; and a
hard copy to be left at the library to be reviewed for those
students of facilitators interested in the topic.
This section may be in first person.
Summary and Conclusion
The conclusion should start with a statement regarding the
intent of the paper and your achievement toward that intention.
Remember that the introduction is a preview, and this section
should contain a summary.
When completed your summary and conclusion, do not include a
categorical conclusion, which means, that you should not
mention the results of your literature review, otherwise, this
would give the impression that your project has ended. It must
include the importance of what has been reviewed so far, and
the need to finalize the literature review in order to have a more
conclusive result.
References
Remember that this is a reference list rather than a
bibliography. A bibliography is everything you read to prepare
the paper but a reference list is only what you cited. If there is
not a citation for a reference, it should not be here. PLEASE
make sure that your references here and your citations
throughout the paper are in APA format. Take the time to make
sure that they are correct. We have already formatted the paper
for you with this template.
Figure 1
Figures included here are most likely going to be figures
illustrating your data analysis.
Appendix A
NOTE: Order these appendices in the order in which they were
referred to in the paper.
Summary of Primary Research Evidence (this table may be
single space)
Citation
Question or Hypothesis
Theoretical Foundation
Research Design (include tools) and Sample Size
Key Findings
Recommendations/
Implications
Level of Evidence
Legend:
Level I: systematic reviews or meta-analysis
Level II: well-designed Randomized Controlled Trial (RCT)
Level III: well-designed controlled trials without
randomization, quasi-experimental
Level IV: well-designed case-control and cohort studies
Level V: systematic reviews of descriptive and qualitative
studies
Level VI: single descriptive or qualitative study
Level VII: opinion of authorities and/or reports of expert
committees
Appendix B
Summary of Systematic Reviews (SR) (this table may be single
space)
Citation
Question
Search Strategy
Inclusion/
Exclusion Criteria
Data Extraction and Analysis
Key Findings
Recommendation/
Implications
Level of Evidence
Legend:
Level I: systematic reviews or meta-analysis
Level II: well-designed Randomized Controlled Trial (RCT)
Level III: well-designed controlled trials without
randomization, quasi-experimental
Level IV: well-designed case-control and cohort studies
Level V: systematic reviews of descriptive and qualitative
studies
Level VI: single descriptive or qualitative study
Level VII: opinion of authorities and/or reports of expert
committees
1
Unit III:
Perception, Learning, and
Memory
Course Learning Objectives for Unit III
3. Explain how consumers interpret information about products
and people.
3.1 Explain how consumers interpret information about
products and
people through their perceptions, learning, and memory.
5. Describe how self-perception influences consumers’ actions.
5.1 Describe the importance of self-perception and its influence
on
consumer buying.
6. Explore how one’s personality influences lifestyle choices.
6.1 Explain how differences in consumer personalities impact
their
buying choices and overall lifestyle choices.
Sensation
• Sensation: This is the immediate response of sensory
receptors (e.g., eyes, ears, mouth, fingers, skin).
• Perception: This is the process by which people select,
organize, and interpret these sensations.
• Hedonic consumption: This encompasses the
multisensory emotional aspects of consumers’
interactions with products.
• Sensory marketing: Companies have to think carefully
about the impact of sensations on product experiences.
Stages of Perception
• Sensory threshold: Point at which it is strong enough to
make a conscious impact in his or her awareness
• Absolute threshold: Minimum amount of stimulation a
person can detect
• Differential threshold: Ability of a sensory system to
detect changes in or differences between two stimuli
• Subliminal perception: Stimulus below the level of the
consumer’s awareness
Attention
• Attention: This refers to the extent to
which the processing activity is
devoted to a particular stimulus.
• How do marketers get our attention?
– Commercial breaks
– Rich media
– Something outrageous
• Perceptual vigilance: We are more
likely to be aware of stimuli that relate
to our current needs.
• Perceptual defense: We tend to see
what we want to see.
Interpretation
• Interpretation: This refers to the meanings we
assign to sensory stimuli.
• Closure principle: People tend to perceive an
incomplete picture as complete.
• Principle of similarity: Consumers tend to group
together objects that share similar physical
characteristics.
• Figure ground principle: One part of the stimulus
will dominate.
Learning
• Classical conditioning: This is when a stimulus that creates a
response is paired with another stimulus that initially does
not cause a response.
– Unconditioned stimulus, conditioned stimulus,
conditioned response
• Learning is a relatively
permanent change in behavior
caused by experience.
• Behavioral learning theories:
These suggest that learning
takes place as the result of
responses to external events. Person reading book
(Alexas_Fotos(, 2017)
Marketing Applications
• Brand equity: The brand has a
strong and positive association in
a consumer’s memory and
creates loyalty.
• Instrumental conditioning: This
occurs when we learn to perform
behaviors that produce positive
outcomes.
– Positive reinforcement, negative
reinforcement, punishment
(3dman_eu, 2013)
Marketing Applications (cont)
• Frequency marketing: Rewards regular purchasers
• Gamification: Turns routine actions into
experiences by adding gaming elements
• Cognitive learning theory: Stresses the
importance of internal mental processes
• Observational learning: Occurs when we watch
the actions of others and note the reinforcements
they receive
Learning to be Consumers
• Consumer socialization:
When young people acquire
skills, knowledge, and
attitudes that help them
function in the marketplace
• Cognitive development:
Ability of children to
comprehend concepts of
increasing complexity
– Limited, cued, strategic
– Multiple intelligence theory
Adult and child using laptop
(Alphalight1, 2013)
Memory
• Memory is the process of acquiring
information and storing it over time.
– Encoding and retrieving stages
– Sensory memory, short-term memory, long-term
memory
– Activation models of memory
• Associative network: Contains bits of related
information
• Spreading activation: Shift back and forth among levels
of meaning
Retrieving Memories
• Helps consumers determine
what to buy based off of
previous experiences
• Forgetting: Decay vs.
interference
• State-dependent retrieval: Can
access information easier if in
the same environment asa
where it was encoded
Brain
(geralt, 2015)
References
Alexas_Fotos. (2017). School study learn [image]. Retrieved
from
https://pixabay.com/en/school-study-learn-books-read-2051711/
Alphalight1. (2013). Child at computer [Photograph]. Retrieved
from
https://pixabay.com/en/child-girl-young-caucasian-1073638/
Geralt. (2015). Brain turn on [Image]. Retrieved from
https://pixabay.com/en/brain-turn-on-education-read-book-
770044/
3dman_eu. (2013). Brand business company [Image]. Retrieved
from
https://pixabay.com/en/brand-business-company-mark-focus-
1027862/
This presentation is
copyrighted by Columbia
Southern University.
Use of this video without the express
written consent of Columbia Southern
University is prohibited.
MAR 3211, Consumer Behavior 1
Course Learning Outcomes for Unit III
Upon completion of this unit, students should be able to:
3. Explain how consumers interpret information about products
and people.
3.1 Explain how consumers interpret information about products
and people through their
perceptions, learning, and memory.
5. Describe how self-perception influences consumers’ actions.
5.1 Describe the importance of self-perception and its influence
on consumer buying.
6. Explore how one’s personality influences lifestyle choices.
6.1 Explain how differences in consumer personalities impact
their buying choices and overall
lifestyle choices.
Course/Unit
Learning Outcomes
Learning Activity
3.1
Unit Lesson
PowerPoint Presentation
Nakamura (2014) article
Olynk Widmar and McKendree (2014) article
TED (2012) video
Web Assignment
5.1
Unit Lesson
PowerPoint Presentation
Hart (2011) article
Nakamura (2014) article
Olynk Widmar and McKendree (2014) article
TED (2012) video
Web Assignment
6.1
Unit Lesson
PowerPoint Presentation
Hart (2011) article
Nakamura (2014) article
Olynk Widmar and McKendree (2014) article
TED (2012) video
Web Assignment
Reading Assignment
In order to access the following resources, click the links
below.
Click here to access the Unit III PowerPoint presentation.
(Click here to access a PDF version of the
presentation.)
Hart, L. (2011). Tips for influencing consumer perceptions.
Kitchen & Bath Design News, 29(4), 32. Retrieved
from
https://libraryresources.columbiasouthern.edu/login?url=http://s
earch.proquest.com.libraryresources.c
olumbiasouthern.edu/docview/864589615?accountid=33337
UNIT III STUDY GUIDE
Perception, Learning, and Memory
https://online.columbiasouthern.edu/bbcswebdav/xid-
68746811_1
https://online.columbiasouthern.edu/bbcswebdav/xid-
68746795_1
https://libraryresources.columbiasouthern.edu/login?url=http://s
earch.proquest.com.libraryresources.columbiasouthern.edu/docv
iew/864589615?accountid=33337
https://libraryresources.columbiasouthern.edu/login?url=http://s
earch.proquest.com.libraryresources.columbiasouthern.edu/docv
iew/864589615?accountid=33337
MAR 3211, Consumer Behavior 2
UNIT x STUDY GUIDE
Title
Nakamura, L. (2014). Hidden value: How consumer learning
boosts output. Business Review - Federal
Reserve Bank of Philadelphia, 9–14. Retrieved from
https://libraryresources.columbiasouthern.edu/login?url=http://s
earch.proquest.com.libraryresources.c
olumbiasouthern.edu/docview/1565808769?accountid=33337
Olynk Widmar, N., & McKendree, M. (2014). How do consumer
perceptions impact your market? National
Hog Farmer, 59(4), 24–29. Retrieved from
https://libraryresources.columbiasouthern.edu/login?url=http://s
earch.ebscohost.com/login.aspx?direc
t=true&db=bth&AN=95698066&site=ehost-live&scope=site
TED. (2012, July 19). TEDTalks: Joseph Pine—What do
consumers really want? [Video file]. Retrieved from
https://libraryresources.columbiasouthern.edu/login?auth=CAS
&url=http://fod.infobase.com/PortalPla
ylists.aspx?wID=273866&xtid=48396
Click here to access the transcript for the video above.
Unit Lesson
Why does a marketer need to understand consumer perceptions,
learning, and memory? Let us remember
that marketing strategy is really all about how a company
presents a bundle of benefits to the consumer. In
order to present this bundle, the marketer must ultimately
understand the value proposition or, in other words,
what the customer considers to be of value. It is through these
efforts of understanding what the consumer
thinks to be of value that the marketer attempts to discover
consumer perceptions, learning, and memory.
Beginning with a few definitions, learning refers to the change
in behavior resulting from the interaction
between a person and a stimulus. Perception involves how a
consumer views and responds to his or her
surroundings. Value is interpreted from learning, and perception
plays an instrumental role in learning. The
two are intertwined within the context of consumer behavior.
The consumer perception process is important to
marketers as it identifies components involved with how
consumers become aware of and interpret the
environment. The consumer perception process involves three
stages.
These phases of the consumer perception process enable
marketers to understand how consumers perceive
stimuli, process it, and ultimately decide to buy or not buy the
items that marketers are advertising.
Sensing
•Immediate response to stimuli
•Consumer enters store or Internet site and is exposed to a
variety of things
Organizing
•Assembly of sensory evidence into something recognizable
•Consumer tries article of clothing on and recognizes whether
the style is right for his
or her uses
Reacting
•Taking action
•Consumer decides to buy or not buy item
https://libraryresources.columbiasouthern.edu/login?url=http://s
earch.proquest.com.libraryresources.columbiasouthern.edu/docv
iew/1565808769?accountid=33337
https://libraryresources.columbiasouthern.edu/login?url=http://s
earch.proquest.com.libraryresources.columbiasouthern.edu/docv
iew/1565808769?accountid=33337
https://libraryresources.columbiasouthern.edu/login?url=http://s
earch.ebscohost.com/login.aspx?direct=true&db=bth&AN=9569
8066&site=ehost-live&scope=site
https://libraryresources.columbiasouthern.edu/login?url=http://s
earch.ebscohost.com/login.aspx?direct=true&db=bth&AN=9569
8066&site=ehost-live&scope=site
https://libraryresources.columbiasouthern.edu/login?auth=CAS
&url=http://fod.infobase.com/PortalPlaylists.aspx?wID=273866
&xtid=48396
https://libraryresources.columbiasouthern.edu/login?auth=CAS
&url=http://fod.infobase.com/PortalPlaylists.aspx?wID=273866
&xtid=48396
https://online.columbiasouthern.edu/bbcswebdav/xid-
68746833_1
MAR 3211, Consumer Behavior 3
UNIT x STUDY GUIDE
Title
Because of the large amount of marketing and advertising that
consumers are exposed to on a daily basis,
consumers have learned how to selectively process these stimuli
through selective perception. This is done
through the methods described below.
efforts, not even seeing much of what is
presented to them.
marketing that is of interest to them.
their own beliefs.
We live in a very cluttered world with respect to marketing and
advertising. Consumers look to unclutter with
these methods of selective perception. Joseph Pine (TED, 2012)
discusses how perception plays into
customer buying with his TED Talk, What Do Customers Really
Want? He believes that customers want to
feel or perceive that what they buy is authentic. The concept of
mass customization really lines up contrary to
this customer need. Look at his TED Talk in the Required
Reading section of this unit.
Learning and memory are the next discussion points in this
lesson. Comprehension, memory, and cognitive
learning focus on the mental processes that occur in the
consumer’s mind as he or she receives and
processes the marketing stimuli. Beginning with several
definitions, comprehension refers to the level of
understanding that a consumer has about a certain stimuli. This
involves both cognitive and affective
elements that include both thoughts and feelings. Obviously,
there are many things that will affect the level of
comprehension, including the message itself, the receiver, and
the environment in which the information is
being received. Within the message, components could be the
colors, loudness, source of the message, or
even the font used. Looking at the receiver, components of this
could include his or her level of intelligence,
knowledge of the topic, level of involvement with the
advertisement, or his or her personal expectations.
Environmental components would include anything that is going
on within the environment as the marketing
information is being received. This could include the physical
environment (i.e., situational factors) that are
presented within a retail setting that the consumer may be
visiting. Some retail stores use atmospherics to
present a pleasing experience to their targeted customers. For
example, the Hollister store creates a
California-type of atmosphere with graphics, objects, and music
to appeal to their target market of teenagers.
The popular Bass Pro Shops creates an outdoor feel with
bridges, fountains, and trees, appealing to its target
market of outdoors people.
Another impactful environmental issue that could influence
spending levels is the state of the economy, which
obviously affects discretionary spending levels. Another
concept is that of framing, which suggests that the
method by which the marketing is presented will actually
influence the message in different ways. For
example, if the label on beef states “5% fat” or “95% lean,”
which would you think is more favorably
perceived? Another example might be a consumer passing a sign
that states that there are no gas stations for
25 miles. If you are driving through your hometown, this might
not have as much of an impact as if you were
driving through an unfamiliar area of the country.
Memory is a process by which the knowledge received by the
consumer is recorded and stored. At the end of
the day, the goal for marketers is that consumers receive and
remember the marketing message presented.
The human memory system, at its basic level, consists of three
areas, which are shown in the figure below.
Sensory Memory
• Storage of
everything
consumer is
exposed to
Workbench Memory
• Short-term area
where information is
temporarily stored
and encoded for
future use
Long-Term Memory
• Permanent
repository for
information
MAR 3211, Consumer Behavior 4
UNIT x STUDY GUIDE
Title
The process of sensory memory to workbench memory to long-
term memory creates a flow of information
that leads to learning, which activates certain consumer buying
behaviors. Associated in this long-term
memory area is nostalgia that refers to a desire to relive the
past, typically associated with emotions. Many
times, this replays itself as a preference toward objects, songs,
or situations that were familiar when the
consumer was younger. Why do you think this is such an
effective method of marketing and advertising?
Could it be that when we think of the past, we tend to remember
the good times? From a marketer’s
standpoint, using these images and ideas from the past is
actually less costly. Additionally, it is less risky than
a new idea because the marketer already knows how the image
is perceived. The use of nostalgia in
marketing has proven to have an incredibly large amount of
positive emotional engagement as well as
increased brand retention and perception.
Moving beyond nostalgia, but related to memory, is the concept
of social stereotypes; social stereotypes are
present when consumers perceive a certain type of person to
have certain roles. For instance, if the company
would like to present the image of wholesomeness, it might use
a celebrity such as Ellen DeGeneres who has
the image of a nice, wholesome person. If the marketers would
like to portray a wilder image, they might use
a celebrity such as Justin Bieber who is perceived in a much
different light. This also applies to non-celebrity
people who might present an image of a rough, tough figure or
maybe a more intellectual type. This could
involve clothing, physical stature, personality, or a host of other
characteristics that project this type of image.
Marketers select celebrity endorsers and actors/actresses in their
marketing campaigns carefully because
their brand image and perception can be quickly confirmed or
completely changed with the use of different
people who hold different social stereotypes. The keys to
selecting the person to appear in the marketing
effort (e.g., whether it is a celebrity or not) are listed below:
the target
market,
target market,
being advertised,
ly be able to influence the target
market,
identified by the company, and
In order to be an effective partnership, the social stereotype
must fit within the overall brand image that the
company would like to present as well as align with the
product/service features and benefits. Using
celebrities in advertising costs companies hundreds of
thousands of dollars, thus the image and perception
need to be aligned perfectly. If done correctly, the use of
celebrities can increase a brand’s worth
exponentially.
Another related area is that of neuromarketing, which is the
science of human decision-making. Neuroscience
is actually exiting hospitals and reaching into the marketing
discipline. This science suggests that consumers
do not know what they want, so asking them is not an effective
method for understanding consumer buying
behavior. Neuromarketing as a discipline moves beyond this and
attempts to understand how marketing
impacts people by observing and interpreting their emotional
reactions. This is then tied to the fact that
emotional processes in the brain are related to consumer
behavior and ultimately consumer buying behavior.
The marketer’s ability to understand their target market’s
perception, learning, and memory will enable the
marketer to compile and present the most effective marketing
campaigns. Patrick Renvoise, presents some
interesting examples of how neuromarketing can actually
enhance advertising and marketing efforts (TEDx
Talks, 2013). The video link is located in the Suggested
Readings for this unit.
References
Cook, K. (2016, September 26). 12 ads that prove nostalgia is a
powerful marketing tactic [Blog post].
Retrieved from https://blog.hubspot.com/marketing/examples-
nostalgia-marketing-
ads#sm.00001vgs39u582ejdwaof5b0yrwx5
TED. (2012, July 19). TEDTalks: Joseph Pine—What do
consumers really want? [Video file]. Retrieved from
https://libraryresources.columbiasouthern.edu/login?auth=CAS
&url=http://fod.infobase.com/PortalPla
ylists.aspx?wID=273866&xtid=48396
MAR 3211, Consumer Behavior 5
UNIT x STUDY GUIDE
Title
TEDx Talks. (2013, May 20). Is there a buy button inside the
brain: Patrick Renvoise at TEDxBend [Video
file]. Retrieved from
https://www.youtube.com/watch?v=_rKceOe-Jr0
Suggested Reading
In order to access the following resources, click the links
below.
In the following article, researchers explored earned entitlement
and whether it affected the perception of
fairness in the study of participants.
Feng, C., Luo, Y., Gu, R., Broster, L. S., Shen, X., Tian, T.,
Krueger, F. (2013). The flexible fairness: Equality,
earned entitlement, and self-interest. Plos ONE, 8(9), 1.
Retrieved from
https://libraryresources.columbiasouthern.edu/login?url=http://s
earch.ebscohost.com/login.aspx?direc
t=true&db=a9h&AN=90530789&site=ehost-live&scope=site
The following article examines electronic word of mouth
(eWOM) and how it supports social interaction and
helps consumers learn about products and services found on the
Internet.
Lu, X., Li, Y., Zhang, Z., & Rai, B. (2014). Consumer learning
embedded in electronic word of mouth. Journal
of Electronic Commerce Research, 15(4), 300–316. Retrieved
from
https://libraryresources.columbiasouthern.edu/login?url=http://s
earch.proquest.com.libraryresources.c
olumbiasouthern.edu/docview/1629950036?accountid=33337
In the following video, Gilbert explains delayed gratification
and how consumers think that more is better and
that sooner is better than later.
TED. (2012, March 15). Illusions of temporal perspective
(Segment 8 of 13) [Video file]. Retrieved from
https://libraryresources.columbiasouthern.edu/login?auth=CAS
&url=http://fod.infobase.com/PortalPla
ylists.aspx?wID=273866&xtid=48137&loid=132977
Click here to access the transcript for the video above.
In the following video, Renvoise explains the neuroscience of
marketing and how marketers are working to
access the buy button in the human brain.
TEDx Talks. (2013, May 20). Is there a buy button inside the
brain: Patrick Renvoise at TEDxBend [Video
file]. Retrieved from
https://www.youtube.com/watch?v=_rKceOe-Jr0
Click here to access the transcript for the video above.
https://libraryresources.columbiasouthern.edu/login?url=http://s
earch.ebscohost.com/login.aspx?direct=true&db=a9h&AN=9053
0789&site=ehost-live&scope=site
https://libraryresources.columbiasouthern.edu/login?url=http://s
earch.ebscohost.com/login.aspx?direct=true&db=a9h&AN=9053
0789&site=ehost-live&scope=site
https://libraryresources.columbiasouthern.edu/login?url=http://s
earch.proquest.com.libraryresources.columbiasouthern.edu/docv
iew/1629950036?accountid=33337
https://libraryresources.columbiasouthern.edu/login?url=http://s
earch.proquest.com.libraryresources.columbiasouthern.edu/docv
iew/1629950036?accountid=33337
https://libraryresources.columbiasouthern.edu/login?auth=CAS
&url=http://fod.infobase.com/PortalPlaylists.aspx?wID=273866
&xtid=48137&loid=132977
https://libraryresources.columbiasouthern.edu/login?auth=CAS
&url=http://fod.infobase.com/PortalPlaylists.aspx?wID=273866
&xtid=48137&loid=132977
https://online.columbiasouthern.edu/bbcswebdav/xid-
68746837_1
https://www.youtube.com/watch?v=_rKceOe-Jr0
https://online.columbiasouthern.edu/bbcswebdav/xid-
68746832_1
Business Review Q3 2014 9www.philadelphiafed.org
BY LEONARD NAKAMURA
I
Leonard Nakamura is a vice president and economist at the
Federal
Reserve Bank of Philadelphia. The views expressed in this
article
are not necessarily those of the Federal Reserve. This article
and
other Philadelphia Fed reports and research are available at
www.
philadelphiafed.org/research-and-data/publications.
Hidden Value:
How Consumer Learning Boosts Output
This disconnect has implications
for policy. Economists are more famil-
iar with how learning makes us better
workers by increasing our productiv-
ity, typically reflected economywide
in higher inflation-adjusted wages
and output per capita. However, how
learning makes us better consumers
is less likely to be captured by official
measures of consumption and out-
put. To the extent that these statistics
might be imprecise, economists are
liable to be led astray in assessing the
economy’s successes and failures, and
policymakers may be misled in decid-
ing which actions to adopt.
But how can one measure the im-
pact of consumer learning on the well-
being of households? First, we need to
explore just how learning affects value.
Then we will turn to theories of con-
sumer preferences and behavior that
take learning into account. They may
point us toward more accurate ways to
estimate inflation and output growth
than measuring prices directly.
MORE BENEFIT PER
DOLLAR SPENT
In this era of rapid innovation
and creativity, consuming so many
new products typically involves learn-
ing both before and after we purchase
them for the first time. Acquiring in-
formation about a product we haven’t
bought before is so automatic that we
may hardly notice it as an economic
phenomenon. Indeed, if the product
is novel, we must acquire at least some
information: First we find out that the
product exists and then what its char-
acteristics and performance are like.
This information acquisition in turn
lowers the risk associated with any
given purchase and, on average, will
raise the amount of pleasure or use we
get from it.
Consider all the information avail-
able to help us decide to see a movie.
We can look at trailers in the theater
or online; we can read reviews and
compare the number of stars the movie
gets from critics or fellow moviegoers;
and we can ask our friends. Similarly,
when deciding on a restaurant, we can
consult online sources like Yelp, Zagat,
or Chowhound; we can examine the
menu and prices; we can read a review
in the local paper; and we can listen
to our friends’ suggestions. All this
information-gathering raises the prob-
ability that we will enjoy the movie or
restaurant more than if we had chosen
blindly. When we take the time to
find out more information, we are able
to select products most suited to our
tastes and will generally experience
higher satisfaction per dollar spent,
given a fixed menu of choices, than we
otherwise would. Raising our satisfac-
tion per dollar may also make us more
willing to buy more products within
that category.
A second layer of benefits occurs
through use: Using the features on
my e-mail or word processing program
becomes second nature as, one by
one, I try out new tasks. This form of
learning-by-doing raises the product’s
value in later uses; once I know that
a feature exists and how to use it, I
can more quickly find it and use it.
As I learn to use my smartphone by
phones. Ipads. Wikipedia. Google Maps. Yelp. TripAdvisor.
New digital devices, applications, and services offer advice
and information at every turn. The technology around
us changes fast, so we are continually learning how best
to use it. This increased pace of learning enhances the
satisfaction we gain from what we buy and increases its value to
us over
time, even though it may cost the same — or less. However,
this effect
of consumer learning on value makes inflation and output
growth more
difficult to measure. As a result, current statistics may be
undervaluing
household purchasing power as well as how much our economy
produces, leading us to believe that our living standards are
declining
when they are not.
10 Q3 2014 Business Review www.philadelphiafed.org
making a call or finding a destina-
tion or taking a picture or watching a
video clip, using it becomes faster and
more successful.1 Moreover, with cheap
memory and computing power, we can
customize the devices and applications
to our needs. Using an application can
also result in a valuable history to tap
later: The letters I have written and
the PowerPoint slides I have produced
in the past may have pieces that I can
insert into new e-mails and presenta-
tions. In many cases, the application
has the ability to learn our habits and
guide us to better choices, sometimes
using the preferences of other users
who make choices similar to ours. For
example, Netflix looks at our past
movie choices to suggest new ones.
What is economically significant
about this form of learning is that
the product is the same, but we value
it more. Yet, standard measures of
economic output miss this increase
in value because the product appears
unchanged. As a result, statistics
measuring overall consumption may
be too low.2
For example, let’s consider how we
value an Internet connection. Entre-
preneurs keep developing search en-
gines, aggregators, instructional sites,
and various applications that make
our use of the Internet more efficient.
Plus, smartphones and tablets make it
easier to connect whenever we want
and wherever we are. All of this infor-
mation allows the smart consumer to
choose movies, TV shows, restaurants,
and a myriad of consumer products
and services that are more to our lik-
ing. The cost of the better information
that helps us make these better choices
has fallen, allowing us to derive greater
satisfaction from what we buy. Thus,
our knowledge of the Internet enhanc-
es the value of — and spurs the devel-
opment of — new ways to reach it.
Yet, so much of the content on the
Internet — videos, TV shows, music,
and social media — is available at no
extra cost. So, as we learn about the
Internet, we use our connection to
it more intensively, but we don’t pay
more. The Internet connection itself
is unchanged; what is changed is the
content and interactions it gives us
access to. Because if the satisfaction
we gain from the Internet connec-
tion is greater, we would be willing to
pay more for it. But if the market for
Internet connections is competitive,
we don’t have to: Competition prevents
providers from charging more as Inter-
net offerings expand, so we get more
value for the same amount of money.
But does this improvement in our
welfare show up in measures of real
consumption and growth? Typically
not. The monthly fee we pay to the In-
ternet service provider this year is buy-
ing more for us than the monthly fee
we paid five years ago. If the fee has
gone up, we measure this as pure infla-
tion: The price of “Internet services
and electronic information providers”
in the U.S. Bureau of Labor Statistics’
consumer price index (U.S. CPI) has
gone up at an annual rate of 1 percent.
But if the satisfaction we have gained
as we use the Internet more intensively
has gone up, then this is not the right
measure of our inflation rate, since the
quality of the service has risen and we
get more for the price.
Similarly, our cable TV bills (as
measured in the U.S. CPI index of “ca-
ble and satellite TV and radio”) have
risen at an average annual rate of just
over 2 percent over the past five years.
Does this rate fully reflect the greater
value we derive from cable service?
When we first use cable TV, we may
know only a few channels. Over time,
as we channel-surf and learn more
about the content shown on different
channels, we may become attached to
three or four channels we didn’t know
about before. As a result, access to
cable TV becomes more valuable to us.
But how can we measure that value?
MEASURING THE VALUE
OF INFORMATION
Consider a traveler planning to
go to a foreign city for the first time.
Initially, the traveler sees that hotels A
and B are equally priced and have sim-
ilar luxury levels as measured by that
country’s rating scheme. But the In-
ternet allows the traveler to see reviews
from other travelers, detailed maps of
the hotels’ locations, and lists of the
hotels’ amenities. Let’s say that the
more knowledgeable concierge at hotel
B is worth $10 a day to the traveler.
Learning about the concierge over the
Internet makes the traveler better off
by $5: In the absence of this informa-
tion, the traveler would have chosen
randomly between the two hotels and
would have gotten the good concierge
half the time, for an expected value of
$5. But with the information obtained
from the Internet, the traveler gets
1 Although this article does not explore the
notion, it must be admitted that there is a
countervailing truth: Our existing knowledge
may become outmoded at a faster rate as new
technologies race at us. This depreciation of
our knowledge is a cost of rapid technological
progress but is also something we have difficulty
measuring.
2 Another interesting implication of consumer
learning is that it may be one reason that so-
called early adopters are willing to pay a higher
initial price for the latest technology. Even
though they realize the price will drop later,
they know they will become better off as they
learn more about the product.
Does this improvement in our welfare show up
in measures of real consumption and growth?
Typically not.
Business Review Q3 2014 11www.philadelphiafed.org
the good concierge all the time, for an
expected value of $10. With better
knowledge, the traveler gets more satis-
faction from the same set of choices at
the same price. Here we can quantify
the improvement as $5. The traveler
knows how much to value the con-
cierge and would have been willing to
pay $10 more to stay at that hotel than
at the other.
But measuring this value may
require new methods. Statistical
agencies charged with measuring
prices usually simply ask the hotels
what prices they charge. Instead, an
agency might have to survey consum-
ers to elicit these evaluations. Alter-
natively, Internet-savvy hotel opera-
tors or tourist organizations could do
experiments to elicit the extent to
which customers are willing to pay
more for superior information.
The effect of learning on value
isn’t limited to technology. For in-
stance, learning to play an instrument
often deepens our understanding and
enjoyment of music. The information
we gain isn’t only steering us to the
music we prefer; it also deepens our
appreciation of the music. We make
a human capital investment that im-
proves our ability to consume, similar
to a long-term investment in a home or
an education that makes us better able
to earn a living. Here we might wish
to quantify the investment in infor-
mation that consumers make in order
to quantify the value of the informa-
tion, in the same way that we might
measure a consumer’s investment in a
home or a car.
To analyze consumption when
learning is occurring, let’s first explore
some underlying theory regarding esti-
mating changes in prices and output.
This theory will allow us to construct
a stable “utility function,” a method of
representing consumer preferences that
permits us to assume that there are
bundles of products and services across
which a consumer is indifferent: He
or she would be just as happy with one
bundle as another. It is this assumption
— that we can find bundles of products
across which consumers are indifferent
— that economists rely on to estimate
inflation and economic growth. We
will then discuss how behavior is dif-
ferent in situations in which learning
is occurring and how these changes in
behavior influence pricing and welfare.
GENERALIZED UTILITY
FUNCTION THEORY
In a classic 1977 article, “De Gus-
tibus Non Est Disputandum,”3 George
Stigler and Gary Becker argue that
human tastes are fundamentally the
same; they “neither change capri-
ciously nor differ importantly between
people.” Where it appears that tastes
vary, Stigler and Becker widen the
notion of consumer preferences from
specific goods and services to broad,
unchanging categories that they call
commodity objects of choice. These
stable preferences have goods and ser-
vices as inputs, but also the consumer’s
time and human capital such as educa-
tion and the acquisition of informa-
tion. Thus, individuals can actively
shape the satisfaction they derive from
specific goods and services by obtain-
ing knowledge. But Stigler and Becker
point out that this broader way of look-
ing at preferences changes the nature
of income and prices.
Stable preferences are key to
measuring inflation. Ordinarily, if
we can identify bundles of consumer
goods and services about which a
consumer is indifferent in two succes-
sive years, this starts us on the way to
estimating inflation and output growth
between the two years. We first look
at what the consumer actually bought
in the first year and then ask how
much that exact set of goods and ser-
vices would cost in the second year.
This provides us with a measure of the
rate of inflation the consumer faces.
Alternatively, we can measure the set
of goods and services the consumer
actually bought in the second year and
ask how much that set would have cost
in the first year. This second measure
of inflation is typically lower than the
first one.4 We can use either measure,
or we can average the two.
If we believe that consumers have
stable preferences over these prod-
ucts — that is, more or less unchang-
ing utility functions — then we can
say that if consumers’ incomes in the
first year rise at the rate of inflation,
consumers could afford to buy approxi-
mately the same goods and services
they had bought the year before and
are just as well off. We then can
say that their real incomes haven’t
changed. If their incomes are 2 per-
cent higher than the rate of inflation,
we say that their real incomes have
risen by 2 percent, because they can
buy 2 percent more than they could
the year before. But if consumers’ util-
ity functions change over time, this
claim might become dubious: If last
year I liked fish and bought a lot of it,
and this year I don’t like it as much
but still buy a lot because it is cheap,
then I may be worse off, though I am
buying the same amount. To be sure,
our preferences may fluctuate; I may
prefer fish one year, meat another. But
these back-and-forth changes may not
matter to our overall measures if these
fluctuations cancel out — for every
individual who likes fish less, another
likes it more. What Stigler and Becker
were concerned with were systematic
changes in taste.
3 Translatable as “There’s No Arguing About
Taste.”
4 The bundle bought in the second year is
typically cheaper because goods and services
increase in price at different rates, and consum-
ers tend to buy less of the more expensive goods.
So the second year’s purchases will typically
have fewer of the goods whose prices rose more
rapidly.
12 Q3 2014 Business Review www.philadelphiafed.org
The generalized utility func-
tion is stable. To demonstrate how
underlying preferences may be seen to
be stable, Stigler and Becker cite what
appears to be an example of a changing
utility function: addiction — the phe-
nomenon that “smoking of cigarettes
… or close contact with some person
over an appreciable period of time
often increases the desire (craving) for
these goods or persons.” But if we re-
formulate the specific product cigarettes
into the broader commodity smoking,
or close contact into the commodity lov-
ing, perhaps we can understand them
as stable human behaviors.5
Citing Alfred Marshall’s example
of music — “The more good music
a man hears, the stronger is his taste
for it likely to become.” — Stigler and
Becker argue that an individual can
accumulate “consumption capital” in
music, so that, for instance, buying
tickets to a concert at one point in
time increases the satisfaction derived
from further consumption of music
later. Thus, just as workers can invest
in education to enhance their produc-
tivity at making objects or providing
services, so can consumers invest in
education to enhance their enjoyment
of certain goods and services. This in-
creasing satisfaction can be understood
as “rational addiction,” in that consum-
ers can understand and predict ratio-
nally how their consumption in one
period may affect their consumption in
future periods. Thus, I can decide not
to consume a drug that I know I will
enjoy this period but that will induce a
craving in future periods, when I will
enjoy it less. Another implication of
this perspective is that when we are
young, we may not like a certain type
of music very much initially, but we
may realize that we will gain human
capital that will make the early invest-
ment worthwhile in retrospect.
Note that a given act of consump-
tion — for example, listening to or
playing music — may have both an
aspect of direct consumption (our
current enjoyment) and an aspect of
investment (how our current con-
sumption affects our future enjoy-
ment). Both aspects increase our
current willingness to pay for the item.
This makes for interesting dynam-
ics over time. As we age, the period
over which our investment will pay
off shortens, but our enjoyment rises
because of past learning. Eventually,
though, our rate of learning and the
rate of increase in enjoyment slow
down, so we are less willing to pay
because the investment value is falling,
even though our direct enjoyment is
still increasing.
As we become more willing to
pay for something, do we have to pay
a higher price? A drug dealer may
offer the first dose of a drug for free,
in hopes the customer becomes ad-
dicted. This depends on there being
some likelihood that the person offered
the free drug will remain a customer
of the dealer, so that the addiction
can be exploited. If the producer has
a monopoly on the good whose value
to us has increased, then the price
may rise over time. This may be why
pharmaceuticals under patent typically
rise in price faster than inflation. Even
absent monopoly, learning is one of the
main reasons why customers may find
it difficult to switch from one supplier
to another.6
MEASURING INFLATION
AND OUTPUT
There are two ways in which we
can be better off economically: We can
have more products and services, or we
can make better use of what we already
have. It is easier, however, to measure
quantity than quality. To think this
through, consider how we currently
measure output and inflation.
Suppose I spent $20,000 on
consumer goods and services in 2013
and $21,000 in 2014. Is my well-being
higher in 2014 than it was in 2013?
The test that economists normally use
is to ask whether I could have bought
the same goods and services in 2014
as I bought in 2013. If so, I must be at
least as well off, because I could have
bought the same goods but didn’t.
Therefore, I must have preferred the
goods I did buy to the goods I didn’t,
since I can freely choose what I buy.
So I strictly prefer what I consumed
this year to what I consumed last year.
However, as we have seen, when
consumers learn about a product, it
5 In another example they explore, Stigler and
Becker view advertising as a means of providing
information to consumers that improves their
perceived benefit from the product being ad-
vertised. In this case, the maker of the product
provides information that changes the value of
the commodity consumed. They also discuss
fads and fashions and the role of culture and
traditions in the formation of tastes. See my
Business Review article on advertising for further
discussion.
Just as workers can invest in education to
enhance their productivity at making objects or
providing services, so can consumers invest
in education to enhance their enjoyment of
certain goods and services.
6 As we use products and services, our learning
may result in what are known as increased
switching costs. See Paul Klemperer (1995),
Carl Shapiro and Hal Varian (1999), and Luis
Cabral (2014), among others.
Business Review Q3 2014 13www.philadelphiafed.org
can provide more satisfaction than
it did initially. In this case, we may
want to consider my consumption as
having increased, even though what I
consumed did not change physically.
But if the good or service in question
is unchanged, how do we measure the
increased satisfaction it offers, that is,
its increased utility? There are at least
two routes that we might take.
Consumer investment in
consumption. One view is that in
learning about, say, music, consumers
are investing by directly raising the sat-
isfaction they receive from music. In
principle, an investment in consump-
tion is no different from an investment
in durable consumer goods, such as
cars and refrigerators, or in real estate,
such as a single-family home. Any in-
vestment is expected to return value to
the investor — either in cash or well-
being — over an extended period.
If we are learning about a tech-
nology that we expect will be around
for a long time, then our learning may
be valuable for a long time. Just as an
investment in understanding music is
likely to bear fruit over an entire life-
time, so may an investment in touch-
typing, which enhances the speed and
accuracy with which we can write e-
mails and Internet posts. Even though
the specific items we purchase — PCs,
tablets, smartphones — may last only
a few years, touch-typing is valuable
in using all of those products and may
enhance our ability to communicate
over many years.
So to measure the increased satis-
faction gained from such a consump-
tion investment, we want to measure
both the money and the time invested.
Then we want to estimate the rate of
return on those investments. Because
we need to know over what period of
time the investment will create returns
and how much consumers value those
returns, we have to survey consumers.
Willingness to pay. Alternatively,
we can attempt to directly measure
how the consumer’s willingness to
pay has changed. For example, if the
price of a good rises and the consumer
consumes as much of that good as she
did previously, or if the price remains
the same and the consumer consumes
more of the good, then we may be able
to measure an increase in the consum-
er’s willingness to pay.
Consider pharmaceuticals. Sup-
pose the efficacy of a drug improves
over time as doctors and patients
share information about its effects
and as treatment regimens are fine-
tuned accordingly. We may be able to
directly measure the drug’s increased
value to both doctor and patient as
a result of this social learning. A
similar case can be made for medical
procedures. An interesting possibil-
ity is that a given intervention — for
example, use of a checklist in anes-
thesiology or surgery — may result
in a widespread improvement in the
quality of medical care.7 Again, as
the intervention becomes widely ad-
opted, we may be able to measure the
joint value of this social learning as
the quality of a variety of treatments
(different surgeries, say) improves.
CONCLUSION
Does measuring the benefits —
and the costs — of consumer learning
matter, particularly if they are difficult
to measure accurately? Even if econo-
mists cannot put numbers on them, it
is important to understand the limits
of what can be measured. If we cannot
measure the improvement in our well-
being from learning about products,
then we underestimate our progress as
consumers, and we overestimate both
the rate of inflation and the increase
in income necessary to keep our wel-
fare constant. We may think that liv-
ing standards are falling when they are,
in fact, rising. After all, when we dis-
cuss how we might raise productivity
or consumer welfare, we typically rely
on our existing measures of output and
inflation. But to the extent that we
think we might be getting this measure
wrong, we might decide to temper or
slant our objectives. For example, how
we think of price stability is tempered
by beliefs that our inflation measures
are likely subject to a measurement
bias, and we have a rough idea of the
size of that measurement bias. As a
consequence, a small but positive in-
flation rate may be viewed as achieving
price stability.
But it would clearly be desirable
if economic statistics measured output
and inflation more accurately. The
report of the Commission on the Mea-
surement of Economic Performance
and Social Progress seeks to move na-
tional statistical measures closer to an
ideal measure of progress in national
well-being. The commission’s report
points out that policymakers and
others use these statistics to measure
economic success. To the extent that
current statistics are biased, policy-
makers are liable to be led astray.
Thus, it would be valuable to consider
how best to measure the impact of
education, learning, and information
on the well-being of households and to
incorporate these measurements into
our statistics. As new technology and
learning make measuring inflation
and output growth more difficult, we
may not be able to rely on direct price
measures; rather we may have to use
surveys or econometric methods to
estimate inflation and growth. BR
7 Atul Gawande, a surgeon and journalist, has
written about this in his book The Checklist
Manifesto.
8 See Stiglitz, Sen, and Fitoussi.
REFERENCES
www.philadelphiafed.org14 Q3 2014 Business Review
Cabral, Luis. “Dynamic Pricing in Custom-
er Markets with Switching Costs,” working
paper (April 2014), http://luiscabral.org//
economics/workingpapers/scostsApril2014.
pdf.
Gawande, Atul. The Checklist Manifesto.
New York: Metropolitan Books, 2009.
Klemperer, Paul. “Competition When
Consumers Have Switching Costs: An
Overview with Applications to Indus-
trial Organization, Macroeconomics, and
International Trade,” Review of Economic
Studies, 62 (1995), pp. 515-39.
Marshall, Alfred. Principles of Economics.
London: Macmillan, 1890.
Nakamura, Leonard. “Intangible Invest-
ment and National Income Account-
ing: Measuring a Scientific Revolution,”
Review of Income and Wealth, S1 (2010),
pp. 135-155.
Nakamura, Leonard. “Underestimating
Advertising: Innovation and Unpriced
Entertainment,” Federal Reserve Bank
of Philadelphia Business Review (Fourth
Quarter 2005).
Shapiro, Carl, and Hal R. Varian. Infor-
mation Rules. Boston: Harvard Business
School Press, 1999.
Stigler, George, and Gary S. Becker. “De
Gustibus Non Est Disputandum,” Ameri-
can Economic Review, 67 (1977), pp. 76-90.
Stiglitz, Joseph, Amartya Sen, and Jean-
Paul Fitoussi. Report of the Commission on
the Measurement of Economic Performance
and Social Progress (2009).
����������
��
���������� �� �
� �������
� �
���� ����
�� ������������ ���
������
��
���
�����������
32 KITCHEN & BATH DESIGN NEWS | APRIL 2011
www.KitchenBathDesign.com
Consumer Insights
Your customers are irrational.
Right, you might be thinking.
Tell me something I
don’t know. The good
news is, consumers
are irrational in
predictable ways,
and understanding
that can help your
business, from
marketing to setting
prices to offering
choices.
“…consumers
don’t in fact have a good handle on
their own preferences and the prices
they are willing to pay for different
goods and experiences,” writes Duke
University’s behavioral economist
Dan Ariely in his book, Predictably
Irrational.
It’s all relative. And we can
influence consumer perceptions
through relativity.
Ariely explains, “We don’t have
an internal value meter that tells us
how much things are worth. Rather,
we focus on the relative advantage of
one thing over another and estimate
value accordingly.”
So, a prospect may not know
how much a six-burner professional
range is worth, but will assume it
costs more than a four-burner range.
Most people don’t know what
they want unless they see it in
context. Consumers don’t know what
kind of cabinets they want until
they see a finely glazed finish on an
exotic wood grain, and compare it to
a white foil door.
Homeowners don’t know they
want a large shower with multiple
jets, a seat and a light until they
compare it to a stall with one
showerhead and no light. They don’t
understand the benefits of a quiet
vent until they hear it next to a
louder one.
PRICING CONTEXT
Our job is to create the context for
decision-making. Given three price
choices, most people will take the
middle one. So, decide what you
want to sell, and then offer a higher
priced and lower priced option.
Make your margins the best on the
middle one. If there are only two
options, people tend to choose the
least expensive.
Introducing a higher priced
option can generate more revenue.
Not that people generally buy the
highest priced item. But they will
often select the second highest.
A consultant found a restaurant
boosted revenue by creating a new,
expensive dish. People then began
buying the second most expensive
entree, which previously had been
passed over because it was the most
expensive.
Want to sell more $700 sinks? Be
sure you have ones that are $900.
Consumers like to make
decisions based on comparisons. And
they want to focus on things that
are easily comparable. Introducing a
decoy choice, Ariely explains, helps
them do that.
You show a client three kitchens,
all about the same price. One is
contemporary, the other two are
traditional. The two traditional
kitchens are very similar except one
has an island and one does not. The
‘decoy’ is the kitchen without the
island.
Consumers will approach the
decision this way, Ariely says. They
will dismiss the contemporary
kitchen because they have nothing
to compare it to. They will focus
on the two similar kitchens. And of
those two, clearly the one with the
island is the better choice. So you
have helped the consumer make a
choice. (This assumes, of course,
that you know the consumer wants
traditional.)
Providing comparisons is
especially important if you’re
introducing a new product. Say
you’re going to offer bidets. You
bring in one model at $550. Nothing
happens. But then you add an $800
model. Now, the first bidets begin
selling. Why? “Because people have
two models to choose from, they
could make an easier decision.
They are not making a decision in a
vacuum,” Ariely explains.
RELATIVITY & ANCHORS
Relativity works in another way,
too. People will drive across town
to save $7 on a $25 item, but will
not make the drive to save $7 on a
$455 purchase. It makes no rational
sense, since it’s the same amount of
money. But the $7 is relatively larger
to $25 versus $455. So clearly on a
larger ticket item, you have some
price flexibility.
Once people have committed to a
$75,000 kitchen, it’s relatively easy to
get them to decide on a $700 special
faucet. But if they are just replacing
a $200 faucet, they may be unlikely
to spend that much. The relative
additional cost of the faucet is small
in the context of a big project. But a
few dollars will make a difference if
it’s just a replacement.
How do consumers know
what a faucet costs? They learn
through manufacturers’ suggested
retail prices, ads and promotions.
Market prices themselves influence
consumers’ willingness to pay,
Ariely says. This sets the anchor by
which consumers judge prices in a
category.
Price tags are not necessarily
anchors, though, notes Ariely. If a
consumer sees a faucet for $1,500,
it only becomes a relevant anchor
if the consumer considers actually
buying a faucet at that price.
“From then on, we are willing
to accept a range of prices, but…
we always refer back to the original
anchor. The first anchor influences
not only the immediate buying
decision but many others that
follow,” Ariely stresses.
Understand the context in which
your client operates. Where have
they looked? What brands have
they considered? Where might their
anchors be?
Anchors can drive decisions
for years. Remembering what their
first kitchen cost will affect what
prospects are willing to pay. Find
out how recently your prospects
have done a kitchen or bath. What
pricing are they likely to have in
their minds as an anchor?
“Once a choice is made on how
we’re going to spend money, we tend
to repeat it over and over,” Ariely
writes.
So how is a new anchor set? By
creating a new experience, the old
anchor no longer applies. That’s how
Starbucks set a new anchor for the
price of coffee – by changing the
experience.
If a consumer goes to a big
box store and then a high-end
showroom, their anchors could
change because the experience is
so different. But if they go from one
big box store to another that offers
a similar experience, their anchors
will stay the same.
When it comes to pricing, one of
the biggest emotional hot buttons is
the word free. “Free gives us such an
emotional charge that we perceive
what is being offered as immensely
more valuable than it really is,”
Ariely observes.
For example, which is the better
choice – a free $10 gift certificate
or a $20 gift certificate for $7? Most
people choose the first option, even
though the second option provides
greater profit ($13 vs. $10).
A free dishwasher won’t get
people to come in and buy a kitchen.
But if they’re deciding between
you and someone else, the free
dishwasher will often sway them.
“Free” can encourage add-on
purchases, i.e. offer a free towel
bar if a bath customer buys a
group of accessories (paper holder,
toothbrush holder, tissue box, etc.).
Having a showroom seminar or
cooking demo? Be sure to say “Free!”
In-depth descriptions can
influence expectations, too.
Consider “a stainless steel six-burner
range” versus “a finely crafted,
heirloom-quality cooking appliance
created in the centuries old French
gourmand tradition.” Which creates
higher expectations?
“Marketing is all about providing
information that will heighten
someone’s anticipated and real
pleasure,” Ariely concludes.
Tips for Infl uencing Consumer Perceptions
Leslie Hart
Consumer Insights
www.kitchenbathdesign.com
Read past columns and
features and send us your
comments about this
article and others by
logging onto the
Kitchen & Bath Design
News Web site:
kit h i il t ’ illi t
Consumers are irrational in predictable ways, and
understanding that can help your business, from
marketing to setting prices to offering choices.
ConInsights KBD 0411.indd 32 3/21/11 12:51 PM
Reproducedwithpermissionofthecopyrightowner.Furtherreproduc
tionprohibitedwithoutpermission.
I'm going to talk about a very fundamental change that is going
on in the very fabric of the modern
economy.
And to talk about that, I'm going to go back to the beginning,
because in the beginning were
commodities.
Commodities are things that you grow in the ground, raise on
the ground or pull out of the ground:
basically, animal, mineral, vegetable.
And then you extract them out of the ground, and sell them on
the open marketplace.
Commodities were the basis of the agrarian economy that lasted
for millennia.
But then along came the industrial revolution, and then goods
became the predominant economic
offering, where we used commodities as a raw material to be
able to make or manufacture goods.
So, we moved from an agrarian economy to an industrial
economy.
Well, what then happened over the last 50 or 60 years, is that
goods have become commoditized.
Commoditized: where they're treated like a commodity, where
people don't care who makes them.
They just care about three things and three things only: price,
price and price.
Now, there's an antidote to commoditization, and that is
customization.
My first book was called "Mass Customization" -- it came up a
couple of times yesterday -- and how I
discovered this progression of economic value was realizing
that customizing a good automatically
turned it into a service, because it was done just for a particular
person, because it wasn't
inventoried, it was delivered on demand to that individual
person.
So, we moved from an industrial economy to a service-based
economy.
But over the past 10 or 20 years, what's happened is that
services are being commoditized as well.
Long-distance telephone service sold on price, price, price; fast-
food restaurants with all their value
pricing; and even the Internet is commoditizing not just goods,
but services as well.
What that means is that it's time to move to a new level of
economic value.
Time to go beyond the goods and the services, and use, in that
same heuristic, what happens when
you customize a service?
What happens when you design a service that is so appropriate
for a particular person -- that's
exactly what they need at this moment in time?
Then you can't help but make them go "wow"; you can't help but
turn it into a memorable event --
you can't help but turn it into an experience.
So we're shifting to an experience economy, where experiences
are becoming the predominant
economic offering.
Now most places that I talk to, when I talk about experience, I
talk about Disney -- the world's premier
experience-stager.
I talk about theme restaurants, and experiential retail, and
boutique hotels, and Las Vegas -- the
experience capital of the world.
But here, when you think about experiences, think about
Thomas Dolby and his group, playing music.
Think about meaningful places.
Think about drinking wine, about a journey to the Clock of the
Long Now.
Those are all experiences. Think about TED itself.
The experience capital in the world of conferences.
All of these are experiences.
Now, over the last several years I spent a lot of time in Europe,
and particularly in the Netherlands,
and whenever I talk about the experience economy there, I'm
always greeted at the end with one
particular question, almost invariably.
And the question isn't really so much a question as an
accusation.
And the Dutch, when they usually put it, it always starts with
the same two words.
You know the words I mean?
You Americans.
They say, you Americans.
You like your fantasy environments, your fake, your Disneyland
experiences.
They say, we Dutch, we like real, natural, authentic
experiences.
So much has that happened that I've developed a fairly praticed
response, which is: I point out that
first of all, you have to understand that there is no such thing as
an inauthentic experience.
Why? Because the experience happens inside of us.
It's our reaction to the events that are staged in front of us.
So, as long as we are in any sense authentic human beings, then
every experience we have is
authentic.
Now, there may be more or less natural or artificial stimuli for
the experience, but even that is a
matter of degree, not kind.
And there's no such thing as a 100 percent natural experience.
Even if you go for a walk in the proverbial woods, there is a
company that manufactured the car that
delivered you to the edge of the woods; there's a company that
manufactured the shoes that you
have to protect yourself from the ground of the woods.
There's a company that provides a cell phone service you have
in case you get lost in the woods.
Right? All of those are man-made, artificiality brought into the
woods by you, and by the very nature
of being there.
And then I always finish off by talking about -- the thing that
amazes me the most about this question,
particularly coming from the Dutch, is that the Netherlands is
every bit as manufactured as
Disneyland.
(Laughter) And the Dutch, they always go ...
and they realize, I'm right!
There isn't a square meter of ground in the entire country that
hasn't been reclaimed from the sea,
or otherwise moved, modified and manicured to look as if it had
always been there.
It's the only place you ever go for a walk in the woods and all
the trees are lined up in rows.
(Laughter) But nonetheless, not just the Dutch, but everyone has
this desire for the authentic.
And authenticity is therefore becoming the new consumer
sensibility -- the buying criteria by which
consumers are choosing who are they going to buy from, and
what they're going to buy.
Becoming the basis of the economy.
In fact, you can look at how each of these economies developed,
that each one has their own
business imperative, matched with a consumer sensibility.
We're the agrarian economy, and we're supplying commodities.
It's about supply and availability.
Getting the commodities to market.
With the industrial economy, it is about controlling costs --
getting the costs down as low as possible
so we can offer them to the masses.
With the service economy, it is about improving quality.
That has -- the whole quality movement has risen with the
service economy over the past 20 or 30
years.
And now, with the experience economy, it's about rendering
authenticity.
Rendering authenticity -- and the keyword is "rendering."
Right? Rendering, because you have to get
your consumers -- as business people -- to percieve your
offerings as authentic.
Because there is a basic paradox: no one can have an
inauthentic experience, but no business can
supply one.
Because all businesses are man-made objects; all business is
involved with money; all business is a
matter of using machinery, and all those things make something
inauthentic.
So, how do you render authenticity, is the question.
Are you rendering authenticity?
When you think about that, let me go back to what Lionel
Trilling, in his seminal book on authenticity,
"Sincerity and Authenticity" -- came out in 1960 -- points to as
the seminal point at which authenticity
entered the lexicon, if you will.
And that is, to no surprise, in Shakespeare, and in his play,
Hamlet.
And there is one part in this play, Hamlet, where the most fake
of all the characters in Hamlet,
Polonius, says something profoundly real.
At the end of a laundry list of advice he's giving to his son,
Laertes, he says this: And this above all: to
thine own self be true.
And it doth follow, as night the day, that thou canst not then be
false to any man.
And those three verses are the core of authenticity.
There are two dimensions to authenticity: one, being true to
yourself, which is very self-directed.
Two, is other-directed: being what you say you are to others.
And I don't know about you, but whenever I encounter two
dimensions, I immediately go, ahh, two-by-
two!
All right? Anybody else like that, no?
Well, if you think about that, you do, in fact, get a two-by-two.
Where, on one dimension it's a matter of being true to yourself.
As businesses, are the economic offerings you are providing --
are they true to themselves?
And the other dimension is: are they what they say they are to
others?
If not, you have, "is not true to itself," and "is not what it says
it is," yielding a two-by-two matrix.
b l u e p r i n t i CONSUMER PERCEPTIONSHQW DQPerception.docx

More Related Content

Similar to b l u e p r i n t i CONSUMER PERCEPTIONSHQW DQPerception.docx

Kim Essex - Being Transparent with the Consumer: The Language of Trust
Kim Essex - Being Transparent with the Consumer: The Language of TrustKim Essex - Being Transparent with the Consumer: The Language of Trust
Kim Essex - Being Transparent with the Consumer: The Language of TrustJohn Blue
 
WHAT YOU NEED TO KNOW ABOUT NATURAL PET FOOD
WHAT YOU NEED TO KNOW ABOUT NATURAL PET FOODWHAT YOU NEED TO KNOW ABOUT NATURAL PET FOOD
WHAT YOU NEED TO KNOW ABOUT NATURAL PET FOODShirish Ghimire
 
Stop Playing Not to Lose and Start Playing to Win
Stop Playing Not to Lose and Start Playing to WinStop Playing Not to Lose and Start Playing to Win
Stop Playing Not to Lose and Start Playing to WinCMACharlie
 
The ethical food movement: What does it mean for the role of science and scie...
The ethical food movement: What does it mean for the role of science and scie...The ethical food movement: What does it mean for the role of science and scie...
The ethical food movement: What does it mean for the role of science and scie...Harm Kiezebrink
 
Why is Animal News Important in the UK_FarmWeek
Why is Animal News Important in the UK_FarmWeekWhy is Animal News Important in the UK_FarmWeek
Why is Animal News Important in the UK_FarmWeekFarm Week
 
LHam_Trendspotting_writing sample
LHam_Trendspotting_writing sampleLHam_Trendspotting_writing sample
LHam_Trendspotting_writing sampleLenora Ham
 
Effects of Diet on Canine Behavior Consumer Perception versus Scientific Rese...
Effects of Diet on Canine Behavior Consumer Perception versus Scientific Rese...Effects of Diet on Canine Behavior Consumer Perception versus Scientific Rese...
Effects of Diet on Canine Behavior Consumer Perception versus Scientific Rese...Heather McEwan
 
Recipe cards task 4 pro forma
Recipe cards task 4 pro formaRecipe cards task 4 pro forma
Recipe cards task 4 pro formaPJG123
 
Kim Essex - How do we Bridge the Communications Gap
Kim Essex - How do we Bridge the Communications GapKim Essex - How do we Bridge the Communications Gap
Kim Essex - How do we Bridge the Communications GapJohn Blue
 
Ethical Food
Ethical FoodEthical Food
Ethical FoodJohn Blue
 
Dr. Lesley Mitchell - Connecting with consumers: Animal welfare in the sustai...
Dr. Lesley Mitchell - Connecting with consumers: Animal welfare in the sustai...Dr. Lesley Mitchell - Connecting with consumers: Animal welfare in the sustai...
Dr. Lesley Mitchell - Connecting with consumers: Animal welfare in the sustai...John Blue
 
Food safety in informal markets in developing countries: Lessons from researc...
Food safety in informal markets in developing countries: Lessons from researc...Food safety in informal markets in developing countries: Lessons from researc...
Food safety in informal markets in developing countries: Lessons from researc...Tezira Lore
 
2021 Food Safety Speech to Costco - from Jack in the Box to the present
2021 Food Safety Speech to Costco - from Jack in the Box to the present 2021 Food Safety Speech to Costco - from Jack in the Box to the present
2021 Food Safety Speech to Costco - from Jack in the Box to the present BillMarler1
 
Final Human Benefits September Pet Ins Month
Final Human Benefits September Pet Ins MonthFinal Human Benefits September Pet Ins Month
Final Human Benefits September Pet Ins MonthLoran Hickton
 
[Weber Shandwick] Asia pacific food forward trends report II
[Weber Shandwick] Asia pacific food forward trends report II[Weber Shandwick] Asia pacific food forward trends report II
[Weber Shandwick] Asia pacific food forward trends report IIWeber Shandwick Korea
 
Food Forward Trends Report 2015 - Asia Pacific
Food Forward Trends Report 2015 - Asia PacificFood Forward Trends Report 2015 - Asia Pacific
Food Forward Trends Report 2015 - Asia Pacificwsaustralia
 
Ms. Stacey Stevens - Crisis Communications Update: Messages and Channels
Ms. Stacey Stevens - Crisis Communications Update: Messages and ChannelsMs. Stacey Stevens - Crisis Communications Update: Messages and Channels
Ms. Stacey Stevens - Crisis Communications Update: Messages and ChannelsJohn Blue
 
Food: a System in Crisis
Food: a System in CrisisFood: a System in Crisis
Food: a System in CrisisGabriela Baron
 

Similar to b l u e p r i n t i CONSUMER PERCEPTIONSHQW DQPerception.docx (20)

Kim Essex - Being Transparent with the Consumer: The Language of Trust
Kim Essex - Being Transparent with the Consumer: The Language of TrustKim Essex - Being Transparent with the Consumer: The Language of Trust
Kim Essex - Being Transparent with the Consumer: The Language of Trust
 
WHAT YOU NEED TO KNOW ABOUT NATURAL PET FOOD
WHAT YOU NEED TO KNOW ABOUT NATURAL PET FOODWHAT YOU NEED TO KNOW ABOUT NATURAL PET FOOD
WHAT YOU NEED TO KNOW ABOUT NATURAL PET FOOD
 
Stop Playing Not to Lose and Start Playing to Win
Stop Playing Not to Lose and Start Playing to WinStop Playing Not to Lose and Start Playing to Win
Stop Playing Not to Lose and Start Playing to Win
 
The ethical food movement: What does it mean for the role of science and scie...
The ethical food movement: What does it mean for the role of science and scie...The ethical food movement: What does it mean for the role of science and scie...
The ethical food movement: What does it mean for the role of science and scie...
 
Why is Animal News Important in the UK_FarmWeek
Why is Animal News Important in the UK_FarmWeekWhy is Animal News Important in the UK_FarmWeek
Why is Animal News Important in the UK_FarmWeek
 
LHam_Trendspotting_writing sample
LHam_Trendspotting_writing sampleLHam_Trendspotting_writing sample
LHam_Trendspotting_writing sample
 
Effects of Diet on Canine Behavior Consumer Perception versus Scientific Rese...
Effects of Diet on Canine Behavior Consumer Perception versus Scientific Rese...Effects of Diet on Canine Behavior Consumer Perception versus Scientific Rese...
Effects of Diet on Canine Behavior Consumer Perception versus Scientific Rese...
 
Recipe cards task 4 pro forma
Recipe cards task 4 pro formaRecipe cards task 4 pro forma
Recipe cards task 4 pro forma
 
Kim Essex - How do we Bridge the Communications Gap
Kim Essex - How do we Bridge the Communications GapKim Essex - How do we Bridge the Communications Gap
Kim Essex - How do we Bridge the Communications Gap
 
Ethical Food
Ethical FoodEthical Food
Ethical Food
 
Pet food packaging report
Pet food packaging reportPet food packaging report
Pet food packaging report
 
Dr. Lesley Mitchell - Connecting with consumers: Animal welfare in the sustai...
Dr. Lesley Mitchell - Connecting with consumers: Animal welfare in the sustai...Dr. Lesley Mitchell - Connecting with consumers: Animal welfare in the sustai...
Dr. Lesley Mitchell - Connecting with consumers: Animal welfare in the sustai...
 
Food safety in informal markets in developing countries: Lessons from researc...
Food safety in informal markets in developing countries: Lessons from researc...Food safety in informal markets in developing countries: Lessons from researc...
Food safety in informal markets in developing countries: Lessons from researc...
 
2021 Food Safety Speech to Costco - from Jack in the Box to the present
2021 Food Safety Speech to Costco - from Jack in the Box to the present 2021 Food Safety Speech to Costco - from Jack in the Box to the present
2021 Food Safety Speech to Costco - from Jack in the Box to the present
 
Final Human Benefits September Pet Ins Month
Final Human Benefits September Pet Ins MonthFinal Human Benefits September Pet Ins Month
Final Human Benefits September Pet Ins Month
 
[Weber Shandwick] Asia pacific food forward trends report II
[Weber Shandwick] Asia pacific food forward trends report II[Weber Shandwick] Asia pacific food forward trends report II
[Weber Shandwick] Asia pacific food forward trends report II
 
Food Forward Trends Report 2015 - Asia Pacific
Food Forward Trends Report 2015 - Asia PacificFood Forward Trends Report 2015 - Asia Pacific
Food Forward Trends Report 2015 - Asia Pacific
 
Ms. Stacey Stevens - Crisis Communications Update: Messages and Channels
Ms. Stacey Stevens - Crisis Communications Update: Messages and ChannelsMs. Stacey Stevens - Crisis Communications Update: Messages and Channels
Ms. Stacey Stevens - Crisis Communications Update: Messages and Channels
 
Food: a System in Crisis
Food: a System in CrisisFood: a System in Crisis
Food: a System in Crisis
 
Feed of the future?
Feed of the future?Feed of the future?
Feed of the future?
 

More from celenarouzie

Attaining ExpertiseYou are tr.docx
Attaining ExpertiseYou are tr.docxAttaining ExpertiseYou are tr.docx
Attaining ExpertiseYou are tr.docxcelenarouzie
 
attachment Chloe” is a example of the whole packet. Please follow t.docx
attachment Chloe” is a example of the whole packet. Please follow t.docxattachment Chloe” is a example of the whole packet. Please follow t.docx
attachment Chloe” is a example of the whole packet. Please follow t.docxcelenarouzie
 
AttachmentFor this discussionUse Ericksons theoretic.docx
AttachmentFor this discussionUse Ericksons theoretic.docxAttachmentFor this discussionUse Ericksons theoretic.docx
AttachmentFor this discussionUse Ericksons theoretic.docxcelenarouzie
 
Attachment Programs and Families Working Together Learn.docx
Attachment Programs and Families Working Together Learn.docxAttachment Programs and Families Working Together Learn.docx
Attachment Programs and Families Working Together Learn.docxcelenarouzie
 
Attachment and Emotional Development in InfancyThe purpose o.docx
Attachment and Emotional Development in InfancyThe purpose o.docxAttachment and Emotional Development in InfancyThe purpose o.docx
Attachment and Emotional Development in InfancyThe purpose o.docxcelenarouzie
 
ATTACHEMENT from 7.1 and 7.2 Go back to the Powerpoint for thi.docx
ATTACHEMENT from 7.1 and 7.2 Go back to the Powerpoint for thi.docxATTACHEMENT from 7.1 and 7.2 Go back to the Powerpoint for thi.docx
ATTACHEMENT from 7.1 and 7.2 Go back to the Powerpoint for thi.docxcelenarouzie
 
Attached the dataset Kaggle has hosted a data science competitio.docx
Attached the dataset Kaggle has hosted a data science competitio.docxAttached the dataset Kaggle has hosted a data science competitio.docx
Attached the dataset Kaggle has hosted a data science competitio.docxcelenarouzie
 
Attached you will find all of the questions.These are just like th.docx
Attached you will find all of the questions.These are just like th.docxAttached you will find all of the questions.These are just like th.docx
Attached you will find all of the questions.These are just like th.docxcelenarouzie
 
Attached the dataset Kaggle has hosted a data science compet.docx
Attached the dataset Kaggle has hosted a data science compet.docxAttached the dataset Kaggle has hosted a data science compet.docx
Attached the dataset Kaggle has hosted a data science compet.docxcelenarouzie
 
B. Answer Learning Exercises  Matching words parts 1, 2, 3,.docx
B. Answer Learning Exercises  Matching words parts 1, 2, 3,.docxB. Answer Learning Exercises  Matching words parts 1, 2, 3,.docx
B. Answer Learning Exercises  Matching words parts 1, 2, 3,.docxcelenarouzie
 
B)What is Joe waiting for in order to forgive Missy May in The Gild.docx
B)What is Joe waiting for in order to forgive Missy May in The Gild.docxB)What is Joe waiting for in order to forgive Missy May in The Gild.docx
B)What is Joe waiting for in order to forgive Missy May in The Gild.docxcelenarouzie
 
B)Blanche and Stella both view Stanley very differently – how do the.docx
B)Blanche and Stella both view Stanley very differently – how do the.docxB)Blanche and Stella both view Stanley very differently – how do the.docx
B)Blanche and Stella both view Stanley very differently – how do the.docxcelenarouzie
 
b) What is the largest value that can be represented by 3 digits usi.docx
b) What is the largest value that can be represented by 3 digits usi.docxb) What is the largest value that can be represented by 3 digits usi.docx
b) What is the largest value that can be represented by 3 digits usi.docxcelenarouzie
 
b$ E=EE#s{gEgE lEgEHEFs ig=ii 5i= l; i € 3 r i.Er1 b €€.docx
b$ E=EE#s{gEgE lEgEHEFs ig=ii 5i= l; i € 3 r  i.Er1 b €€.docxb$ E=EE#s{gEgE lEgEHEFs ig=ii 5i= l; i € 3 r  i.Er1 b €€.docx
b$ E=EE#s{gEgE lEgEHEFs ig=ii 5i= l; i € 3 r i.Er1 b €€.docxcelenarouzie
 
B A S I C L O G I C M O D E L D E V E L O P M E N T Pr.docx
B A S I C  L O G I C  M O D E L  D E V E L O P M E N T  Pr.docxB A S I C  L O G I C  M O D E L  D E V E L O P M E N T  Pr.docx
B A S I C L O G I C M O D E L D E V E L O P M E N T Pr.docxcelenarouzie
 
B H1. The first issue that jumped out to me is that the presiden.docx
B H1. The first issue that jumped out to me is that the presiden.docxB H1. The first issue that jumped out to me is that the presiden.docx
B H1. The first issue that jumped out to me is that the presiden.docxcelenarouzie
 
B R O O K I N G SM E T R O P O L I TA N P O L I CY .docx
B R O O K I N G SM E T R O P O L I TA N P O L I CY .docxB R O O K I N G SM E T R O P O L I TA N P O L I CY .docx
B R O O K I N G SM E T R O P O L I TA N P O L I CY .docxcelenarouzie
 
B L O C K C H A I N & S U P P LY C H A I N SS U N I L.docx
B L O C K C H A I N  &  S U P P LY  C H A I N SS U N I L.docxB L O C K C H A I N  &  S U P P LY  C H A I N SS U N I L.docx
B L O C K C H A I N & S U P P LY C H A I N SS U N I L.docxcelenarouzie
 
Año 15, núm. 43 enero – abril de 2012. Análisis 97 Orien.docx
Año 15, núm. 43  enero – abril de 2012. Análisis 97 Orien.docxAño 15, núm. 43  enero – abril de 2012. Análisis 97 Orien.docx
Año 15, núm. 43 enero – abril de 2012. Análisis 97 Orien.docxcelenarouzie
 
A report is a short, well-planned and concise document that is .docx
A report is a short, well-planned and concise document that is .docxA report is a short, well-planned and concise document that is .docx
A report is a short, well-planned and concise document that is .docxcelenarouzie
 

More from celenarouzie (20)

Attaining ExpertiseYou are tr.docx
Attaining ExpertiseYou are tr.docxAttaining ExpertiseYou are tr.docx
Attaining ExpertiseYou are tr.docx
 
attachment Chloe” is a example of the whole packet. Please follow t.docx
attachment Chloe” is a example of the whole packet. Please follow t.docxattachment Chloe” is a example of the whole packet. Please follow t.docx
attachment Chloe” is a example of the whole packet. Please follow t.docx
 
AttachmentFor this discussionUse Ericksons theoretic.docx
AttachmentFor this discussionUse Ericksons theoretic.docxAttachmentFor this discussionUse Ericksons theoretic.docx
AttachmentFor this discussionUse Ericksons theoretic.docx
 
Attachment Programs and Families Working Together Learn.docx
Attachment Programs and Families Working Together Learn.docxAttachment Programs and Families Working Together Learn.docx
Attachment Programs and Families Working Together Learn.docx
 
Attachment and Emotional Development in InfancyThe purpose o.docx
Attachment and Emotional Development in InfancyThe purpose o.docxAttachment and Emotional Development in InfancyThe purpose o.docx
Attachment and Emotional Development in InfancyThe purpose o.docx
 
ATTACHEMENT from 7.1 and 7.2 Go back to the Powerpoint for thi.docx
ATTACHEMENT from 7.1 and 7.2 Go back to the Powerpoint for thi.docxATTACHEMENT from 7.1 and 7.2 Go back to the Powerpoint for thi.docx
ATTACHEMENT from 7.1 and 7.2 Go back to the Powerpoint for thi.docx
 
Attached the dataset Kaggle has hosted a data science competitio.docx
Attached the dataset Kaggle has hosted a data science competitio.docxAttached the dataset Kaggle has hosted a data science competitio.docx
Attached the dataset Kaggle has hosted a data science competitio.docx
 
Attached you will find all of the questions.These are just like th.docx
Attached you will find all of the questions.These are just like th.docxAttached you will find all of the questions.These are just like th.docx
Attached you will find all of the questions.These are just like th.docx
 
Attached the dataset Kaggle has hosted a data science compet.docx
Attached the dataset Kaggle has hosted a data science compet.docxAttached the dataset Kaggle has hosted a data science compet.docx
Attached the dataset Kaggle has hosted a data science compet.docx
 
B. Answer Learning Exercises  Matching words parts 1, 2, 3,.docx
B. Answer Learning Exercises  Matching words parts 1, 2, 3,.docxB. Answer Learning Exercises  Matching words parts 1, 2, 3,.docx
B. Answer Learning Exercises  Matching words parts 1, 2, 3,.docx
 
B)What is Joe waiting for in order to forgive Missy May in The Gild.docx
B)What is Joe waiting for in order to forgive Missy May in The Gild.docxB)What is Joe waiting for in order to forgive Missy May in The Gild.docx
B)What is Joe waiting for in order to forgive Missy May in The Gild.docx
 
B)Blanche and Stella both view Stanley very differently – how do the.docx
B)Blanche and Stella both view Stanley very differently – how do the.docxB)Blanche and Stella both view Stanley very differently – how do the.docx
B)Blanche and Stella both view Stanley very differently – how do the.docx
 
b) What is the largest value that can be represented by 3 digits usi.docx
b) What is the largest value that can be represented by 3 digits usi.docxb) What is the largest value that can be represented by 3 digits usi.docx
b) What is the largest value that can be represented by 3 digits usi.docx
 
b$ E=EE#s{gEgE lEgEHEFs ig=ii 5i= l; i € 3 r i.Er1 b €€.docx
b$ E=EE#s{gEgE lEgEHEFs ig=ii 5i= l; i € 3 r  i.Er1 b €€.docxb$ E=EE#s{gEgE lEgEHEFs ig=ii 5i= l; i € 3 r  i.Er1 b €€.docx
b$ E=EE#s{gEgE lEgEHEFs ig=ii 5i= l; i € 3 r i.Er1 b €€.docx
 
B A S I C L O G I C M O D E L D E V E L O P M E N T Pr.docx
B A S I C  L O G I C  M O D E L  D E V E L O P M E N T  Pr.docxB A S I C  L O G I C  M O D E L  D E V E L O P M E N T  Pr.docx
B A S I C L O G I C M O D E L D E V E L O P M E N T Pr.docx
 
B H1. The first issue that jumped out to me is that the presiden.docx
B H1. The first issue that jumped out to me is that the presiden.docxB H1. The first issue that jumped out to me is that the presiden.docx
B H1. The first issue that jumped out to me is that the presiden.docx
 
B R O O K I N G SM E T R O P O L I TA N P O L I CY .docx
B R O O K I N G SM E T R O P O L I TA N P O L I CY .docxB R O O K I N G SM E T R O P O L I TA N P O L I CY .docx
B R O O K I N G SM E T R O P O L I TA N P O L I CY .docx
 
B L O C K C H A I N & S U P P LY C H A I N SS U N I L.docx
B L O C K C H A I N  &  S U P P LY  C H A I N SS U N I L.docxB L O C K C H A I N  &  S U P P LY  C H A I N SS U N I L.docx
B L O C K C H A I N & S U P P LY C H A I N SS U N I L.docx
 
Año 15, núm. 43 enero – abril de 2012. Análisis 97 Orien.docx
Año 15, núm. 43  enero – abril de 2012. Análisis 97 Orien.docxAño 15, núm. 43  enero – abril de 2012. Análisis 97 Orien.docx
Año 15, núm. 43 enero – abril de 2012. Análisis 97 Orien.docx
 
A report is a short, well-planned and concise document that is .docx
A report is a short, well-planned and concise document that is .docxA report is a short, well-planned and concise document that is .docx
A report is a short, well-planned and concise document that is .docx
 

Recently uploaded

Sanyam Choudhary Chemistry practical.pdf
Sanyam Choudhary Chemistry practical.pdfSanyam Choudhary Chemistry practical.pdf
Sanyam Choudhary Chemistry practical.pdfsanyamsingh5019
 
The Most Excellent Way | 1 Corinthians 13
The Most Excellent Way | 1 Corinthians 13The Most Excellent Way | 1 Corinthians 13
The Most Excellent Way | 1 Corinthians 13Steve Thomason
 
URLs and Routing in the Odoo 17 Website App
URLs and Routing in the Odoo 17 Website AppURLs and Routing in the Odoo 17 Website App
URLs and Routing in the Odoo 17 Website AppCeline George
 
Incoming and Outgoing Shipments in 1 STEP Using Odoo 17
Incoming and Outgoing Shipments in 1 STEP Using Odoo 17Incoming and Outgoing Shipments in 1 STEP Using Odoo 17
Incoming and Outgoing Shipments in 1 STEP Using Odoo 17Celine George
 
POINT- BIOCHEMISTRY SEM 2 ENZYMES UNIT 5.pptx
POINT- BIOCHEMISTRY SEM 2 ENZYMES UNIT 5.pptxPOINT- BIOCHEMISTRY SEM 2 ENZYMES UNIT 5.pptx
POINT- BIOCHEMISTRY SEM 2 ENZYMES UNIT 5.pptxSayali Powar
 
Q4-W6-Restating Informational Text Grade 3
Q4-W6-Restating Informational Text Grade 3Q4-W6-Restating Informational Text Grade 3
Q4-W6-Restating Informational Text Grade 3JemimahLaneBuaron
 
PSYCHIATRIC History collection FORMAT.pptx
PSYCHIATRIC   History collection FORMAT.pptxPSYCHIATRIC   History collection FORMAT.pptx
PSYCHIATRIC History collection FORMAT.pptxPoojaSen20
 
mini mental status format.docx
mini    mental       status     format.docxmini    mental       status     format.docx
mini mental status format.docxPoojaSen20
 
Concept of Vouching. B.Com(Hons) /B.Compdf
Concept of Vouching. B.Com(Hons) /B.CompdfConcept of Vouching. B.Com(Hons) /B.Compdf
Concept of Vouching. B.Com(Hons) /B.CompdfUmakantAnnand
 
BASLIQ CURRENT LOOKBOOK LOOKBOOK(1) (1).pdf
BASLIQ CURRENT LOOKBOOK  LOOKBOOK(1) (1).pdfBASLIQ CURRENT LOOKBOOK  LOOKBOOK(1) (1).pdf
BASLIQ CURRENT LOOKBOOK LOOKBOOK(1) (1).pdfSoniaTolstoy
 
Contemporary philippine arts from the regions_PPT_Module_12 [Autosaved] (1).pptx
Contemporary philippine arts from the regions_PPT_Module_12 [Autosaved] (1).pptxContemporary philippine arts from the regions_PPT_Module_12 [Autosaved] (1).pptx
Contemporary philippine arts from the regions_PPT_Module_12 [Autosaved] (1).pptxRoyAbrique
 
Paris 2024 Olympic Geographies - an activity
Paris 2024 Olympic Geographies - an activityParis 2024 Olympic Geographies - an activity
Paris 2024 Olympic Geographies - an activityGeoBlogs
 
Crayon Activity Handout For the Crayon A
Crayon Activity Handout For the Crayon ACrayon Activity Handout For the Crayon A
Crayon Activity Handout For the Crayon AUnboundStockton
 
_Math 4-Q4 Week 5.pptx Steps in Collecting Data
_Math 4-Q4 Week 5.pptx Steps in Collecting Data_Math 4-Q4 Week 5.pptx Steps in Collecting Data
_Math 4-Q4 Week 5.pptx Steps in Collecting DataJhengPantaleon
 
Employee wellbeing at the workplace.pptx
Employee wellbeing at the workplace.pptxEmployee wellbeing at the workplace.pptx
Employee wellbeing at the workplace.pptxNirmalaLoungPoorunde1
 
Arihant handbook biology for class 11 .pdf
Arihant handbook biology for class 11 .pdfArihant handbook biology for class 11 .pdf
Arihant handbook biology for class 11 .pdfchloefrazer622
 
The basics of sentences session 2pptx copy.pptx
The basics of sentences session 2pptx copy.pptxThe basics of sentences session 2pptx copy.pptx
The basics of sentences session 2pptx copy.pptxheathfieldcps1
 
Solving Puzzles Benefits Everyone (English).pptx
Solving Puzzles Benefits Everyone (English).pptxSolving Puzzles Benefits Everyone (English).pptx
Solving Puzzles Benefits Everyone (English).pptxOH TEIK BIN
 

Recently uploaded (20)

Sanyam Choudhary Chemistry practical.pdf
Sanyam Choudhary Chemistry practical.pdfSanyam Choudhary Chemistry practical.pdf
Sanyam Choudhary Chemistry practical.pdf
 
The Most Excellent Way | 1 Corinthians 13
The Most Excellent Way | 1 Corinthians 13The Most Excellent Way | 1 Corinthians 13
The Most Excellent Way | 1 Corinthians 13
 
URLs and Routing in the Odoo 17 Website App
URLs and Routing in the Odoo 17 Website AppURLs and Routing in the Odoo 17 Website App
URLs and Routing in the Odoo 17 Website App
 
Incoming and Outgoing Shipments in 1 STEP Using Odoo 17
Incoming and Outgoing Shipments in 1 STEP Using Odoo 17Incoming and Outgoing Shipments in 1 STEP Using Odoo 17
Incoming and Outgoing Shipments in 1 STEP Using Odoo 17
 
POINT- BIOCHEMISTRY SEM 2 ENZYMES UNIT 5.pptx
POINT- BIOCHEMISTRY SEM 2 ENZYMES UNIT 5.pptxPOINT- BIOCHEMISTRY SEM 2 ENZYMES UNIT 5.pptx
POINT- BIOCHEMISTRY SEM 2 ENZYMES UNIT 5.pptx
 
Q4-W6-Restating Informational Text Grade 3
Q4-W6-Restating Informational Text Grade 3Q4-W6-Restating Informational Text Grade 3
Q4-W6-Restating Informational Text Grade 3
 
PSYCHIATRIC History collection FORMAT.pptx
PSYCHIATRIC   History collection FORMAT.pptxPSYCHIATRIC   History collection FORMAT.pptx
PSYCHIATRIC History collection FORMAT.pptx
 
mini mental status format.docx
mini    mental       status     format.docxmini    mental       status     format.docx
mini mental status format.docx
 
Concept of Vouching. B.Com(Hons) /B.Compdf
Concept of Vouching. B.Com(Hons) /B.CompdfConcept of Vouching. B.Com(Hons) /B.Compdf
Concept of Vouching. B.Com(Hons) /B.Compdf
 
BASLIQ CURRENT LOOKBOOK LOOKBOOK(1) (1).pdf
BASLIQ CURRENT LOOKBOOK  LOOKBOOK(1) (1).pdfBASLIQ CURRENT LOOKBOOK  LOOKBOOK(1) (1).pdf
BASLIQ CURRENT LOOKBOOK LOOKBOOK(1) (1).pdf
 
Contemporary philippine arts from the regions_PPT_Module_12 [Autosaved] (1).pptx
Contemporary philippine arts from the regions_PPT_Module_12 [Autosaved] (1).pptxContemporary philippine arts from the regions_PPT_Module_12 [Autosaved] (1).pptx
Contemporary philippine arts from the regions_PPT_Module_12 [Autosaved] (1).pptx
 
Paris 2024 Olympic Geographies - an activity
Paris 2024 Olympic Geographies - an activityParis 2024 Olympic Geographies - an activity
Paris 2024 Olympic Geographies - an activity
 
TataKelola dan KamSiber Kecerdasan Buatan v022.pdf
TataKelola dan KamSiber Kecerdasan Buatan v022.pdfTataKelola dan KamSiber Kecerdasan Buatan v022.pdf
TataKelola dan KamSiber Kecerdasan Buatan v022.pdf
 
Crayon Activity Handout For the Crayon A
Crayon Activity Handout For the Crayon ACrayon Activity Handout For the Crayon A
Crayon Activity Handout For the Crayon A
 
_Math 4-Q4 Week 5.pptx Steps in Collecting Data
_Math 4-Q4 Week 5.pptx Steps in Collecting Data_Math 4-Q4 Week 5.pptx Steps in Collecting Data
_Math 4-Q4 Week 5.pptx Steps in Collecting Data
 
Employee wellbeing at the workplace.pptx
Employee wellbeing at the workplace.pptxEmployee wellbeing at the workplace.pptx
Employee wellbeing at the workplace.pptx
 
Arihant handbook biology for class 11 .pdf
Arihant handbook biology for class 11 .pdfArihant handbook biology for class 11 .pdf
Arihant handbook biology for class 11 .pdf
 
The basics of sentences session 2pptx copy.pptx
The basics of sentences session 2pptx copy.pptxThe basics of sentences session 2pptx copy.pptx
The basics of sentences session 2pptx copy.pptx
 
Solving Puzzles Benefits Everyone (English).pptx
Solving Puzzles Benefits Everyone (English).pptxSolving Puzzles Benefits Everyone (English).pptx
Solving Puzzles Benefits Everyone (English).pptx
 
Model Call Girl in Tilak Nagar Delhi reach out to us at 🔝9953056974🔝
Model Call Girl in Tilak Nagar Delhi reach out to us at 🔝9953056974🔝Model Call Girl in Tilak Nagar Delhi reach out to us at 🔝9953056974🔝
Model Call Girl in Tilak Nagar Delhi reach out to us at 🔝9953056974🔝
 

b l u e p r i n t i CONSUMER PERCEPTIONSHQW DQPerception.docx

  • 1. b l u e p r i n t i CONSUMER PERCEPTIONS HQW DQ Perceptions Impact Your Market? By Nicole Olynk Widmar and Melissa McKendree, Purdue University I aintaining existing mar- kets for pork products, I cultivating new markets for existing products and creating new products for new markets are some avenues that the U.S. pork industry has sought, and continues to explore, for growth. When it comes to maintaining markets, there are several relationships that must be considered. End consumers, whether in restaurant or supermarket settings, are increas- ingly interested in social issues and the production processes employed in food production. Livestock products (meat and dairy products) certainly seem to get the majority of the spotlight in regard to consumers' concern for pro- duction processes. Shoppers in supermarkets and din-
  • 2. ers in restaurants have increased access to information via the Internet, and are in constant communication with one another via social media and alterna- tive news sources about perceptions of animal agriculture. Even though most U.S. consumers are not directly in contact with livestock, concern for the treatment of animals, including those employed in food production, is evident — and increasing. While in the past consumers were mainly concerned with factors like the fat or nutritional content of pork, for exam- ple, today's savvy shoppers are con- sidering other factors, like the welfare of livestock (pigs), safety of workers employed on farms and potential envi- ronmental impacts (externalities) of livestock operations. Large-scale changes in production practices are taking place in livestock 24 April 15, 2014 production due to pressures from vari- ous interested parties. Changes such as the discontinued use of gestation stalls, for example, are being sought via traditional regulatory channels in some states, but are also being pushed via non-traditional market channels. Consider the cumbersome process of changing regulations, versus the oftentimes faster (and perhaps easier)
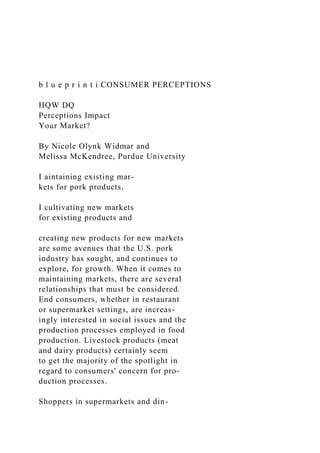
  • 3. channel of influencing key market actors. It is no surprise that consum- ers' concerns are increasingly voiced to supermarkets and restaurants which, in turn, take action to satisfy their customers by placing pressure on sup- ply-chain players. Changes sought via "the market," rather than legislation or regulation, are increasingly common, and the use of market channels for communicating throughout the supply chain is unlikely to stop anytime soon. www.nationalhogfarmer.com Figure 1. Reported Recollection of Exposure to Media Stories Regarding Pig Welfare, by Source 7 0 % 0 % Television Internet Media source Printed Magazines Newspaper Books I have not seen any media stories regarding pig welfare.
  • 4. Melissa McKendree (left) and Nicole Olynk Widmar A national-scale study completed at Purdue University by Nicole Olynk Widmar, Melissa McKendree, and Candace Croney in 2013 was focused on assessing consumers' perceptions of various pork products. A total of 798 individuals from across the U.S. com- pleted the survey, which was analyzed to investigate relationships between various consumer- and household-lev- el characteristics, and their views on animal welfare. The average age of survey respon- dents was 47, 48% of respondents were male, and the average household size was approximately two adults and 0.5 children. In addition to general house- hold characteristics, survey respon- dents were asked in-depth questions regarding their perceptions of pork production prac- tices, and views on the treatment of both companion and live- stock animals. Respondents were asked a number of questions related to pig welfare. When asked specifically
  • 5. about whether they recalled seeing media stories regarding the welfare of pigs, the majority of respon- dents, 65%, report- ed that they had not seen any media stories. Yet, a total of 14% of survey respondents reportedly reduced total pork consumption in the past three years due to animal welfare concerns. Even if consumers are not explicitly recalling having seen media stories on pig welfare, it is highly likely that they have been exposed to animal welfare information via media or social inter- actions. Figure 1. Reported Recollection of Exposure to Media Stories Regarding Pig Welfare, by Source Consumers report concern for the welfare of livestock animals, in gen- eral. Consumers were asked to report their level of concern for the welfare of livestock animals both raised domesti- cally and produced outside the U.S. It is evident that there are, in general, larger proportions of consumers reporting extreme concern for livestock raised outside the U.S. Nonetheless, only
  • 6. 43% of respondents rated their level of concern for domestically produced live- stock at 3 or below on the scale provided, as seen in Figure 2, page 26. Figure 2. Reported Concern for Livestock Raised Both Domestically and Outside the U.S. There are, presumably, a number of factors that may be related to consumer perceptions of pig welfare. Demographics, including age, gender, and/or political affiliation, were investigat- ed with regard to reported levels of concern for domestically reared live- stock. Those who indicated concern for the welfare of animals employed in domestic food production were more frequently women, younger, and more often owned a dog and/or cat than the participants who were neutral or not concerned. Of those reportedly con- cerned about the welfare of domestic food animals, 73% were dog and/or cat owners, while 58% of those who were reportedly neutral or not concerned owned dogs and/or cats. Not surprisingly, those who report-
  • 7. ed concern for domestic food animals more often reported reducing pork consumption due to animal welfare concerns. Those who reported being not concerned about the welfare of domestic food animals more fre- quently self-reported as a member of the Republican political party, while those who reported being concerned were more frequently members of the Democratic Party. Recently, a great deal of attention has been paid to linkages in consum- ers' minds between the welfare of pets or companion animal species and the welfare of farm animals. It is common for animal welfare campaigns to link companion animals and farm animal issues. Given the vast number of U.S. households with pets and the relatively small number of people with direct www.nationalhogfarmer.com April 15,2014 25 b l u e p r i n t i CONSUMER PERCEPTIONS experience with livestock care, it is certainly believable that companion species may be the point of reference for many people when it comes to animal welfare. The study highlights key demographic factors — including pet ownership — related to consumers'
  • 8. perceptions of animal welfare. A total 66% of households surveyed reported owning at least one animal; 48% of households owned dogs, 41% owned cats, 3% owned horses and 10% owned other animals. Interestingly, all those who owned a horse also reportedly owned a cat and/or a dog. Dog and/or cat owners were found to be statistically different from those who do not own a cat or dog across many different factors. When analyz- ing demographic characteristics, those who reported being dog and/or cat owners were more frequently female, younger, had larger households (more adults and children in the house), and higher weekly food expenditures. Dog and/or cat owners also had visited a farm with animals raised for meat or milk production more recently, and were more concerned about food- animal welfare for both domestically raised animals and animals raised out- side the U.S. Dog and/or cat owners also more frequently reported having a source for animal welfare information, whether The Humane Society of the Figure 2. Reported Concern for Livestock Raised Domestically and Outside the United States 4-> 40.00
  • 9. 35.00 30.00 Level of concern • Domestically pro(juce(d • Produced outside of the U.S. 1 2 Not concerned United States (HSUS) or People for the Ethical Treatment of Animals (PETA), or another source, than those who did not own a cat or dog. However, nearly half of the dog and/or cat owners did not report having a source for animal welfare information. It is hypothesized AV-E DIGEST A proven replacement for ALL otiier / premium protein ingredients in pig starters. / y/100% Poultry Based | y^ Proven Safe JE' • From a USDA inspected facility / y^ Proven , I Performance U '• Best Value
  • 10. I'm taking no chances and INSISTiNG on AV-E DiGEST in ali my pig starters 3850 Merle Hay Rd.,Ste. 212 - D e s Moines, Iowa 50310 800-424-0185 • 515-270-0185 • Fax 515-270-0214 Email; in/[email protected])roducts.com mm.xfeproauas.com 5 6 7 Extremely concerned that owning a pet, regardless of your information source, predisposes one to be concerned about animal welfare. Therefore, the existence of the human- animal bond with dogs or cats poten- tially influences a person's perceptions of food-animal welfare. Due to recent media attention on livestock housing, especially regarding cages and housing systems for pigs and chickens, dog and cat owners were also asked if they confined their cats and/or dogs to a cage or kennel. If one accepts the potential for the public to link companion animal care with livestock treatment, the question of caging pets becomes of great interest to animal agriculture as various livestock pro- ducers, especially those raising pigs, face continued pressures to disadopt the use of stalls in favor of group hous- ing or other alternative systems.
  • 11. Potentially, survey respondents who cage their own animals may feel dif- ferently about caging other animals, including livestock, than those who do not cage their animals. Of the 65% of households that owned cats and/ or dogs, 416 (80%) indicated that they did not confine their cats and/or dogs. The majority of those who specified they did confine their cat and/or dog only did so for less than six hours per 26 April 15,2014 b l u e p r i n t i OONSUMER PEROEPTIONS day. Specifically, 56 (11%) households confined their cat and/or dog for less than six hours per day, 27 (5%) house- holds did so seven to 12 hours per day, 13 (3%) households did so 13 to 18 hours per day and six (1%) households did so 19 to 24 hours per day. Those who cage their dog and/or cat more frequently stated that they reduced their pork consumption due to animal welfare concerns, and recalled media stories regarding pig welfare (Eigure 3, page 30). Figure 3. Cross Tabulations for Dog and/or Cat Owners Who Report Caging Their Dog and/or Cat, vs.
  • 12. Those Who Report Not Caging Their Dog and/or Cat When looking at information sourc- es on animal welfare, those who cage their dog and/or cat more common- ly stated that they had an informa- tion source. Additionally, those who cage their dog and/or cat more fre- quently reported using sources other than HSUS or PETA. More dog and/ or cat owners who cage their animals also reported being concerned about domestic food-animal welfare; how- ever, only one statistical difference was found when looking at specific pork industry practices. It is worth noting that no statistical differences were found among dog and cat owners who cage and do not cage their animals regarding pig housing (i.e., confining hogs indoors, farrow- ing crates, gestation crates and group pens). Agricultural industries have long speculated that people who cage their animals would be less apt to be concerned about the housing of hogs in crates or stalls. However, this analysis finds that those who cage their cat and/or dog do not differ in their mean level of concern for pig housing situations from those who do not cage their cat
  • 13. and/or dog. On the contrary, as evi- denced by higher reporting of reduc- tion in pork consumption due to animal welfare concerns and more concern for domestic food-animal welfare, those who cage their animals seem to be overall more concerned about food-animal treatment. Given the concern for understand- ing key consumer markets, analy- ses were conducted by regions of the country in which respondents lived. Those from the Midwest region (204 respondents) were statistically less concerned about pig welfare at the farm level than those from the Northeast (198 respondents) or West (184 respondents) regions of the U.S. A stark difference in animal welfare concern for pork industry practices is evident. Eor nearly all practices in question, respondents from the Midwest region were statistically less concerned than those from other regions of the U.S. Additionally, those from the Midwest more frequently reported not having a source for animal wel- fare information than those from the Northeast or West regions. The Midwest states are among the top-pro- ducing hog states in the U.S.; poten-
  • 14. June 25 & 26, 2014 Boone. Iowa THE NATION'S LAB6IST 2-DAY HAY & FORAGE EVENT HayExpo.com (866) 264-7469 [email protected] Host Publications: íHay^aragel ; Agriculturist | Leaves of gold I Ä ^ Apply maniira I YOUR one-stop hay and forage : teaming and shopping opportunity • Mowing and conditioning demonstrations • Baling and handling demos Silage demonstrations - Major and shortline hay/forage manufacturer exhibits, production and storage equipment • Seed companies and many additional exhibitors
  • 15. • Educational opportunities Exhibit Hours: 9 a.m. to 4 p.m. 'arking: $10 per vehicle. Imission to event is free. Improve Your Productivity & Bottom Line NEW! Hay & Forage Expo introduces its new name and its alliance with Hay & Forage Grower magazine, the industry's comprehensive information leader. You can't afford to miss this event! If hay and/or forage production is a part of your f a r m - no matter the size — this show is for you. Plan Now to Attend! JOHN DEERE 4-RamPtOgress. Penton Farm Progress Group 255 38th Avenue, Suite P St. Charles, IL60174-5410 PentonFarmProgress.com [email protected]^^^_ 2 8 April 15, 2014 www.nationalhogfarmer.conn
  • 16. tially, the results suggest that those who are living in geographic areas familiar with hog farming may be less concerned about hog production prac- tices. Beyond concern for pork pro- duction practices, respondents from the Midwest had a statistically lower mean level of concern for the welfare of livestock produced in the U.S. Regional Differences Recognition of regional differences is important, because if those who are most likely to interact with livestock animals (or any animals) are not cogni- zant or aware of concerns surrounding animal welfare, then potential prob- lems could go unrecognized. Inherent differences across regions in terms of animal welfare concerns, especially when comparing livestock- and hog- producing regions to other regions, can yield challenges for communicating with consumers effectively. The perceptions of today's pork con- sumers regarding the treatment of live- stock animals will impact the industry in the future via multiple avenues, including what products consumers demand, what they are willing to pay for those products, and fundamen- tally which markets will continue to exist, grow, shrink or cease to exist.
  • 17. Understanding the consumer demo- graphics and characteristics which may be related to perceptions of livestock welfare, such as pet ownership, views of livestock practices, etc., can aid the pork industry in effectively communi- cating with its end consumers — and in understanding their concerns. A key factor that was associated with general animal welfare concern was pet ownership. It is hypothesized that the bond between humans and animals and whether the individual reports having any source for animal welfare information play a primary role in an individual's concern for ani- mal welfare, more so than whether their source of information for animal welfare was HSUS or PETA. Potentially, those who own pets feel stronger moral obligations to food animals and will be more concerned about their well-being. The increased altruism for food animals may stem from concerns arising from interac- tions with pets and then other addi- tional factors, such as the source for April 15,2014 29 animal welfare information, educa- tion, age and gender, which could further increase concern for animal welfare. This finding, which connects
  • 18. pet ownership to increased concern for livestock animals, will have impli- cations for education, communication, and marketing. Although a causal relationship can- not be established, pet ownership and increased concern for food-animal wel- fare appear to be correlated. Also, it is not necessarily that activists targeting pet owners cause people to become concerned about animal well-being, but it may be that those already con- cerned are connecting with groups that share their concerns. Any latent moral beliefs about perceived obligations to animals seem to be connected with (not necessarily caused by) pet ownership and human-animal bonds. © 2014 Penton Media, Inc. All rights reserved. [Title]-Stem cell treatment and the positive impact on autoimmune diseases. Research Question-What positive impact has the use of the stem cell treatment in patients with autoimmune diseases? Objectives of the project. 1. To investigate the use of stem cell treatment in autoimmune diseases. 2. To demonstrate the positive impact of using stem cells to treat autoimmune diseases. 3. To present through a systematic review of the literature
  • 19. therapeutic options with stem cells that have the ability to successfully treat patients with autoimmune diseases. Theoretical Framework- La teoría de la consecución de objetivos desarrollada por Imogene King. My job no needed PICOT question due to be a literature review. My References-I Needs more references Ahmed, Z., Imdad, A., Connelly, J. A., & Acra, S. (2019). Autoimmune Enteropathy: An Updated Review with Special Focus on Stem Cell Transplant Therapy. Digestive Diseases & Sciences, 64(3), 643–654. https://doi-org.librarylogin- cupey.uagm.edu/10.1007/s10620-018-5364-1 Snowden, J. A., Sharrack, B., Akil, M., Kiely, D. G., Lobo, A., Kazmi, M., Muraro, P. A., & Lindsay, J. O. (2018). Autologous haematopoietic stem cell transplantation (aHSCT) for severe resistant autoimmune and inflammatory diseases -- a guide for the generalist. Clinical Medicine, 18(4), 329–334. https://doi- org.librarylogin-cupey.uagm.edu/10.7861/clinmedicine.18-4- 329 Ferreira Zombrilli, A., Leopoldo, V. C., Oliveira, M. C., Cirioli de Oliveira, M. de F., Ehmke Dolci, M., Merizio Martins Braga, F. T., & de Campos Pereira Silveira, R. C. (2019). Virtual learning object in hematopoietic stem cell transplantation for autoimmune diseases. Revista Brasileira de Enfermagem, 72(4), 994–1000. https://doi-org.librarylogin- cupey.uagm.edu/10.1590/0034-7167-2018-0669 Balassa, K., Danby, R., & Rocha, V. (2019). Haematopoietic stem cell transplants: principles and indications. British Journal of Hospital Medicine (17508460), 80(1), 33–39. https://doi- org.librarylogin cupey.uagm.edu/10.12968/hmed.2019.80.1.33 Van Laar, J. M., Naraghi, K., & Tyndall, A. (2015). Haematopoietic stem cell transplantation for poor-prognosis systemic sclerosis. Rheumatology, 54(12), 2126–2133. https://doi-org.librarylogin- cupey.uagm.edu/10.1093/rheumatology/kev117 Atkins, H., Freedman, M., Atkins, H. L., & Freedman, M. S.
  • 20. (2017). Five Questions Answered: A Review of Autologous Hematopoietic Stem Cell Transplantation for the Treatment of Multiple Sclerosis. Neurotherapeutics, 14(4), 888–893. https://doi-org.librarylogin-cupey.uagm.edu/10.1007/s13311- 017-0564-5 Currò, D., Mancardi, G., & Currò, D. (2016). Autologous hematopoietic stem cell transplantation in multiple sclerosis: 20 years of experience. Neurological Sciences, 37(6), 857–865. https://doi-org.librarylogin-cupey.uagm.edu/10.1007/s10072- 016-2564-3 Baharlou, R., Rashidi, N., Ahmadi-Vasmehjani, A., Khoubyari, M., Sheikh, M., & Erfanian, S. (2019). Immunomodulatory Effects of Human Adipose Tissue-derived Mesenchymal Stem Cells on T Cell Subsets in Patients with Rheumatoid Arthritis. Iranian Journal of Allergy, Asthma & Immunology, 18(1), 114– 119. Ferreira Zombrilli, A., Leopoldo, V. C., Oliveira, M. C., Cirioli de Oliveira, M. de F., Ehmke Dolci, M., Merizio Martins Braga, F. T., & de Campos Pereira Silveira, R. C. (2019). Virtual learning object in hematopoietic stem cell transplantation for autoimmune diseases. Revista Brasileira de Enfermagem, 72(4), 994–1000. https://doi-org.librarylogin- cupey.uagm.edu/10.1590/0034-7167-2018-0669 Snowden, J. A., Sharrack, B., Akil, M., Kiely, D. G., Lobo, A., Kazmi, M., Muraro, P. A., & Lindsay, J. O. (2018). Autologous haematopoietic stem cell transplantation (aHSCT) for severe resistant autoimmune and inflammatory diseases -- a guide for the generalist. Clinical Medicine, 18(4), 329–334. https://doi- org.librarylogin-cupey.uagm.edu/10.7861/clinmedicine.18-4- 329 Ahmed, Z., Imdad, A., Connelly, J. A., & Acra, S. (2019). Autoimmune Enteropathy: An Updated Review with Special Focus on Stem Cell Transplant Therapy. Digestive Diseases & Sciences, 64(3), 643–654. https://doi-org.librarylogin- cupey.uagm.edu/10.1007/s10620-018-5364-1 APA -Rebeiro, P., & Moore, J. (2016). The role of autologous
  • 21. haemopoietic stem cell transplantation in the treatment of autoimmune disorders. Internal medicine journal, 46(1), 17-28 APA- Snowden, J. A., Badoglio, M., Labopin, M., Giebel, S., McGrath, E., Marjanovic, Z., ... & Kazmi, M. (2017). Evolution, trends, outcomes, and economics of hematopoietic stem cell transplantation in severe autoimmune diseases. Blood advances, 1(27), 2742-2755. Xiaoxiao Lu, Xilian Wang, Hong Nian, Dan Yang & Ruihua Wei. Mesenchymal stem cells for treating autoimmune dacryoadenitis Stem Cell Research & Therapy, volume 8, Article number: 126 (2017) How to write a Proposal 1. Literature review 2. Case study (You need a letter of approval from the patient and/or the provider, describe how you are handling confidentially of the information) 3. Pre and post-education (You may need to write a consent form, and you need a letter of approval from your organization) Components of the Proposal I. Title II. Introduction An introduction should announce your topic. You can start your introduction with a few sentences, which announce the topic of your paper and give an indication of the kind of research questions you will be asking. The first few sentences should act as an indication of a broader problem, which you will then focus on more closely in the rest of your introduction, leading to your specific research questions. The introduction should include the purpose of the project and the Methods. III. The Problem 1. Research Question The research question should be concise and closely focused. The research question might recall some of the key words
  • 22. established in the first few sentences and the title of your paper. You have to write the Question. 2. Objective or Objectives Objectives must always be set after having formulated a good research question. After all, they are to explain the way in which such a question is going to be answered. Objectives are usually headed by infinitive verbs such as: · · To identify · To establish · To describe · To determine · To estimate · To develop · To compare · To analyze · To collect 3. You need to explain the contribution of the research to the topic and to the advanced nursing practice. Use references. IV. Review of Literature. The purpose is to offer an overview of the significant literature published on a topic: 1. identifies areas of prior scholarship 2. Describes the relationship of each source to the others that you have selected 3. Points the way forward for further research. The literature review should include the following: 1. Objective of the literature review 2. Overview of the subject under consideration. 3. Particular position, those opposed, and those offering completely different arguments. 4. Discussion of both the distinctiveness of each source and its similarities with the others.
  • 23. No less than 30 references (15 for NURS 502, and 15 for NURS 503). No older than 2015. Include a nursing theory or a conceptual model and describe it. V. Methodology. · Describe the design · Identify the variable · Describe the reliability and validity of the instrument · Describe the population and the sample. · Describe the steps to protect the rights of human according to IRB criteria. · Discuss the procedure to complete the study. VI. Data analysis. 4. Describe the data analysis according to the design and variables. Addendum: 1. Copy of the proposal. 2. Copy of instruments. 3. Copy of consents. 4. IRB F01 (or F08). 5. CV 6. CITI training. 7. APA. NOTE: This is a template and guide. Delete all highlighted materials. Note that there is no heading that says Introduction. The paragraph or two that follows the title on the first page of your text is assumed to be your introduction. Your introduction follows the title of your paper (note that the title is not bolded). You should start your introduction with a powerful statement or two to stimulate interest. You should identify the purpose of
  • 24. your paper. Remember that formal papers are in third person, so no I, me, we except in specified areas. The introduction should include the purpose of the project and the Methods. Significance of the Practice Problem Start this section with identification of the practice problem. This section should also answer the question “why is this important?” You should address the significance to the patient/client (e.g., pain, suffering, quality of life, impact on income potential, etc.), the family, healthcare system (e.g., impact on cost or delivery systems), and society (e.g., cost of care, need for healthcare policy). Discuss the incidence and/or prevalence and include the financial impact if possible. You might discuss the impact on length of stay, readmission, home health care requirements, disability and/or mortality. Also, you should address any quality, safety, legal, and ethical implications. This discussion must be substantiated by citations from professional literature. Research Question This section should include your research question, but also should include the three objectives that will assist you to answer your question. This section contains your operational definitions of the variables in the question. If you use definitions from the literature, be sure to cite them. Theoretical Framework This section should include the theoretical framework that supports your MSN Project. Describe the theory or model that served as the foundation for your project. This may be a nursing theory or a theory from another discipline if pertinent and applicable. Synthesis of the Literature Synthesize at least 30 primary research studies (15 during NURS 502 & 15 during NURS503) and/or systematic reviews;
  • 25. do not include summary articles. This section is all about the scientific evidence rather than someone else’s opinion of the evidence. Do not use secondary sources; you need to get the article, read it, and make your own decision about quality and applicability to your question even if you did find out about the study in a review of the literature. The studies that you cite in this section must relate directly to your research question. This is a synthesis rather than a study-by-study review. Address the similarities, differences, and controversies in the body of evidence. Practice Recommendations So. . . using available evidence, what is the answer to your question? This section is for you to summarize the strength of the body of evidence (quality, quantity, and consistency), make a summary statement, and based on your conclusions drawn from the review, give a recommendation for practice change based on scientific evidence. This would logically be the intervention of your PICOT question. You might want to design an algorithm and include it in as a figure. Perhaps you found substantiation for usual practice, and you recommend reinforcement and education regarding this best practice. Project Description Describe the form that the literature review will carry out, how many articles, and how many years old. Add the websites that you will research for the search of articles, keywords that you will use for your search Here you should include the impact that your research will have. It must also include that it will be kept for 5 years in a locked office of the home of the principal investigator, and that after that time has elapsed, it will be destroyed. This section may be in first person. Project Evaluation Results This section must include how you will evaluate the planned
  • 26. change project. Remember that you must have evaluated the outcome(s) identified in your PICOT question Here you should mention the tables A and B that you will use for the evaluation of the results of your literature review. Describe each of the tables (A & B) that are at the end of the template. Tables and Figures should follow the References This section may be in first person. Discussion and Implications for Nursing and Healthcare Discuss the conclusions you can make from the project evaluation results: review and answer your PICOT question. Examine, interpret, and qualify the results. Discuss internal validity and limitations of the project evaluation. Take into account sources of potential bias and other threats to internal validity, the imprecision of measures, and other limitations and weaknesses of the evaluation (adapted from APA, 2010, p. 35). Describe the implications of your project and the project evaluation on nursing practice and healthcare. Do not overstate the significance. Identify the impact on the appropriate microsystem. Include any recommendations you have as a result of this project and project evaluation. Also, include what you might recommend with replication of this project and project evaluation and your potential next steps for this practice problem. Plans for Dissemination This section should include your plan for sharing the results of your project within the institution and within the professional community. Discuss who you invited to the presentation of results at the institution and how you presented the information. Describe the response of stakeholders to your presentation and about the potential for sustainability. Also, discuss your plans for presentation at regional or national meetings and/or publication. If publication is planned, discuss what journal you will submit your manuscript to and why. The dissemination must be among the classmates with a PowerPoint presentation; a
  • 27. poster with a brief summary of project plan, evaluation, and results to be exposed in the hall at Ana G Mendez, SFC; and a hard copy to be left at the library to be reviewed for those students of facilitators interested in the topic. This section may be in first person. Summary and Conclusion The conclusion should start with a statement regarding the intent of the paper and your achievement toward that intention. Remember that the introduction is a preview, and this section should contain a summary. When completed your summary and conclusion, do not include a categorical conclusion, which means, that you should not mention the results of your literature review, otherwise, this would give the impression that your project has ended. It must include the importance of what has been reviewed so far, and the need to finalize the literature review in order to have a more conclusive result. References Remember that this is a reference list rather than a bibliography. A bibliography is everything you read to prepare the paper but a reference list is only what you cited. If there is not a citation for a reference, it should not be here. PLEASE make sure that your references here and your citations throughout the paper are in APA format. Take the time to make sure that they are correct. We have already formatted the paper for you with this template. Figure 1 Figures included here are most likely going to be figures illustrating your data analysis. Appendix A NOTE: Order these appendices in the order in which they were referred to in the paper. Summary of Primary Research Evidence (this table may be single space)
  • 28. Citation Question or Hypothesis Theoretical Foundation Research Design (include tools) and Sample Size Key Findings Recommendations/ Implications Level of Evidence Legend: Level I: systematic reviews or meta-analysis Level II: well-designed Randomized Controlled Trial (RCT) Level III: well-designed controlled trials without randomization, quasi-experimental Level IV: well-designed case-control and cohort studies Level V: systematic reviews of descriptive and qualitative studies Level VI: single descriptive or qualitative study Level VII: opinion of authorities and/or reports of expert committees Appendix B Summary of Systematic Reviews (SR) (this table may be single space) Citation Question Search Strategy Inclusion/ Exclusion Criteria Data Extraction and Analysis
  • 30. Legend: Level I: systematic reviews or meta-analysis Level II: well-designed Randomized Controlled Trial (RCT) Level III: well-designed controlled trials without randomization, quasi-experimental Level IV: well-designed case-control and cohort studies Level V: systematic reviews of descriptive and qualitative studies Level VI: single descriptive or qualitative study Level VII: opinion of authorities and/or reports of expert committees 1
  • 31. Unit III: Perception, Learning, and Memory Course Learning Objectives for Unit III 3. Explain how consumers interpret information about products and people. 3.1 Explain how consumers interpret information about products and people through their perceptions, learning, and memory. 5. Describe how self-perception influences consumers’ actions. 5.1 Describe the importance of self-perception and its influence on consumer buying. 6. Explore how one’s personality influences lifestyle choices. 6.1 Explain how differences in consumer personalities impact their buying choices and overall lifestyle choices. Sensation • Sensation: This is the immediate response of sensory receptors (e.g., eyes, ears, mouth, fingers, skin). • Perception: This is the process by which people select, organize, and interpret these sensations.
  • 32. • Hedonic consumption: This encompasses the multisensory emotional aspects of consumers’ interactions with products. • Sensory marketing: Companies have to think carefully about the impact of sensations on product experiences. Stages of Perception • Sensory threshold: Point at which it is strong enough to make a conscious impact in his or her awareness • Absolute threshold: Minimum amount of stimulation a person can detect • Differential threshold: Ability of a sensory system to detect changes in or differences between two stimuli • Subliminal perception: Stimulus below the level of the consumer’s awareness Attention • Attention: This refers to the extent to which the processing activity is devoted to a particular stimulus. • How do marketers get our attention? – Commercial breaks – Rich media – Something outrageous
  • 33. • Perceptual vigilance: We are more likely to be aware of stimuli that relate to our current needs. • Perceptual defense: We tend to see what we want to see. Interpretation • Interpretation: This refers to the meanings we assign to sensory stimuli. • Closure principle: People tend to perceive an incomplete picture as complete. • Principle of similarity: Consumers tend to group together objects that share similar physical characteristics. • Figure ground principle: One part of the stimulus will dominate. Learning • Classical conditioning: This is when a stimulus that creates a response is paired with another stimulus that initially does not cause a response. – Unconditioned stimulus, conditioned stimulus, conditioned response • Learning is a relatively
  • 34. permanent change in behavior caused by experience. • Behavioral learning theories: These suggest that learning takes place as the result of responses to external events. Person reading book (Alexas_Fotos(, 2017) Marketing Applications • Brand equity: The brand has a strong and positive association in a consumer’s memory and creates loyalty. • Instrumental conditioning: This occurs when we learn to perform behaviors that produce positive outcomes. – Positive reinforcement, negative reinforcement, punishment (3dman_eu, 2013) Marketing Applications (cont) • Frequency marketing: Rewards regular purchasers • Gamification: Turns routine actions into
  • 35. experiences by adding gaming elements • Cognitive learning theory: Stresses the importance of internal mental processes • Observational learning: Occurs when we watch the actions of others and note the reinforcements they receive Learning to be Consumers • Consumer socialization: When young people acquire skills, knowledge, and attitudes that help them function in the marketplace • Cognitive development: Ability of children to comprehend concepts of increasing complexity – Limited, cued, strategic – Multiple intelligence theory Adult and child using laptop (Alphalight1, 2013) Memory • Memory is the process of acquiring information and storing it over time.
  • 36. – Encoding and retrieving stages – Sensory memory, short-term memory, long-term memory – Activation models of memory • Associative network: Contains bits of related information • Spreading activation: Shift back and forth among levels of meaning Retrieving Memories • Helps consumers determine what to buy based off of previous experiences • Forgetting: Decay vs. interference • State-dependent retrieval: Can access information easier if in the same environment asa where it was encoded Brain (geralt, 2015) References
  • 37. Alexas_Fotos. (2017). School study learn [image]. Retrieved from https://pixabay.com/en/school-study-learn-books-read-2051711/ Alphalight1. (2013). Child at computer [Photograph]. Retrieved from https://pixabay.com/en/child-girl-young-caucasian-1073638/ Geralt. (2015). Brain turn on [Image]. Retrieved from https://pixabay.com/en/brain-turn-on-education-read-book- 770044/ 3dman_eu. (2013). Brand business company [Image]. Retrieved from https://pixabay.com/en/brand-business-company-mark-focus- 1027862/ This presentation is copyrighted by Columbia Southern University. Use of this video without the express written consent of Columbia Southern University is prohibited. MAR 3211, Consumer Behavior 1
  • 38. Course Learning Outcomes for Unit III Upon completion of this unit, students should be able to: 3. Explain how consumers interpret information about products and people. 3.1 Explain how consumers interpret information about products and people through their perceptions, learning, and memory. 5. Describe how self-perception influences consumers’ actions. 5.1 Describe the importance of self-perception and its influence on consumer buying. 6. Explore how one’s personality influences lifestyle choices. 6.1 Explain how differences in consumer personalities impact their buying choices and overall lifestyle choices. Course/Unit Learning Outcomes Learning Activity 3.1 Unit Lesson PowerPoint Presentation Nakamura (2014) article Olynk Widmar and McKendree (2014) article
  • 39. TED (2012) video Web Assignment 5.1 Unit Lesson PowerPoint Presentation Hart (2011) article Nakamura (2014) article Olynk Widmar and McKendree (2014) article TED (2012) video Web Assignment 6.1 Unit Lesson PowerPoint Presentation Hart (2011) article Nakamura (2014) article Olynk Widmar and McKendree (2014) article TED (2012) video Web Assignment Reading Assignment In order to access the following resources, click the links below. Click here to access the Unit III PowerPoint presentation. (Click here to access a PDF version of the presentation.) Hart, L. (2011). Tips for influencing consumer perceptions. Kitchen & Bath Design News, 29(4), 32. Retrieved
  • 40. from https://libraryresources.columbiasouthern.edu/login?url=http://s earch.proquest.com.libraryresources.c olumbiasouthern.edu/docview/864589615?accountid=33337 UNIT III STUDY GUIDE Perception, Learning, and Memory https://online.columbiasouthern.edu/bbcswebdav/xid- 68746811_1 https://online.columbiasouthern.edu/bbcswebdav/xid- 68746795_1 https://libraryresources.columbiasouthern.edu/login?url=http://s earch.proquest.com.libraryresources.columbiasouthern.edu/docv iew/864589615?accountid=33337 https://libraryresources.columbiasouthern.edu/login?url=http://s earch.proquest.com.libraryresources.columbiasouthern.edu/docv iew/864589615?accountid=33337 MAR 3211, Consumer Behavior 2 UNIT x STUDY GUIDE Title Nakamura, L. (2014). Hidden value: How consumer learning boosts output. Business Review - Federal Reserve Bank of Philadelphia, 9–14. Retrieved from https://libraryresources.columbiasouthern.edu/login?url=http://s earch.proquest.com.libraryresources.c
  • 41. olumbiasouthern.edu/docview/1565808769?accountid=33337 Olynk Widmar, N., & McKendree, M. (2014). How do consumer perceptions impact your market? National Hog Farmer, 59(4), 24–29. Retrieved from https://libraryresources.columbiasouthern.edu/login?url=http://s earch.ebscohost.com/login.aspx?direc t=true&db=bth&AN=95698066&site=ehost-live&scope=site TED. (2012, July 19). TEDTalks: Joseph Pine—What do consumers really want? [Video file]. Retrieved from https://libraryresources.columbiasouthern.edu/login?auth=CAS &url=http://fod.infobase.com/PortalPla ylists.aspx?wID=273866&xtid=48396 Click here to access the transcript for the video above. Unit Lesson Why does a marketer need to understand consumer perceptions, learning, and memory? Let us remember that marketing strategy is really all about how a company presents a bundle of benefits to the consumer. In order to present this bundle, the marketer must ultimately understand the value proposition or, in other words, what the customer considers to be of value. It is through these efforts of understanding what the consumer thinks to be of value that the marketer attempts to discover consumer perceptions, learning, and memory.
  • 42. Beginning with a few definitions, learning refers to the change in behavior resulting from the interaction between a person and a stimulus. Perception involves how a consumer views and responds to his or her surroundings. Value is interpreted from learning, and perception plays an instrumental role in learning. The two are intertwined within the context of consumer behavior. The consumer perception process is important to marketers as it identifies components involved with how consumers become aware of and interpret the environment. The consumer perception process involves three stages. These phases of the consumer perception process enable marketers to understand how consumers perceive stimuli, process it, and ultimately decide to buy or not buy the items that marketers are advertising. Sensing •Immediate response to stimuli •Consumer enters store or Internet site and is exposed to a variety of things Organizing •Assembly of sensory evidence into something recognizable •Consumer tries article of clothing on and recognizes whether the style is right for his
  • 43. or her uses Reacting •Taking action •Consumer decides to buy or not buy item https://libraryresources.columbiasouthern.edu/login?url=http://s earch.proquest.com.libraryresources.columbiasouthern.edu/docv iew/1565808769?accountid=33337 https://libraryresources.columbiasouthern.edu/login?url=http://s earch.proquest.com.libraryresources.columbiasouthern.edu/docv iew/1565808769?accountid=33337 https://libraryresources.columbiasouthern.edu/login?url=http://s earch.ebscohost.com/login.aspx?direct=true&db=bth&AN=9569 8066&site=ehost-live&scope=site https://libraryresources.columbiasouthern.edu/login?url=http://s earch.ebscohost.com/login.aspx?direct=true&db=bth&AN=9569 8066&site=ehost-live&scope=site https://libraryresources.columbiasouthern.edu/login?auth=CAS &url=http://fod.infobase.com/PortalPlaylists.aspx?wID=273866 &xtid=48396 https://libraryresources.columbiasouthern.edu/login?auth=CAS &url=http://fod.infobase.com/PortalPlaylists.aspx?wID=273866 &xtid=48396 https://online.columbiasouthern.edu/bbcswebdav/xid- 68746833_1 MAR 3211, Consumer Behavior 3 UNIT x STUDY GUIDE
  • 44. Title Because of the large amount of marketing and advertising that consumers are exposed to on a daily basis, consumers have learned how to selectively process these stimuli through selective perception. This is done through the methods described below. efforts, not even seeing much of what is presented to them. marketing that is of interest to them. their own beliefs. We live in a very cluttered world with respect to marketing and advertising. Consumers look to unclutter with these methods of selective perception. Joseph Pine (TED, 2012) discusses how perception plays into customer buying with his TED Talk, What Do Customers Really Want? He believes that customers want to feel or perceive that what they buy is authentic. The concept of mass customization really lines up contrary to this customer need. Look at his TED Talk in the Required Reading section of this unit. Learning and memory are the next discussion points in this lesson. Comprehension, memory, and cognitive learning focus on the mental processes that occur in the consumer’s mind as he or she receives and processes the marketing stimuli. Beginning with several
  • 45. definitions, comprehension refers to the level of understanding that a consumer has about a certain stimuli. This involves both cognitive and affective elements that include both thoughts and feelings. Obviously, there are many things that will affect the level of comprehension, including the message itself, the receiver, and the environment in which the information is being received. Within the message, components could be the colors, loudness, source of the message, or even the font used. Looking at the receiver, components of this could include his or her level of intelligence, knowledge of the topic, level of involvement with the advertisement, or his or her personal expectations. Environmental components would include anything that is going on within the environment as the marketing information is being received. This could include the physical environment (i.e., situational factors) that are presented within a retail setting that the consumer may be visiting. Some retail stores use atmospherics to present a pleasing experience to their targeted customers. For example, the Hollister store creates a California-type of atmosphere with graphics, objects, and music to appeal to their target market of teenagers. The popular Bass Pro Shops creates an outdoor feel with bridges, fountains, and trees, appealing to its target market of outdoors people. Another impactful environmental issue that could influence spending levels is the state of the economy, which obviously affects discretionary spending levels. Another concept is that of framing, which suggests that the method by which the marketing is presented will actually influence the message in different ways. For example, if the label on beef states “5% fat” or “95% lean,” which would you think is more favorably perceived? Another example might be a consumer passing a sign
  • 46. that states that there are no gas stations for 25 miles. If you are driving through your hometown, this might not have as much of an impact as if you were driving through an unfamiliar area of the country. Memory is a process by which the knowledge received by the consumer is recorded and stored. At the end of the day, the goal for marketers is that consumers receive and remember the marketing message presented. The human memory system, at its basic level, consists of three areas, which are shown in the figure below. Sensory Memory • Storage of everything consumer is exposed to Workbench Memory • Short-term area where information is temporarily stored and encoded for future use Long-Term Memory • Permanent repository for information
  • 47. MAR 3211, Consumer Behavior 4 UNIT x STUDY GUIDE Title The process of sensory memory to workbench memory to long- term memory creates a flow of information that leads to learning, which activates certain consumer buying behaviors. Associated in this long-term memory area is nostalgia that refers to a desire to relive the past, typically associated with emotions. Many times, this replays itself as a preference toward objects, songs, or situations that were familiar when the consumer was younger. Why do you think this is such an effective method of marketing and advertising? Could it be that when we think of the past, we tend to remember the good times? From a marketer’s standpoint, using these images and ideas from the past is actually less costly. Additionally, it is less risky than a new idea because the marketer already knows how the image is perceived. The use of nostalgia in marketing has proven to have an incredibly large amount of positive emotional engagement as well as increased brand retention and perception. Moving beyond nostalgia, but related to memory, is the concept of social stereotypes; social stereotypes are present when consumers perceive a certain type of person to have certain roles. For instance, if the company would like to present the image of wholesomeness, it might use a celebrity such as Ellen DeGeneres who has
  • 48. the image of a nice, wholesome person. If the marketers would like to portray a wilder image, they might use a celebrity such as Justin Bieber who is perceived in a much different light. This also applies to non-celebrity people who might present an image of a rough, tough figure or maybe a more intellectual type. This could involve clothing, physical stature, personality, or a host of other characteristics that project this type of image. Marketers select celebrity endorsers and actors/actresses in their marketing campaigns carefully because their brand image and perception can be quickly confirmed or completely changed with the use of different people who hold different social stereotypes. The keys to selecting the person to appear in the marketing effort (e.g., whether it is a celebrity or not) are listed below: the target market, target market, being advertised, ly be able to influence the target market, identified by the company, and
  • 49. In order to be an effective partnership, the social stereotype must fit within the overall brand image that the company would like to present as well as align with the product/service features and benefits. Using celebrities in advertising costs companies hundreds of thousands of dollars, thus the image and perception need to be aligned perfectly. If done correctly, the use of celebrities can increase a brand’s worth exponentially. Another related area is that of neuromarketing, which is the science of human decision-making. Neuroscience is actually exiting hospitals and reaching into the marketing discipline. This science suggests that consumers do not know what they want, so asking them is not an effective method for understanding consumer buying behavior. Neuromarketing as a discipline moves beyond this and attempts to understand how marketing impacts people by observing and interpreting their emotional reactions. This is then tied to the fact that emotional processes in the brain are related to consumer behavior and ultimately consumer buying behavior. The marketer’s ability to understand their target market’s perception, learning, and memory will enable the marketer to compile and present the most effective marketing campaigns. Patrick Renvoise, presents some interesting examples of how neuromarketing can actually enhance advertising and marketing efforts (TEDx Talks, 2013). The video link is located in the Suggested Readings for this unit. References Cook, K. (2016, September 26). 12 ads that prove nostalgia is a
  • 50. powerful marketing tactic [Blog post]. Retrieved from https://blog.hubspot.com/marketing/examples- nostalgia-marketing- ads#sm.00001vgs39u582ejdwaof5b0yrwx5 TED. (2012, July 19). TEDTalks: Joseph Pine—What do consumers really want? [Video file]. Retrieved from https://libraryresources.columbiasouthern.edu/login?auth=CAS &url=http://fod.infobase.com/PortalPla ylists.aspx?wID=273866&xtid=48396 MAR 3211, Consumer Behavior 5 UNIT x STUDY GUIDE Title TEDx Talks. (2013, May 20). Is there a buy button inside the brain: Patrick Renvoise at TEDxBend [Video file]. Retrieved from https://www.youtube.com/watch?v=_rKceOe-Jr0 Suggested Reading In order to access the following resources, click the links
  • 51. below. In the following article, researchers explored earned entitlement and whether it affected the perception of fairness in the study of participants. Feng, C., Luo, Y., Gu, R., Broster, L. S., Shen, X., Tian, T., Krueger, F. (2013). The flexible fairness: Equality, earned entitlement, and self-interest. Plos ONE, 8(9), 1. Retrieved from https://libraryresources.columbiasouthern.edu/login?url=http://s earch.ebscohost.com/login.aspx?direc t=true&db=a9h&AN=90530789&site=ehost-live&scope=site The following article examines electronic word of mouth (eWOM) and how it supports social interaction and helps consumers learn about products and services found on the Internet. Lu, X., Li, Y., Zhang, Z., & Rai, B. (2014). Consumer learning embedded in electronic word of mouth. Journal of Electronic Commerce Research, 15(4), 300–316. Retrieved from https://libraryresources.columbiasouthern.edu/login?url=http://s earch.proquest.com.libraryresources.c olumbiasouthern.edu/docview/1629950036?accountid=33337 In the following video, Gilbert explains delayed gratification and how consumers think that more is better and that sooner is better than later. TED. (2012, March 15). Illusions of temporal perspective
  • 52. (Segment 8 of 13) [Video file]. Retrieved from https://libraryresources.columbiasouthern.edu/login?auth=CAS &url=http://fod.infobase.com/PortalPla ylists.aspx?wID=273866&xtid=48137&loid=132977 Click here to access the transcript for the video above. In the following video, Renvoise explains the neuroscience of marketing and how marketers are working to access the buy button in the human brain. TEDx Talks. (2013, May 20). Is there a buy button inside the brain: Patrick Renvoise at TEDxBend [Video file]. Retrieved from https://www.youtube.com/watch?v=_rKceOe-Jr0 Click here to access the transcript for the video above. https://libraryresources.columbiasouthern.edu/login?url=http://s earch.ebscohost.com/login.aspx?direct=true&db=a9h&AN=9053 0789&site=ehost-live&scope=site https://libraryresources.columbiasouthern.edu/login?url=http://s earch.ebscohost.com/login.aspx?direct=true&db=a9h&AN=9053 0789&site=ehost-live&scope=site https://libraryresources.columbiasouthern.edu/login?url=http://s earch.proquest.com.libraryresources.columbiasouthern.edu/docv iew/1629950036?accountid=33337 https://libraryresources.columbiasouthern.edu/login?url=http://s earch.proquest.com.libraryresources.columbiasouthern.edu/docv iew/1629950036?accountid=33337 https://libraryresources.columbiasouthern.edu/login?auth=CAS &url=http://fod.infobase.com/PortalPlaylists.aspx?wID=273866
  • 53. &xtid=48137&loid=132977 https://libraryresources.columbiasouthern.edu/login?auth=CAS &url=http://fod.infobase.com/PortalPlaylists.aspx?wID=273866 &xtid=48137&loid=132977 https://online.columbiasouthern.edu/bbcswebdav/xid- 68746837_1 https://www.youtube.com/watch?v=_rKceOe-Jr0 https://online.columbiasouthern.edu/bbcswebdav/xid- 68746832_1 Business Review Q3 2014 9www.philadelphiafed.org BY LEONARD NAKAMURA I Leonard Nakamura is a vice president and economist at the Federal Reserve Bank of Philadelphia. The views expressed in this article are not necessarily those of the Federal Reserve. This article and other Philadelphia Fed reports and research are available at www. philadelphiafed.org/research-and-data/publications. Hidden Value: How Consumer Learning Boosts Output This disconnect has implications for policy. Economists are more famil-
  • 54. iar with how learning makes us better workers by increasing our productiv- ity, typically reflected economywide in higher inflation-adjusted wages and output per capita. However, how learning makes us better consumers is less likely to be captured by official measures of consumption and out- put. To the extent that these statistics might be imprecise, economists are liable to be led astray in assessing the economy’s successes and failures, and policymakers may be misled in decid- ing which actions to adopt. But how can one measure the im- pact of consumer learning on the well- being of households? First, we need to explore just how learning affects value. Then we will turn to theories of con- sumer preferences and behavior that take learning into account. They may point us toward more accurate ways to estimate inflation and output growth than measuring prices directly. MORE BENEFIT PER DOLLAR SPENT In this era of rapid innovation and creativity, consuming so many new products typically involves learn- ing both before and after we purchase them for the first time. Acquiring in- formation about a product we haven’t
  • 55. bought before is so automatic that we may hardly notice it as an economic phenomenon. Indeed, if the product is novel, we must acquire at least some information: First we find out that the product exists and then what its char- acteristics and performance are like. This information acquisition in turn lowers the risk associated with any given purchase and, on average, will raise the amount of pleasure or use we get from it. Consider all the information avail- able to help us decide to see a movie. We can look at trailers in the theater or online; we can read reviews and compare the number of stars the movie gets from critics or fellow moviegoers; and we can ask our friends. Similarly, when deciding on a restaurant, we can consult online sources like Yelp, Zagat, or Chowhound; we can examine the menu and prices; we can read a review in the local paper; and we can listen to our friends’ suggestions. All this information-gathering raises the prob- ability that we will enjoy the movie or restaurant more than if we had chosen blindly. When we take the time to find out more information, we are able to select products most suited to our tastes and will generally experience higher satisfaction per dollar spent, given a fixed menu of choices, than we
  • 56. otherwise would. Raising our satisfac- tion per dollar may also make us more willing to buy more products within that category. A second layer of benefits occurs through use: Using the features on my e-mail or word processing program becomes second nature as, one by one, I try out new tasks. This form of learning-by-doing raises the product’s value in later uses; once I know that a feature exists and how to use it, I can more quickly find it and use it. As I learn to use my smartphone by phones. Ipads. Wikipedia. Google Maps. Yelp. TripAdvisor. New digital devices, applications, and services offer advice and information at every turn. The technology around us changes fast, so we are continually learning how best to use it. This increased pace of learning enhances the satisfaction we gain from what we buy and increases its value to us over time, even though it may cost the same — or less. However, this effect of consumer learning on value makes inflation and output growth more difficult to measure. As a result, current statistics may be undervaluing household purchasing power as well as how much our economy produces, leading us to believe that our living standards are declining when they are not.
  • 57. 10 Q3 2014 Business Review www.philadelphiafed.org making a call or finding a destina- tion or taking a picture or watching a video clip, using it becomes faster and more successful.1 Moreover, with cheap memory and computing power, we can customize the devices and applications to our needs. Using an application can also result in a valuable history to tap later: The letters I have written and the PowerPoint slides I have produced in the past may have pieces that I can insert into new e-mails and presenta- tions. In many cases, the application has the ability to learn our habits and guide us to better choices, sometimes using the preferences of other users who make choices similar to ours. For example, Netflix looks at our past movie choices to suggest new ones. What is economically significant about this form of learning is that the product is the same, but we value it more. Yet, standard measures of economic output miss this increase in value because the product appears unchanged. As a result, statistics measuring overall consumption may be too low.2 For example, let’s consider how we value an Internet connection. Entre- preneurs keep developing search en-
  • 58. gines, aggregators, instructional sites, and various applications that make our use of the Internet more efficient. Plus, smartphones and tablets make it easier to connect whenever we want and wherever we are. All of this infor- mation allows the smart consumer to choose movies, TV shows, restaurants, and a myriad of consumer products and services that are more to our lik- ing. The cost of the better information that helps us make these better choices has fallen, allowing us to derive greater satisfaction from what we buy. Thus, our knowledge of the Internet enhanc- es the value of — and spurs the devel- opment of — new ways to reach it. Yet, so much of the content on the Internet — videos, TV shows, music, and social media — is available at no extra cost. So, as we learn about the Internet, we use our connection to it more intensively, but we don’t pay more. The Internet connection itself is unchanged; what is changed is the content and interactions it gives us access to. Because if the satisfaction we gain from the Internet connec- tion is greater, we would be willing to pay more for it. But if the market for Internet connections is competitive, we don’t have to: Competition prevents providers from charging more as Inter-
  • 59. net offerings expand, so we get more value for the same amount of money. But does this improvement in our welfare show up in measures of real consumption and growth? Typically not. The monthly fee we pay to the In- ternet service provider this year is buy- ing more for us than the monthly fee we paid five years ago. If the fee has gone up, we measure this as pure infla- tion: The price of “Internet services and electronic information providers” in the U.S. Bureau of Labor Statistics’ consumer price index (U.S. CPI) has gone up at an annual rate of 1 percent. But if the satisfaction we have gained as we use the Internet more intensively has gone up, then this is not the right measure of our inflation rate, since the quality of the service has risen and we get more for the price. Similarly, our cable TV bills (as measured in the U.S. CPI index of “ca- ble and satellite TV and radio”) have risen at an average annual rate of just over 2 percent over the past five years. Does this rate fully reflect the greater value we derive from cable service? When we first use cable TV, we may know only a few channels. Over time, as we channel-surf and learn more about the content shown on different
  • 60. channels, we may become attached to three or four channels we didn’t know about before. As a result, access to cable TV becomes more valuable to us. But how can we measure that value? MEASURING THE VALUE OF INFORMATION Consider a traveler planning to go to a foreign city for the first time. Initially, the traveler sees that hotels A and B are equally priced and have sim- ilar luxury levels as measured by that country’s rating scheme. But the In- ternet allows the traveler to see reviews from other travelers, detailed maps of the hotels’ locations, and lists of the hotels’ amenities. Let’s say that the more knowledgeable concierge at hotel B is worth $10 a day to the traveler. Learning about the concierge over the Internet makes the traveler better off by $5: In the absence of this informa- tion, the traveler would have chosen randomly between the two hotels and would have gotten the good concierge half the time, for an expected value of $5. But with the information obtained from the Internet, the traveler gets 1 Although this article does not explore the notion, it must be admitted that there is a countervailing truth: Our existing knowledge may become outmoded at a faster rate as new technologies race at us. This depreciation of
  • 61. our knowledge is a cost of rapid technological progress but is also something we have difficulty measuring. 2 Another interesting implication of consumer learning is that it may be one reason that so- called early adopters are willing to pay a higher initial price for the latest technology. Even though they realize the price will drop later, they know they will become better off as they learn more about the product. Does this improvement in our welfare show up in measures of real consumption and growth? Typically not. Business Review Q3 2014 11www.philadelphiafed.org the good concierge all the time, for an expected value of $10. With better knowledge, the traveler gets more satis- faction from the same set of choices at the same price. Here we can quantify the improvement as $5. The traveler knows how much to value the con- cierge and would have been willing to pay $10 more to stay at that hotel than at the other. But measuring this value may require new methods. Statistical agencies charged with measuring
  • 62. prices usually simply ask the hotels what prices they charge. Instead, an agency might have to survey consum- ers to elicit these evaluations. Alter- natively, Internet-savvy hotel opera- tors or tourist organizations could do experiments to elicit the extent to which customers are willing to pay more for superior information. The effect of learning on value isn’t limited to technology. For in- stance, learning to play an instrument often deepens our understanding and enjoyment of music. The information we gain isn’t only steering us to the music we prefer; it also deepens our appreciation of the music. We make a human capital investment that im- proves our ability to consume, similar to a long-term investment in a home or an education that makes us better able to earn a living. Here we might wish to quantify the investment in infor- mation that consumers make in order to quantify the value of the informa- tion, in the same way that we might measure a consumer’s investment in a home or a car. To analyze consumption when learning is occurring, let’s first explore some underlying theory regarding esti- mating changes in prices and output. This theory will allow us to construct a stable “utility function,” a method of
  • 63. representing consumer preferences that permits us to assume that there are bundles of products and services across which a consumer is indifferent: He or she would be just as happy with one bundle as another. It is this assumption — that we can find bundles of products across which consumers are indifferent — that economists rely on to estimate inflation and economic growth. We will then discuss how behavior is dif- ferent in situations in which learning is occurring and how these changes in behavior influence pricing and welfare. GENERALIZED UTILITY FUNCTION THEORY In a classic 1977 article, “De Gus- tibus Non Est Disputandum,”3 George Stigler and Gary Becker argue that human tastes are fundamentally the same; they “neither change capri- ciously nor differ importantly between people.” Where it appears that tastes vary, Stigler and Becker widen the notion of consumer preferences from specific goods and services to broad, unchanging categories that they call commodity objects of choice. These stable preferences have goods and ser- vices as inputs, but also the consumer’s time and human capital such as educa- tion and the acquisition of informa- tion. Thus, individuals can actively
  • 64. shape the satisfaction they derive from specific goods and services by obtain- ing knowledge. But Stigler and Becker point out that this broader way of look- ing at preferences changes the nature of income and prices. Stable preferences are key to measuring inflation. Ordinarily, if we can identify bundles of consumer goods and services about which a consumer is indifferent in two succes- sive years, this starts us on the way to estimating inflation and output growth between the two years. We first look at what the consumer actually bought in the first year and then ask how much that exact set of goods and ser- vices would cost in the second year. This provides us with a measure of the rate of inflation the consumer faces. Alternatively, we can measure the set of goods and services the consumer actually bought in the second year and ask how much that set would have cost in the first year. This second measure of inflation is typically lower than the first one.4 We can use either measure, or we can average the two. If we believe that consumers have stable preferences over these prod- ucts — that is, more or less unchang- ing utility functions — then we can say that if consumers’ incomes in the
  • 65. first year rise at the rate of inflation, consumers could afford to buy approxi- mately the same goods and services they had bought the year before and are just as well off. We then can say that their real incomes haven’t changed. If their incomes are 2 per- cent higher than the rate of inflation, we say that their real incomes have risen by 2 percent, because they can buy 2 percent more than they could the year before. But if consumers’ util- ity functions change over time, this claim might become dubious: If last year I liked fish and bought a lot of it, and this year I don’t like it as much but still buy a lot because it is cheap, then I may be worse off, though I am buying the same amount. To be sure, our preferences may fluctuate; I may prefer fish one year, meat another. But these back-and-forth changes may not matter to our overall measures if these fluctuations cancel out — for every individual who likes fish less, another likes it more. What Stigler and Becker were concerned with were systematic changes in taste. 3 Translatable as “There’s No Arguing About Taste.” 4 The bundle bought in the second year is typically cheaper because goods and services increase in price at different rates, and consum-
  • 66. ers tend to buy less of the more expensive goods. So the second year’s purchases will typically have fewer of the goods whose prices rose more rapidly. 12 Q3 2014 Business Review www.philadelphiafed.org The generalized utility func- tion is stable. To demonstrate how underlying preferences may be seen to be stable, Stigler and Becker cite what appears to be an example of a changing utility function: addiction — the phe- nomenon that “smoking of cigarettes … or close contact with some person over an appreciable period of time often increases the desire (craving) for these goods or persons.” But if we re- formulate the specific product cigarettes into the broader commodity smoking, or close contact into the commodity lov- ing, perhaps we can understand them as stable human behaviors.5 Citing Alfred Marshall’s example of music — “The more good music a man hears, the stronger is his taste for it likely to become.” — Stigler and Becker argue that an individual can accumulate “consumption capital” in music, so that, for instance, buying tickets to a concert at one point in time increases the satisfaction derived from further consumption of music
  • 67. later. Thus, just as workers can invest in education to enhance their produc- tivity at making objects or providing services, so can consumers invest in education to enhance their enjoyment of certain goods and services. This in- creasing satisfaction can be understood as “rational addiction,” in that consum- ers can understand and predict ratio- nally how their consumption in one period may affect their consumption in future periods. Thus, I can decide not to consume a drug that I know I will enjoy this period but that will induce a craving in future periods, when I will enjoy it less. Another implication of this perspective is that when we are young, we may not like a certain type of music very much initially, but we may realize that we will gain human capital that will make the early invest- ment worthwhile in retrospect. Note that a given act of consump- tion — for example, listening to or playing music — may have both an aspect of direct consumption (our current enjoyment) and an aspect of investment (how our current con- sumption affects our future enjoy- ment). Both aspects increase our current willingness to pay for the item. This makes for interesting dynam- ics over time. As we age, the period over which our investment will pay
  • 68. off shortens, but our enjoyment rises because of past learning. Eventually, though, our rate of learning and the rate of increase in enjoyment slow down, so we are less willing to pay because the investment value is falling, even though our direct enjoyment is still increasing. As we become more willing to pay for something, do we have to pay a higher price? A drug dealer may offer the first dose of a drug for free, in hopes the customer becomes ad- dicted. This depends on there being some likelihood that the person offered the free drug will remain a customer of the dealer, so that the addiction can be exploited. If the producer has a monopoly on the good whose value to us has increased, then the price may rise over time. This may be why pharmaceuticals under patent typically rise in price faster than inflation. Even absent monopoly, learning is one of the main reasons why customers may find it difficult to switch from one supplier to another.6 MEASURING INFLATION AND OUTPUT There are two ways in which we can be better off economically: We can
  • 69. have more products and services, or we can make better use of what we already have. It is easier, however, to measure quantity than quality. To think this through, consider how we currently measure output and inflation. Suppose I spent $20,000 on consumer goods and services in 2013 and $21,000 in 2014. Is my well-being higher in 2014 than it was in 2013? The test that economists normally use is to ask whether I could have bought the same goods and services in 2014 as I bought in 2013. If so, I must be at least as well off, because I could have bought the same goods but didn’t. Therefore, I must have preferred the goods I did buy to the goods I didn’t, since I can freely choose what I buy. So I strictly prefer what I consumed this year to what I consumed last year. However, as we have seen, when consumers learn about a product, it 5 In another example they explore, Stigler and Becker view advertising as a means of providing information to consumers that improves their perceived benefit from the product being ad- vertised. In this case, the maker of the product provides information that changes the value of the commodity consumed. They also discuss fads and fashions and the role of culture and
  • 70. traditions in the formation of tastes. See my Business Review article on advertising for further discussion. Just as workers can invest in education to enhance their productivity at making objects or providing services, so can consumers invest in education to enhance their enjoyment of certain goods and services. 6 As we use products and services, our learning may result in what are known as increased switching costs. See Paul Klemperer (1995), Carl Shapiro and Hal Varian (1999), and Luis Cabral (2014), among others. Business Review Q3 2014 13www.philadelphiafed.org can provide more satisfaction than it did initially. In this case, we may want to consider my consumption as having increased, even though what I consumed did not change physically. But if the good or service in question is unchanged, how do we measure the increased satisfaction it offers, that is, its increased utility? There are at least two routes that we might take.
  • 71. Consumer investment in consumption. One view is that in learning about, say, music, consumers are investing by directly raising the sat- isfaction they receive from music. In principle, an investment in consump- tion is no different from an investment in durable consumer goods, such as cars and refrigerators, or in real estate, such as a single-family home. Any in- vestment is expected to return value to the investor — either in cash or well- being — over an extended period. If we are learning about a tech- nology that we expect will be around for a long time, then our learning may be valuable for a long time. Just as an investment in understanding music is likely to bear fruit over an entire life- time, so may an investment in touch- typing, which enhances the speed and accuracy with which we can write e- mails and Internet posts. Even though the specific items we purchase — PCs, tablets, smartphones — may last only a few years, touch-typing is valuable in using all of those products and may enhance our ability to communicate over many years. So to measure the increased satis- faction gained from such a consump- tion investment, we want to measure both the money and the time invested. Then we want to estimate the rate of
  • 72. return on those investments. Because we need to know over what period of time the investment will create returns and how much consumers value those returns, we have to survey consumers. Willingness to pay. Alternatively, we can attempt to directly measure how the consumer’s willingness to pay has changed. For example, if the price of a good rises and the consumer consumes as much of that good as she did previously, or if the price remains the same and the consumer consumes more of the good, then we may be able to measure an increase in the consum- er’s willingness to pay. Consider pharmaceuticals. Sup- pose the efficacy of a drug improves over time as doctors and patients share information about its effects and as treatment regimens are fine- tuned accordingly. We may be able to directly measure the drug’s increased value to both doctor and patient as a result of this social learning. A similar case can be made for medical procedures. An interesting possibil- ity is that a given intervention — for example, use of a checklist in anes- thesiology or surgery — may result in a widespread improvement in the quality of medical care.7 Again, as the intervention becomes widely ad- opted, we may be able to measure the
  • 73. joint value of this social learning as the quality of a variety of treatments (different surgeries, say) improves. CONCLUSION Does measuring the benefits — and the costs — of consumer learning matter, particularly if they are difficult to measure accurately? Even if econo- mists cannot put numbers on them, it is important to understand the limits of what can be measured. If we cannot measure the improvement in our well- being from learning about products, then we underestimate our progress as consumers, and we overestimate both the rate of inflation and the increase in income necessary to keep our wel- fare constant. We may think that liv- ing standards are falling when they are, in fact, rising. After all, when we dis- cuss how we might raise productivity or consumer welfare, we typically rely on our existing measures of output and inflation. But to the extent that we think we might be getting this measure wrong, we might decide to temper or slant our objectives. For example, how we think of price stability is tempered by beliefs that our inflation measures are likely subject to a measurement bias, and we have a rough idea of the size of that measurement bias. As a consequence, a small but positive in-
  • 74. flation rate may be viewed as achieving price stability. But it would clearly be desirable if economic statistics measured output and inflation more accurately. The report of the Commission on the Mea- surement of Economic Performance and Social Progress seeks to move na- tional statistical measures closer to an ideal measure of progress in national well-being. The commission’s report points out that policymakers and others use these statistics to measure economic success. To the extent that current statistics are biased, policy- makers are liable to be led astray. Thus, it would be valuable to consider how best to measure the impact of education, learning, and information on the well-being of households and to incorporate these measurements into our statistics. As new technology and learning make measuring inflation and output growth more difficult, we may not be able to rely on direct price measures; rather we may have to use surveys or econometric methods to estimate inflation and growth. BR 7 Atul Gawande, a surgeon and journalist, has written about this in his book The Checklist Manifesto.
  • 75. 8 See Stiglitz, Sen, and Fitoussi. REFERENCES www.philadelphiafed.org14 Q3 2014 Business Review Cabral, Luis. “Dynamic Pricing in Custom- er Markets with Switching Costs,” working paper (April 2014), http://luiscabral.org// economics/workingpapers/scostsApril2014. pdf. Gawande, Atul. The Checklist Manifesto. New York: Metropolitan Books, 2009. Klemperer, Paul. “Competition When Consumers Have Switching Costs: An Overview with Applications to Indus- trial Organization, Macroeconomics, and International Trade,” Review of Economic Studies, 62 (1995), pp. 515-39. Marshall, Alfred. Principles of Economics. London: Macmillan, 1890. Nakamura, Leonard. “Intangible Invest- ment and National Income Account- ing: Measuring a Scientific Revolution,” Review of Income and Wealth, S1 (2010), pp. 135-155. Nakamura, Leonard. “Underestimating Advertising: Innovation and Unpriced Entertainment,” Federal Reserve Bank
  • 76. of Philadelphia Business Review (Fourth Quarter 2005). Shapiro, Carl, and Hal R. Varian. Infor- mation Rules. Boston: Harvard Business School Press, 1999. Stigler, George, and Gary S. Becker. “De Gustibus Non Est Disputandum,” Ameri- can Economic Review, 67 (1977), pp. 76-90. Stiglitz, Joseph, Amartya Sen, and Jean- Paul Fitoussi. Report of the Commission on the Measurement of Economic Performance and Social Progress (2009). ���������� �� ���������� �� � � ������� � � ���� ���� �� ������������ ��� ������ �� ��� ����������� 32 KITCHEN & BATH DESIGN NEWS | APRIL 2011
  • 77. www.KitchenBathDesign.com Consumer Insights Your customers are irrational. Right, you might be thinking. Tell me something I don’t know. The good news is, consumers are irrational in predictable ways, and understanding that can help your business, from marketing to setting prices to offering choices. “…consumers don’t in fact have a good handle on their own preferences and the prices they are willing to pay for different goods and experiences,” writes Duke University’s behavioral economist Dan Ariely in his book, Predictably Irrational. It’s all relative. And we can influence consumer perceptions through relativity. Ariely explains, “We don’t have an internal value meter that tells us how much things are worth. Rather, we focus on the relative advantage of
  • 78. one thing over another and estimate value accordingly.” So, a prospect may not know how much a six-burner professional range is worth, but will assume it costs more than a four-burner range. Most people don’t know what they want unless they see it in context. Consumers don’t know what kind of cabinets they want until they see a finely glazed finish on an exotic wood grain, and compare it to a white foil door. Homeowners don’t know they want a large shower with multiple jets, a seat and a light until they compare it to a stall with one showerhead and no light. They don’t understand the benefits of a quiet vent until they hear it next to a louder one. PRICING CONTEXT Our job is to create the context for decision-making. Given three price choices, most people will take the middle one. So, decide what you want to sell, and then offer a higher priced and lower priced option. Make your margins the best on the middle one. If there are only two options, people tend to choose the least expensive.
  • 79. Introducing a higher priced option can generate more revenue. Not that people generally buy the highest priced item. But they will often select the second highest. A consultant found a restaurant boosted revenue by creating a new, expensive dish. People then began buying the second most expensive entree, which previously had been passed over because it was the most expensive. Want to sell more $700 sinks? Be sure you have ones that are $900. Consumers like to make decisions based on comparisons. And they want to focus on things that are easily comparable. Introducing a decoy choice, Ariely explains, helps them do that. You show a client three kitchens, all about the same price. One is contemporary, the other two are traditional. The two traditional kitchens are very similar except one has an island and one does not. The ‘decoy’ is the kitchen without the island.
  • 80. Consumers will approach the decision this way, Ariely says. They will dismiss the contemporary kitchen because they have nothing to compare it to. They will focus on the two similar kitchens. And of those two, clearly the one with the island is the better choice. So you have helped the consumer make a choice. (This assumes, of course, that you know the consumer wants traditional.) Providing comparisons is especially important if you’re introducing a new product. Say you’re going to offer bidets. You bring in one model at $550. Nothing happens. But then you add an $800 model. Now, the first bidets begin selling. Why? “Because people have two models to choose from, they could make an easier decision. They are not making a decision in a vacuum,” Ariely explains. RELATIVITY & ANCHORS Relativity works in another way, too. People will drive across town to save $7 on a $25 item, but will not make the drive to save $7 on a $455 purchase. It makes no rational sense, since it’s the same amount of money. But the $7 is relatively larger to $25 versus $455. So clearly on a
  • 81. larger ticket item, you have some price flexibility. Once people have committed to a $75,000 kitchen, it’s relatively easy to get them to decide on a $700 special faucet. But if they are just replacing a $200 faucet, they may be unlikely to spend that much. The relative additional cost of the faucet is small in the context of a big project. But a few dollars will make a difference if it’s just a replacement. How do consumers know what a faucet costs? They learn through manufacturers’ suggested retail prices, ads and promotions. Market prices themselves influence consumers’ willingness to pay, Ariely says. This sets the anchor by which consumers judge prices in a category. Price tags are not necessarily anchors, though, notes Ariely. If a consumer sees a faucet for $1,500, it only becomes a relevant anchor if the consumer considers actually buying a faucet at that price. “From then on, we are willing to accept a range of prices, but… we always refer back to the original anchor. The first anchor influences
  • 82. not only the immediate buying decision but many others that follow,” Ariely stresses. Understand the context in which your client operates. Where have they looked? What brands have they considered? Where might their anchors be? Anchors can drive decisions for years. Remembering what their first kitchen cost will affect what prospects are willing to pay. Find out how recently your prospects have done a kitchen or bath. What pricing are they likely to have in their minds as an anchor? “Once a choice is made on how we’re going to spend money, we tend to repeat it over and over,” Ariely writes. So how is a new anchor set? By creating a new experience, the old anchor no longer applies. That’s how Starbucks set a new anchor for the price of coffee – by changing the experience. If a consumer goes to a big box store and then a high-end showroom, their anchors could change because the experience is
  • 83. so different. But if they go from one big box store to another that offers a similar experience, their anchors will stay the same. When it comes to pricing, one of the biggest emotional hot buttons is the word free. “Free gives us such an emotional charge that we perceive what is being offered as immensely more valuable than it really is,” Ariely observes. For example, which is the better choice – a free $10 gift certificate or a $20 gift certificate for $7? Most people choose the first option, even though the second option provides greater profit ($13 vs. $10). A free dishwasher won’t get people to come in and buy a kitchen. But if they’re deciding between you and someone else, the free dishwasher will often sway them. “Free” can encourage add-on purchases, i.e. offer a free towel bar if a bath customer buys a group of accessories (paper holder, toothbrush holder, tissue box, etc.). Having a showroom seminar or cooking demo? Be sure to say “Free!” In-depth descriptions can influence expectations, too.
  • 84. Consider “a stainless steel six-burner range” versus “a finely crafted, heirloom-quality cooking appliance created in the centuries old French gourmand tradition.” Which creates higher expectations? “Marketing is all about providing information that will heighten someone’s anticipated and real pleasure,” Ariely concludes. Tips for Infl uencing Consumer Perceptions Leslie Hart Consumer Insights www.kitchenbathdesign.com Read past columns and features and send us your comments about this article and others by logging onto the Kitchen & Bath Design News Web site: kit h i il t ’ illi t Consumers are irrational in predictable ways, and understanding that can help your business, from marketing to setting prices to offering choices.
  • 85. ConInsights KBD 0411.indd 32 3/21/11 12:51 PM Reproducedwithpermissionofthecopyrightowner.Furtherreproduc tionprohibitedwithoutpermission. I'm going to talk about a very fundamental change that is going on in the very fabric of the modern economy. And to talk about that, I'm going to go back to the beginning, because in the beginning were commodities. Commodities are things that you grow in the ground, raise on the ground or pull out of the ground: basically, animal, mineral, vegetable. And then you extract them out of the ground, and sell them on the open marketplace. Commodities were the basis of the agrarian economy that lasted for millennia. But then along came the industrial revolution, and then goods became the predominant economic offering, where we used commodities as a raw material to be able to make or manufacture goods. So, we moved from an agrarian economy to an industrial economy.
  • 86. Well, what then happened over the last 50 or 60 years, is that goods have become commoditized. Commoditized: where they're treated like a commodity, where people don't care who makes them. They just care about three things and three things only: price, price and price. Now, there's an antidote to commoditization, and that is customization. My first book was called "Mass Customization" -- it came up a couple of times yesterday -- and how I discovered this progression of economic value was realizing that customizing a good automatically turned it into a service, because it was done just for a particular person, because it wasn't inventoried, it was delivered on demand to that individual person. So, we moved from an industrial economy to a service-based economy. But over the past 10 or 20 years, what's happened is that services are being commoditized as well. Long-distance telephone service sold on price, price, price; fast- food restaurants with all their value pricing; and even the Internet is commoditizing not just goods, but services as well. What that means is that it's time to move to a new level of economic value. Time to go beyond the goods and the services, and use, in that
  • 87. same heuristic, what happens when you customize a service? What happens when you design a service that is so appropriate for a particular person -- that's exactly what they need at this moment in time? Then you can't help but make them go "wow"; you can't help but turn it into a memorable event -- you can't help but turn it into an experience. So we're shifting to an experience economy, where experiences are becoming the predominant economic offering. Now most places that I talk to, when I talk about experience, I talk about Disney -- the world's premier experience-stager. I talk about theme restaurants, and experiential retail, and boutique hotels, and Las Vegas -- the experience capital of the world. But here, when you think about experiences, think about Thomas Dolby and his group, playing music. Think about meaningful places. Think about drinking wine, about a journey to the Clock of the Long Now. Those are all experiences. Think about TED itself. The experience capital in the world of conferences.
  • 88. All of these are experiences. Now, over the last several years I spent a lot of time in Europe, and particularly in the Netherlands, and whenever I talk about the experience economy there, I'm always greeted at the end with one particular question, almost invariably. And the question isn't really so much a question as an accusation. And the Dutch, when they usually put it, it always starts with the same two words. You know the words I mean? You Americans. They say, you Americans. You like your fantasy environments, your fake, your Disneyland experiences. They say, we Dutch, we like real, natural, authentic experiences. So much has that happened that I've developed a fairly praticed response, which is: I point out that first of all, you have to understand that there is no such thing as an inauthentic experience. Why? Because the experience happens inside of us.
  • 89. It's our reaction to the events that are staged in front of us. So, as long as we are in any sense authentic human beings, then every experience we have is authentic. Now, there may be more or less natural or artificial stimuli for the experience, but even that is a matter of degree, not kind. And there's no such thing as a 100 percent natural experience. Even if you go for a walk in the proverbial woods, there is a company that manufactured the car that delivered you to the edge of the woods; there's a company that manufactured the shoes that you have to protect yourself from the ground of the woods. There's a company that provides a cell phone service you have in case you get lost in the woods. Right? All of those are man-made, artificiality brought into the woods by you, and by the very nature of being there. And then I always finish off by talking about -- the thing that amazes me the most about this question, particularly coming from the Dutch, is that the Netherlands is every bit as manufactured as Disneyland. (Laughter) And the Dutch, they always go ... and they realize, I'm right! There isn't a square meter of ground in the entire country that
  • 90. hasn't been reclaimed from the sea, or otherwise moved, modified and manicured to look as if it had always been there. It's the only place you ever go for a walk in the woods and all the trees are lined up in rows. (Laughter) But nonetheless, not just the Dutch, but everyone has this desire for the authentic. And authenticity is therefore becoming the new consumer sensibility -- the buying criteria by which consumers are choosing who are they going to buy from, and what they're going to buy. Becoming the basis of the economy. In fact, you can look at how each of these economies developed, that each one has their own business imperative, matched with a consumer sensibility. We're the agrarian economy, and we're supplying commodities. It's about supply and availability. Getting the commodities to market. With the industrial economy, it is about controlling costs -- getting the costs down as low as possible so we can offer them to the masses. With the service economy, it is about improving quality. That has -- the whole quality movement has risen with the
  • 91. service economy over the past 20 or 30 years. And now, with the experience economy, it's about rendering authenticity. Rendering authenticity -- and the keyword is "rendering." Right? Rendering, because you have to get your consumers -- as business people -- to percieve your offerings as authentic. Because there is a basic paradox: no one can have an inauthentic experience, but no business can supply one. Because all businesses are man-made objects; all business is involved with money; all business is a matter of using machinery, and all those things make something inauthentic. So, how do you render authenticity, is the question. Are you rendering authenticity? When you think about that, let me go back to what Lionel Trilling, in his seminal book on authenticity, "Sincerity and Authenticity" -- came out in 1960 -- points to as the seminal point at which authenticity entered the lexicon, if you will. And that is, to no surprise, in Shakespeare, and in his play, Hamlet.
  • 92. And there is one part in this play, Hamlet, where the most fake of all the characters in Hamlet, Polonius, says something profoundly real. At the end of a laundry list of advice he's giving to his son, Laertes, he says this: And this above all: to thine own self be true. And it doth follow, as night the day, that thou canst not then be false to any man. And those three verses are the core of authenticity. There are two dimensions to authenticity: one, being true to yourself, which is very self-directed. Two, is other-directed: being what you say you are to others. And I don't know about you, but whenever I encounter two dimensions, I immediately go, ahh, two-by- two! All right? Anybody else like that, no? Well, if you think about that, you do, in fact, get a two-by-two. Where, on one dimension it's a matter of being true to yourself. As businesses, are the economic offerings you are providing -- are they true to themselves? And the other dimension is: are they what they say they are to others? If not, you have, "is not true to itself," and "is not what it says it is," yielding a two-by-two matrix.