
Recommended
More Related Content
Similar to Waterworks - The Bengaluru story
Similar to Waterworks - The Bengaluru story (20)
More from biometrust
More from biometrust (20)
Recently uploaded
Recently uploaded (20)
Waterworks - The Bengaluru story
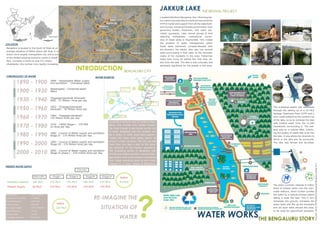
- 1. BUDDHI SCOOL JAKKUR LAKE ROHAN’s house rainbow drive CLASSIC ORCHIDS water worksthe bengaluru story LOCATION Futurarc 2015/ K9792564/Professional/Bengaluru/Page no:1 akratvathi source krs reservoir on cauvery proposed pipeline from wtp proposed pipeline inside city kabini reservoir Water sources 1890 - 1900 1896 - Hessargatta Water supply and sanitation - Untreated water 1900 - 1930 Hessargatta - Combined jewel filters 1930 - 1940 Thippagondanahalli Arkavathi WSS - 27 Million litres per day 1950 - 1960 1952 - Thippagondanahalli Arkavathi - 45 Million litres per 1960 - 1970 1964 - Thippagondanahalli - 135 Million litres per day 1970 - 1980 1974 - CWSS Stage I - 135 Milli on litres per day 1980 - 1990 1990 - 2000 1993 - Council of Water supply and sanitation Stage III - 270 Million litres per day 1982 - Council of Water supply and sanitation Stage II - 135 Million litres per day 2000 - 2010 2002 - Council of Water supply and sanitation Stage IV phase I - 270 million litres per day CHRONOLOGY OF WATER re-imagine the situation of water? Arkavathy Cauvery Stage I Stage II Stage III Stage IV 149 MLD 60 MLD 135 MLD 135 MLD 300 MLD 270 MLD 135 MLD 135 MLD 270 MLD 270 MLD Present water supply Installed Capacity Present Supply Service Area Population as on 2008 Present Demand Present Supply Per capita supply Water allocation Already utility Complete utilisation : 800.29 Sq.Km :7.5 Million :1125 MLD :900 MLD :110 to 120 litres :19 TMC :12 TMC :2012-2013 Bangalore is located to the South of India at an average elevation of 900m above sea level, it is India’s third largest metropolitan city and is one of the fastest growing economic zones in South Asia. Currently a home to over 9.5 million inhabitants, this number only rapidly increasing. Deficit Deficit 59 MLD 225 MLD Currently a home to over 9.5 million inhab- itants, this number only rapidly increas- ing. Even though it was known as the city of lakes, Bangalore has the costliest wa- ter in India. In 1960, there were approxi- mately 282 lakes while today, barely 34 remain in their full glory. The city has lost more than one lake a year to the grow- ing demands of the human population. The undulating terrain of Bangalore with its hills and valleys provide a natural drain- age pattern with small streams originating from ridges cascading down to form major streams in 3 major valleys of Bangalore. LocatedinNorthernBangalore,the1.5kmlongJak- kur Lake is one example of a tank revived using the STIFLE model and support from all the stakehold- ers involved, including the state government, local governing bodies, fishermen, end users (do- mestic purposes), Lake revival groups & bird watching enthusiasts. Institutional owner- ship of these lakes is fragmented. This makes the problem of water management within these lakes extremely complex.Blessed with bio-diversity, the Jakkur lake also has several wells surrounding it that cater to the domestic needs of the residents in the area. Fishermen make their living by selling fish that they ob- tain from the lake. The lake is also culturally and spiritually significant for the people in this area. The ecological aspect was addressed through the setting up of a 10 MLD Sewage Treatment Plant (STP) and a man-made wetland at the northern tip of the lake, so as to recharge the lake with treated water from the 12,500 households surrounding it. The wet- land acts as a natural filter, improv- ing the quality of water that is let into the lake. It also allows bio-diversity to thrive in the lake and its surrounds. The lake was fenced and de-silted. The plant currently releases 8 million litres of treated water into the man- made wetland, which further purifies the water by a natural process before letting it enter the lake. This in turn recharges the ground, increases the water table and fills up the borewells and old open wells around this area. to be used for agricultural purposes. Jakkur lake The revival project Introduction bengaluru city
- 2. N water worksthe bengaluru story RAINBOW DRIVEre-imagining water sources Futurarc 2015/ K9792564/Professional/Bengaluru/Page no:2 More than 360 recharge wells, on an av- erage 3 feet in diameter and of depth 20 feet, have been created. water pricing = water consumption rain water harvesting rain water harvesting community bore wells water tariff phytorid stp phytorid sEWAGE tREATMENT pLANT Ground water table after Ground water table before COMMUNITY BORE WELL AQUIFER :before AQUIFER :after Rainbow Drive is a 36acre neighborhood with 430 plots located in south east Bangalore. The sloped land posed a challenge for the residents due to exces- sive flooding during monsoon. Also, due to lack of connectivity to the municipal water supply, the resi- dents depended on ground water from borewells for their daily consumption.As a result of the scarcity and flood- ing , they opted to conserve, reuse and recycle water through rainwater harvesting, recharge wells and a Phytoroid sewage treatment plant. This was done by creating a layout association that worked collaboratively. recharge well lid storm water jali Water meters are installed at overhead tanks and at household levels, which monitored the inflow and outflow of water supply and usage respec- tively. This in-turn helped in tabulating a new water tarrif for the layout. storm water drains before storm water drains after WATER METER REDUCTION IN WATER USAGE, metering heLPED IN CALCULATING CONSUMPTION AND ARRVIE AT A TARRIF >40 KL 30-40KL 20-30 KL 10-20 KL 0-10 KL Rs.40 per KL Rs.10 per KL Rs.60 per KL Rs.25 per KL Rs.15 per KL Rs.20 per KL area : 14.56 HECTARES PLOTS: 435 1. recharge well This effectively means zero discharge has been achieved for rainwater for the entire layout. ban of digging private borewells. dependant on 6 common bore-wells improved aquifer capacity rwh potential annual potential land area 14.56 h 154kl 56ml 2. 3. 4. PLANT BED before after Water meter 7.Vegetation sysytem 2.Bacterial action 6.Decomposition 5.Nutrient uptake 3.Filtration 1.Sedimentation 4.Adsorption CONVENTIONAL POOR WATER QUALITY POLLUTION ENVIRONMENT FRIENDLY BETTER WATER QUALITY MAINTAINANCE COST AT RS40,000/MONTH MAINTAINANCE COST AT RS10,000/MONTH PHYTORID water tariff After the end of the dis- tribution cycle there’s a surplus of 60KL daily, thus making it a self suf- ficient neighbourhood. Ground water table has risen to around 250ft and hence befitting the surrounding communities. THE WATER DISTRIBUTION CYCLE
- 4. water worksthe bengaluru story buddhi schoolTowards reducing the external water footprint the abodeattempt at self-sufficient dwelling conclusiontowards regeneration & resoration of water Futurarc 2015/ K9792564/Professional/Bengaluru/Page no:4 3.CLOSED LOOP SYSTEM 1.RESTORING BIO-DIVERSITY 4.EASE OF IMPLEMENTATION 5.IDEA OF REPLICABLITY OF THE MODEL TO CATER TO LARGER EXTENT 2.NEED FOR COMMUNITY PARTICIPATION CONCLUSIVE ILLUSTRATIONS JAKKUR LAKE at a city level,rejuvunating life around it. Recharge well amount- ing to surplus of water in Rainbow drive. Reviving a heritage open well to meet wa- ter demands at classic orchards. Self sufficient plots. RESTORATION & RECHARGING GROUND WATER The above projects address the problem of water management at various scales. What is com- mon to them all, is that at every stage, the system is a closed loop i.e. what is taken is given back ensuring a sustainable future. People are aware, and this has moved them to take action. It is ex- tremely important at all scales that the community becomes a part of the operation of the system. All the remedial measures are cost effective and localized. In some places a surplus is generated. The fact that this model has proven successful at different scales means that is flexible and replicable. Al- though solutions to the problem must be derived from the context, this model is helpful in orienting one towards attaining social, financial and ecological sustainability. It is also important that policy makers be involved in making a waste-water master plan, selecting the appropri- ate location of the treatment plants, the creation of wetlands and water bodies. The same applies to ground water usage laws. LOCATION : DASARHALLI, BANGALORE SITE AREA : 1767.2 SQM AREA : 1500 SQM STRATA : ROCKY STRATA THE ABODE TREATED BLACK WATER COLLECTED AND RE-USED FOR FLUSHING TREATED WATER COLLECTION TANK Apart from the land features, the need for water and limited availability of the same too played an active part in the design. TERRACE ACTING AS RAINWATER CATCHMENT AREA COLLECTED RAINWATER GOING TO SUMPTANK BLACK WATER FROM TOILETS SENT FOR TREATMENT. The largest need for water we identi- fied was for toilet flushing hence all of the black water is collected treated and re-used for this purpose & hence this way the school’s entire loop of water is closed. EXTERIOR VIEW OF THE SCHOOL SHOWING THE CATHMENT & RUN-OFF AREA FLOOR PLAN SHOWING THE BASIC PLUMBING LINES SCHEMATIC SECTION SHOWING THE WATER CYCLE LOCATION : MARIYANAPALLYA, BANGALORE SITE SIZE : 30’ X 45’ BUILT-UP AREA: 1705 SQ. FT. The roof of this house provides a healthy 83 sqm and an ad- ditional 42 sqm of paved spaces. Every surface is exploited for rainfall. The terrace on the first floor is used as a provider of water for drinking and cooking alone, thus ensuring that the family has a supply of safe water for its essential needs the whole year through. VIEW OF TERRACE SHOWING ECO-FRIENDLY SOLAR WATER HEATER, LIGHTING AND REED BED SYSTEM LIFE-LINE WATER CATCHMENT AREA LIFE-LINE WATER COLLECTION TANK LIFE-LINE WATER USED AS POTABLE WATER KITCHEN BLACK WATER GOES TO UGD TERRACE ACTING AS CATHMENT AREA TO COL- LECT THE RAIN WATER SUMP TANK CONTAINING RAINWATER GREY WATER COLLECTION TANK SCHEMATIC SECTION SHOWING THE WATER CYCLE regeneration of resources Soil excavated for foundation is compressed & used to make mud blocks with which the walls are made. OHT WATER FROM SUMP TANK KEPT ON TERRACE GREY WATER FROM SHOWER TO BE TREATED REED BEDS TO TREAT THE GREY WATER grey water treatment system LOCATION MAP SHOWING AREA AROUND JAKKUR LAKE BUDDHI SCHOOL