Digital Transformation in the PLM domain - distrib.pdf
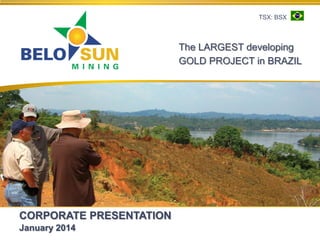
Belo Sun Presentation January 2014
1. TSX: BSX
The LARGEST developing
GOLD PROJECT in BRAZIL
CORPORATE PRESENTATION
January 2014
2. Cautionary Notes
All statements, other than statements of historical fact, contained or incorporated by reference in this presentation, but not limited to, any information as to the future
financial or operating performance of Belo Sun, constitute ‘‘forward-looking information’’ or ‘‘forward-looking statements’’ within the meaning of certain securities laws,
including the provisions of the Securities Act (Ontario) and are based on expectations, estimates and projections as of the date of this news release. Forward-looking
statements include, without limitation, statements with respect to: possible events, the future price of gold, the estimation of mineral reserves and mineral resources, the
realization of mineral reserve and mineral resource estimates, the timing and amount of estimated future production, costs of production, capital expenditures, costs and
timing of the development of projects and new deposits, success of exploration, development and mining activities, permitting timelines, currency fluctuations, requirements
for additional capital, government regulation of mining operations, environmental risks, unanticipated reclamation expenses, title disputes or claims and limitations on
insurance coverage. The words “anticipates”, ‘‘plans’’, ‘‘expects’’, “indicative”, “intend”, ‘‘scheduled’’, “timeline”, ‘‘estimates’’, ‘‘forecasts”, “guidance”, “opportunity”, “outlook”,
“potential”, “projected”, “schedule”, “seek”, “strategy”, “study” (including, without limitation, as may be qualified by “feasibility” and “pre-feasibility”), “targets”, “models”, or
‘‘believes’’, or variations of or similar such words and phrases or statements that certain actions, events or results ‘‘may’’, ‘‘could’’, ‘‘would’’, or ‘‘should’’, ‘‘might’’, or ‘‘will be
taken’’, ‘‘occur’’ or ‘‘be achieved’’ and similar expressions identify forward-looking statements. Forward-looking statements are necessarily based upon a number of
estimates and assumptions that, while considered reasonable by Belo Sun as of the date of such statements, are inherently subject to significant business, economic and
competitive uncertainties and contingencies. The estimates, models and assumptions of Belo Sun referenced, contained or incorporated by reference in this news release,
which may prove to be incorrect, include, but are not limited to, the various assumptions set forth herein and in our most recently filed Annual Information Form and our fullyear 2012 Management’s Discussion and Analysis as well as: (1) there being no significant disruptions affecting the operations of Belo Sun or any entity in which it now or
hereafter directly or indirectly holds an investment, whether due to labour disruptions, supply disruptions, power disruptions, damage to equipment or otherwise; (2) political
and legal developments in Brazil being consistent with Belo Sun’s current expectations; (3) the exchange rate between the Canadian dollar, Brazil Real and the U.S. dollar
being approximately consistent with current levels; (4) certain price assumptions for gold; (5) prices for diesel, natural gas, fuel oil, electricity and other key supplies being
approximately consistent with current levels; (6) production and cost of sales forecasts for Belo Sun, and entities in which it now or hereafter directly or indirectly holds an
investment, meeting expectations; (7) the accuracy of the current mineral reserve and mineral resource estimates of Belo Sun (including but not limited to ore tonnage and
ore grade estimates) and any entity in which it now or hereafter directly or indirectly holds an investment; (8) labour and materials costs increasing on a basis consistent
with Belo Sun’s current expectations; (9) the viability of the Volta Grande Project (including but not limited to the impact of ore tonnage and grade variability reconciliation
analysis) as well as permitting, development and expansion being consistent with Belo Sun’s current expectations; and (10); access to capital markets. Known and
unknown factors could cause actual results to differ materially from those projected in the forward-looking statements. Such factors include, but are not limited to:
fluctuations in the currency markets; fluctuations in the spot and forward price of gold or certain other commodities (such as diesel fuel and electricity); increases in the
discount rates applied to present value net future cash flows based on country-specific real weighted average cost of capital; declines in the market valuations of peer
group gold producers and Belo Sun, and the resulting impact on market price to net asset value multiples; changes in interest rates or gold rates; changes
Carlos Costa, P.Geo, an employee of the Company and a qualified person under NI43-101, has reviewed and approved the scientific and technical information herein.
Mineral resources that are not mineral reserves do not have demonstrated economic viability.
TSX: BSX
2
5. Resource Expansion (2009 to 2013)
Under Present Management
Under Present Management
Verena (Pre
BSX)
• 170 Drill
Holes
Included in
Resource
TSX: BSX
• 42 Additional • 137
• 112
• 273 Additional
Drill Holes
Additional
Additional
Drill Holes
Included
Drill Holes
Drill Holes
Included in
in Resource
Included
Included in
Resource
in Resource Resource
• 126 Additional • 94 Additional
Drill Holes
Included in
Resource
Drill Holes
Included in
Resource
5
6. Experienced Board & Management
BOARD OF DIRECTORS
Peter Tagliamonte (Chairman)
Engineer
MANAGEMENT
BRAZIL OPERATIONS
TORONTO OFFICE
Carlos Costa
Engineer
Jay Hodgson
Ian Pritchard
Geologist (30 years experience)
Stan Bharti
Chief Operating Officer
Ricardo Lopes
Ryan Ptolemy
Geologist (27 years experience)
Chief Financial Officer
Geologist
Omar Antunes
Vice President of Engineering
Rui Santos
(30 years experience)
Geologist
Clay Hoes
Chemical Engineer
Lawyer
Mike Hoffman
Pat Gleeson
Corporate Secretary
Octavio Guimaraes
Catherine Stretch
Simon Marcotte
Engineer (20 years experience)
VP Corporate Development
Director
Helia Bento
Marketing Manager
Mark Eaton
Director, President & CEO (25 years Capital Markets experience)
Helio Diniz
Director, VP Exploration (30 years experience)
TSX: BSX
6
7. Capital Structure
Shares Outstanding
No.
265.9 million
Fully Diluted
No.
285.9 million
Share Price
C$
$0.37 *
Market Capitalization
C$
$98 million
52 Week High & Low
C$
$1.83 - $0.32
Average Daily Volume
No.
1,000,000
C$
$19 million **
(3 month average)
Cash & Cash Equivalents
*As at Jan 2nd , 2014
**As at Sept 30th, 2013
TSX: BSX
7
10. Volta Grande Main Deposits (October 2013)
Ouro Verde
Measured &
Indicated:
44.2 Mt (2.4M oz) @
1.70 g/t Au
Inferred:
23.4 Mt (1.2M oz) @
1.48 g/t Au
Grota Seca
Measured &
Indicated:
47.1 Mt (2.4M oz) @
1.59 g/t Au
Inferred:
18.9 Mt (1M oz) @
1.59 g/t Au
Volta Grande
Total
TSX: BSX
Measured &
Indicated:
93.8 Mt (5.1M oz) @
1.69 g/t Au
Inferred:
45.5 Mt (2.5M oz) @
1.75 g/t Au
10
11. Volta Grande
Topography
View from Ouro Verde
• Deposit located well above
water line
• Upstream damming of river
will further reduce river level
TSX: BSX
11
12. Brownfields Exploration
Ouro Verde
Grota Seca
Target Areas for future
resource expansion
*South Block Inferred Resource Estimate
-Indicated Pit Constrained – 2.5M tonnes
@ 3.06 g/t Au containing 246k oz Au
-Inferred Pit Constrained – 2.9M tonnes
@ 3.94 g/t Au containing 370k oz Au
-Indicated Underground – 24k tonnes
@ 4.24 g/t Au containing 3k oz Au
- Inferred Underground – 193k tonnes
@ 4.05 g/t Au containing 25k oz Au
Exploration Camp
GRANDE
South Block
TSX: BSX
* Details regarding the mineral resource estimate can be found in the Press Release dated Oct 3rd, 2013 that has been filed under the profile
of the Company on SEDAR.
12
16. OURO VERDE
270 m
- Central portion of Domain-2
Sec 975NW
Sec 475NW
HG zone inside of D2
17. GROTA SECA
- Central portion of Domain-1
- HG zone related to the general trend presented in slide 15
190m
Sec 2050W
HG zone inside of D1
Sec 1725W
-
325m
Notes
Cut-off: aprox. 1.50 ppm
Num. drill holes: 41
Num. samples: 487
Thickness: max=16m, min=2m,
aver=8m
HG zone near surface
18. GROTA SECA
- Portion along “Galo” area
- HG zone related to the “galo” trend presented in the slide 15
Sec 800W
Sec 525W
Main structural controls
TSX: BSX
-
Notes
Cut-off: aprox. 1.50 ppm
Num. drill holes: 42
Num. samples: 377
Thickness: need to be
modeled
HG zones near surface
23. Project Performance (After Tax)
Project Data
Production Data
Life of mine
Annual Mine Throughput
Metallurgical Recovery Au
Average Annual Gold Production
Average Waste to Ore Strip Ratio
Average Grade of M&I Resource
Average Grade after mining dilution
Life of Mine Operating Costs/Tonne Ore Milled
Mining
Processing
General and Administration
Total Operating Cost/Ounce of Gold
Cash Operating Costs including Royalties
Capital Cost
Initial Investment Capital
Average Sustaining Capital over life of mine
including closure costs
TSX: BSX
Prefeasibility Results
10 Years
7 million tpy
94%
313,100 oz
6.88:1
1.72 g/t
1.48 g/t
US$17.36
US$10.50
US$2.52
US$681.90
US$711.50
US$ 749,114,400
US$19.62 million per annum
23
24. Operating Cost Breakdown
Category
Mining Cost per Tonne material moved
Cost per tonne Ore in Cost per Ounce Produced
US$
in US$
2.26
Mining
17.36
389.60
Processing
10.50
235.70
General and Administrative
2.52
56.60
US$30.38
US$681.90
Total
Strip Ratio 6.88:1
TSX: BSX
24
29. Regional Geology & BSX Sampling/Geophysics
BSX airborne survey limit
28 km road access from Itata to BUMA
Jatoba
11 DDH = 2,389m + auger drilling
11m @ 0.3 % Cu (up to 1.38% Cu)
Geotem-mag airborne survey
grid soil sampling: up to 189 ppb Au
(1km line spacing)
Garimpinho
79.5 g/t Au in diorite
Surubim
Buma *
7 DDH = 1,100m + auger drilling
700,000t @ 0.8 g/t Au (oxide)
grab sample 60 g/t Au (VQz)
Javae
120.9 g/t quartz vein colluvium/alluvium
BSX airborne Mag/Rad Survey – covered 130km strike (pending data processing)
Eastern part of the greenstone was not covered in previous work
TSX: BSX
* Historical Resource - Non NI 43-101 Compliant and should not be relied upon.
29
31. Patrocinio
Tapajos District
More than one million ounces of historical
gold production at Patrocinio
3.0 km by 1.5 km soil geochemical
anomaly defined
Grab samples have returned gold values up
to 37 g/t in granite and up to 67 g/t in veins
IP geophysical survey completed
1,500 meter drill program completed
One hole returned 23.35m of 1.35 g/t Au
2013 drill program – 5000 meters
TSX: BSX
16m of 5.2 g/t Au and 15m of 2.66 g/t Au
31
33. LTM Share Performance
September 4, 2012 – September 4, 2013
60%
Return Over Period
40%
20%
–
Spot Au: (18%)
(20%)
S&P/TSX Global Gold: (36%)
Belo Sun: (38%)
(40%)
Emerging Gold Peers: (47%)
Producing Gold Peers: (49%)
(60%)
(80%)
Sep-12
Nov-12
Jan-13
Mar-13
May-13
Jul-13
Sep-13
1
Source: TD Securities September 4, 2013, Bloomberg
(1) Producer gold peers index includes: Alamos, Argonaut, B2Gold, Centamin, Kirkland Lake, Rio Alto, San Gold and Semafo
(2) Developer gold peers index includes: Carpathian, Guyana Goldfields, Lydian, Rainy River, Romarco, Sandspring, Sulliden and Torex
TSX: BSX
33
34. Independent Research Coverage
Independent Research – Full Coverage
Firm
Analyst
TD Securities
Dan Earle
CIBC
Jeff Kileen
BMO Capital Markets
John P. Hayes
National Bank Financial
Shane Nagle
Cormark Securities
Richard Gray
Canaccord Genuity
Rahul Paul
Dundee Capital Markets
Joseph Fazzini
Macquarie Capital Markets
Michael Gray
Scotiabank Global Banking& Markets
Ovais Habib
THE FOREGOING LIST INCLUDES THE NAMES OF ALL FIRMS CURRENTLY KNOWN BY THE COMPANY TO HAVE ANALYSTS COVERING THE COMPANY. THIS LIST MAY NOT BE COMPLETE AND IS SUBJECT TO CHANGE BY FIRMS' CHANGING OF
COVERAGE. PLEASE NOTE THAT ANY OPINIONS, ESTIMATES OR FORECASTS REGARDING THE COMPANY MADE BY THESE ANALYSTS ARE THEIRS ALONE AND MAY NOT REPRESENT THOSE OF THE COMPANY. THE COMPANY IS PROVIDING
THIS LISTING AS A SERVICE TO ITS STOCKHOLDERS AND, BY LISTING, IS NOT IMPLYING ITS ENDORSEMENT OF OR CONCURRENCE WITH SUCH ANALYST REPORTS. THOSE INTERESTED IN SUCH REPORTS SHOULD OBTAIN THEIR OWN
COPIES AND CONTACT THEIR BROKERS OR THE RESPECTIVE FIRMS.
TSX: BSX
34
37. Ouro Verde – Block Model Cross Section 900 NW
SW
NE
0m
MR Open Pit
70m
Mining - Saprolite
1.06
Mining - Fresh rock Open Pit
US$/t
1.41
Processing
-200m
US$/t
US$/t
11.98
G&A
US$/t
2.89
%
94
Au recovery - Saprolite
Au recovery - Fresh Rock
Selling cost
Au Price
%
50m
13.82
US$ / Oz
190m
94
US$ / Oz
g/t Au
1,400.00
Block Size: 12.5 X 5.0 X 10.0 m
-400m
TSX: BSX
37
38. Ouro Verde – Block Model Cross Section 525 NW
SW
NE
120m
0m
60m
MR Open Pit
g/t Au
150m
Mining - Saprolite
US$/t
Mining - Fresh rock Open Pit
US$/t
1.06
1.41
Processing
US$/t
11.98
G&A
US$/t
2.89
Au recovery - Saprolite
%
94
Au recovery - Fresh Rock
-200m
%
94
Selling cost
Au Price
US$ / Oz
13.82
US$ / Oz
1,400.00
Block Size: 12.5 X 5.0 X 10.0 m
-400m
TSX: BSX
38
39. Ouro Verde – Block Model Cross Section 300 NW
SW
NE
0m
25m
120m
g/t Au
MR Open Pit
Mining - Saprolite
US$/t
1.06
Mining - Fresh rock Open Pit
US$/t
1.41
Processing
US$/t
11.98
G&A
US$/t
2.89
%
94
Au recovery - Saprolite
Au recovery - Fresh Rock
-200m
Selling cost
Au Price
%
94
US$ / Oz
13.82
US$ / Oz
70m
1,400.00
Block Size: 12.5 X 5.0 X 10.0 m
TSX: BSX
-400m
39
40. Grota Seca – Block Model Cross Section 2575 W
SSW
NNE
MR Open Pit
Mining - Saprolite
US$/t
Mining - Fresh rock Open Pit
US$/t
1.06
1.41
Processing
US$/t
11.98
G&A
US$/t
2.89
Au recovery - Saprolite
%
94
Au recovery - Fresh Rock
%
94
Selling cost
Au Price
US$ / Oz
13.82
US$ / Oz
1,400.00
Block Size: 12.5 X 5.0 X 10.0 m
30m
20m
0m
25m
g/t Au
-200m
TSX: BSX
40
41. Grota Seca – Block Model Cross Section 1875 W
NNE
SSW
75m
0m
g/t Au
90m
MR Open Pit
Mining - Saprolite
US$/t
1.06
Mining - Fresh rock Open Pit
US$/t
1.41
Processing
US$/t
11.98
G&A
-200m
US$/t
2.89
%
94
Au recovery - Saprolite
Au recovery - Fresh Rock
Selling cost
Au Price
%
94
US$ / Oz
13.82
US$ / Oz
1,400.00
30m
Block Size: 12.5 X 5.0 X 10.0 m
TSX: BSX
41
42. Grota Seca – Block Model Cross Section 825 W
SSW
NNE
130m
190m
g/t Au
0m
MR Open Pit
-200m
Mining - Saprolite
US$/t
1.06
Mining - Fresh rock Open Pit
US$/t
1.41
Processing
US$/t
11.98
G&A
US$/t
2.89
%
94
Au recovery - Saprolite
Au recovery - Fresh Rock
Selling cost
Au Price
-400m
TSX: BSX
%
94
US$ / Oz
13.82
US$ / Oz
60m
1,400.00
Block Size: 12.5 X 5.0 X 10.0 m
42
45. Appendix
Volta Grande – Potential Crushing Plant
Crushing
Annual processing rate
Crushing availability
Nominal capacity
Installed power
Type
Feed top size
Product P80
Number of units
Feed silo capacity: 128 t (86 m3)
TSX: BSX
7,000,000 t/y
70.0 %
1,142 t/h
375 kW
Gyratory Crusher
1,000 mm
175 mm
1 unit
5 min.
45
46. Appendix
Volta Grande – Potential Milling Plant
Milling Plant
Annual processing rate
Availability
Nominal capacity
Feed P80
SAG discharge target P80
Ball mill discharge target P80
SAG mill 36 ft diam. X 20 ft EGL
Ball mill 26 ft diam. X 33 ft EGL
Pebble crusher (Cone crusher)
Pebble crusher nominal capacity
Gravity concentrator 40" diameter
Gravity plant feed rate (30% Cyclone OF)
Bond ball mill work index
Abrasion index (AI)
Ore specific gravity
TSX: BSX
7,000,000 t/y
90.0 %
888 t/h
175 mm
2.5 mm
0.074 mm
1 unit
2 units
2 units
373 t/h
4 units
533 t/h
18.4 kWh/t
0.647 2.65 t/m3
46
47. Appendix
Volta Grande – Potential Leach Plant
Leach Plant
Annual processing rate
7,000,000
Availability
90.0
Nominal capacity
888
Feed P80
0.074
Leach feed thickener diameter
57.0
Calculated leach plant recovery
89,23 - 90,91
Calculated gold produced/week 5,921 - 6,048
Calculated silver produced/week 7,240 -7,396
TSX: BSX
t/y
%
t/h
mm
m
%
oz
oz
47
48. Appendix
Pre-feasibility
Life of Mine
10 years
Annual production throughput
7 million tpy
Metallurgical Recovery
94%
Avg annual gold production
313,100 oz/yr
Avg waste to ore strip ratio
6.88:1
Avg head grade
1.48 g/t
CAPEX
US$ 749 million
OPEX
US$ 31.70/t of Ore
Cost per ounce
US$ 711.50
NPV @ 5%
US$ 474 million
IRR
15.2%
TSX: BSX
48
49. Appendix
Pre-feasibility
Mine Fleet
Trucks 180 t, Shovels 15m3
Process
Gyratory Crusher, SAG and 2 ball mills
Gravity Circuit
Carbon in Leach
Elution and Carbon Regeneration
Electrowinning
Smelting
Cyanide Destruct
Tailings Management Facility
Situated in a natural basin
TSX: BSX
49
52. Appendix
Volta Grande Capital Cost Estimate
Area Description
General (Assemblies)
Mine
Plant – General
Crushing
Storage/Ore transference
Grinding
Leaching/Adsorption
Elution
Electrowinning
Gold room
Carbon regeneration
Tailings treatment
Lime preparation
Tailings dam
Ancillary facilities
Water distribution system
Compressed air system
Reagents delivery, store and distribution
Infrastructure
Environment
Engineering and Procurement (EP)
Construction management (CM)
Owner’s Costs
Freight
Erection supervision (Vendor
Representation)
Spare parts
Firts Fills
Pre-Commissioning and training
Engineering insurance
Contingency
Total
TSX: BSX
Value without Taxes
(USDx1000)
Value with Taxes
(USDx1000)
% of CAPEX
52,573
121,528
91,471
11,412
5,087
70,178
30,037
5,763
1,119
1,527
970
3,186
1,491
10,788
48,507
2,868
1,111
7,308
29,378
1,018
23,787
31,716
21,819
8,223
57,551
126,127
101,508
12,186
5,537
75,724
33,057
6,564
1,279
1,674
1,081
3,877
1,698
12,641
55,493
3,512
1,189
8,249
32,946
1,174
26,039
34,719
21,819
8,223
7.68%
16.84%
13.55%
1.63%
0.74%
10.11%
4.41%
0.88%
0.17%
0.22%
0.14%
0.52%
0.23%
1.69%
7.41%
0.47%
0.16%
1.10%
4.40%
0.16%
3.48%
4.63%
2.91%
1.10%
3,721
4,340
0.58%
1,052
1,817
3,721
5,998
96,919
696,094
1,132
1,954
4,340
6,561
96,919
749,114
0.15%
0.26%
0.58%
0.88%
12.94%
100%
52
53. TSX: BSX
The LARGEST developing
GOLD PROJECT in BRAZIL
Corporate Headquarters
65 Queen Street West
Suite 815, P.O. Box 75
Toronto, Ontario M5H 2M5
Helia Bento
Investor Relations
416-309-2137