Introducing data driven practices into sales environments
•Download as PPTX, PDF•
0 likes•82 views

IFIP Decision Support Science - Jun 2016

Recommended
Recommended
More Related Content
What's hot
What's hot (20)
Similar to Introducing data driven practices into sales environments
Similar to Introducing data driven practices into sales environments (20)
More from Barry Magee
More from Barry Magee (20)
Recently uploaded
Recently uploaded (20)
Introducing data driven practices into sales environments
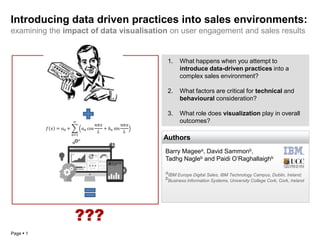
- 1. Page 1 Introducing data driven practices into sales environments: examining the impact of data visualisation on user engagement and sales results Barry Mageea, David Sammonb, Tadhg Nagleb and Paidi O’Raghallaighb aIBM Europe Digital Sales, IBM Technology Campus, Dublin, Ireland; bBusiness Information Systems, University College Cork, Cork, Ireland Authors 1. What happens when you attempt to introduce data-driven practices into a complex sales environment? 2. What factors are critical for technical and behavioural consideration? 3. What role does visualization play in overall outcomes? 𝑓 𝑥 = 𝑎0 + 𝑛=1 ∞ 𝑎𝑛 cos 𝑛𝜋𝑥 𝐿 + 𝑏𝑛 sin 𝑛𝜋𝑥 𝐿 ???
- 2. Page 2 your (data) business process Proces s is critical your REAL (data) business process
- 3. Page 3 Context What’s the setting and what is the problem to be solved? Who? • Sales Reps attempting to manage their sales territory When? • Deciding who to call next with limited time and multiple choices – 30 mins/day 1000s of clients Why? • Traditional engagement cycle focus on renewal events alone – 12% of customers only What? • Create a secondary engagement cycle based on more ‘complete’ view of client ‘needs’ How? • Aggregate data, create 360° views of client to better identify customers with ‘needs’ to be met When? • Create an ongoing process to drive more effective territory management. 12% clients engaged annually ... and not even the “right” ones!
- 4. Page 4 Methodology How did we examine the impact of the programme? Six Stages of Action Design Research Cycle 1 2 3 Name Spreadsheet SMART Data Aggregation SMART Visual SMART Time Apr 2012 – Oct 2012 Sep 2012 – Jun 2014 Apr 2014 – Feb 2015 Dual Solving & Research 3 Complete Cycles 1. Action Design Research 2. Deep Dive on Results specifics - DAER Stage Question What are we looking to determine? Deployment Are we functional? Is system built to requirements with end users set-up correctly for effective use? % of KDD in use*? Adoption Do we have buy-in on the concept? Are end-users sufficiently interested to try out the system, tool or process? Do we have ‘mind-share’? Engagement Do we have ongoing engagement? Are end-users engaged with system in the manner required to drive business results? Is it embedded? Results Have we impacted? Are we having an impact on business results due to adoption and engagement with the data-process *KDD from FAYYAD, U. & PIATETSKY-SHAPIRO, G. 1996. From data mining to knowledge discovery in databases.
- 5. Page 5 1. Data aggregation creates process value • Reps spent 1 hour on research per client • 14 different categories of sales ‘research’ • 38 different tools and sources regularily in use • Reps spent 1.5 hours on data collation per client • Large variances in seller use of data in ‘work of sales’ 2. Tolerance for data accuracy is very low • Sellers rejected artefact at anything > 3% error Findings Cycle 1: Spreadsheet SMART Apr 2012 – Oct 2012 Evaluation A. Deployment Cycle 1 Cycle 2 Cycle 3 % of KDD in Use 20% # Data Sources 1 B. Adoption % End-User Log-Ins 6% C. Engagement Engagements/Wk 0 Territory Penetration 15% D.Results Call Conversion 0% New Pipeline ($) $0 Time Saved/Rep/Client - 5 Mins What did we do? • Attempt to shift workload from sales to sales support – sales proposal creation • Sellers reluctant to ‘let-go’ and very low tolerance for ‘quality errors’ meant little workload transferred • Sellers showed interest in an ancillary output of process which showed overview of client inventory. There’s too much data!
- 6. Page 6 3. Visualization drives ‘discovery’ • Previously unseen ‘trade-offs’ are surfaced 4. The right data delivery process is critical • Sellers push back on excel – ‘6/10/100’ line of sight rule 5. Time sensitivity of information is important • Different data categories had varying ‘age’ tolerance 6. There is over-confidence in ‘effectiveness’ • Sellers hadn’t engaged clients in over 6 months in 80% of cases where they rejected investigation as unwarranted Findings Cycle 2: Data Aggregation SMART Sep 2012 – Jun 2014 Evaluation A. Deployment Cycle 1 Cycle 2 Cycle 3 % of KDD in Use 20% 60% # Data Sources 1 12 B. Adoption % End-User Log-Ins 6% 20% C. Engagement Engagements/Wk 0 23 Territory Penetration 15% 26% D.Results Call Conversion 0% 14% New Pipeline ($) $0 $410,000 Time Saved/Rep/Client - 5 Mins + 9 Mins What did we do? • Aggregated multiple datasets into a central set of views for sellers. • Created visual ‘HeatMaps’ to allows sellers see and determine ‘valuable’ clients for engagement. • Created client engagement planning and execution management process – who did you call and when? I can’t interpret the data!
- 7. Page 7 7. Visualization is an org change agent • ‘uncovered’ organizational & behavioral issues from customer to product selection, time prioritisation to skills 8. The role of analytics is secondary* • data aggregation is lower hanging, higher outcome work • Limited impact of *Propensity models with ‘thin’ data • Limited adoption of Propensity models without ‘context’ 9. multiplicity drives irrational behaviour • Success will be limited in data-driven projects until single- version of the truth issues tackled as affects urgency. Findings Cycle 3: Visual SMART Apr 2014 – Feb 2015 Evaluation A. Deployment Cycle 1 Cycle 2 Cycle 3 % of KDD in Use 20% 60% 80% # Data Sources 1 12 16 B. Adoption % End-User Log-Ins 6% 20% 52% C. Engagement Engagements/Wk 0 23 57 Territory Penetration 15% 26% 29% D.Results Call Conversion 0% 14% 20% New Pipeline ($) $0 $410,000 $1,700,000 Time Saved/Rep/Client - 5 Mins + 9 Mins +24 Mins What did we do? • Creation of infographic style 360° view of customer - Client-On-A- Page. • Streamlined delivery process and integrated with the Opportunity Management system • Focus on agile approaches – value-mapping, feature evaluation and iterative artefacts. I’m too busy!
- 8. Page 8 8 Benefits Framework for SMART Analytics Programme – Cycle 3 Time Process Effectiveness Client Engagement Sales Effectiveness Financial 1.5/Rep/Wk - 13 SMART calls per Rep Lower than target Call Rates 51% of Targeted Clients called Terr Penetration increased from 15% to 29% 20% Lead conversion vs 4% Lead Development avg 56% WinRate vs 50% bau avg $23k Avg winvs $21k bau avg 80% of New Opps no Renewal in Qtr > developing new engagement cycle > spreading forecast risk $1.7m NetNew Pipe • o/w $1100k Won Sellers spending > 3 Hrs per day on Pre-Sales Admin Sellers spending 1’20” per day on Customer Research 1095 Customers On A Page created Production Capacity 11 CoaPs/Rep/Wk 93% clients have some upsell hooks 2H process allowed Sales Mgrs prioritise Seller Time Customer Contact Platform Development Data Quality Gamification Expanded client views Improved Client Selection Drive Sales URGENCY • low traction but high yield • 524 calls = 1.5 per/rep/wk drove • 20% conversion rate • $1.7m new business opportunity • $1.1m in new business wins
- 9. Page 9 # Artefact/Deliverable Question Raised 1 Territory Management Programme Who do I call next? 2 Client-On-A-Page What do I discuss? 3 Challenge to ‘Fuzzy Logic’ Why should I not follow an existing course of action? 4 Time and Productivity Where will data driven activities impact my business? 5 Critical Success Factors How should a data transformation be implemented? # Artefact/Deliverable Question Raised 1 Importance of leading with visualization in data-driven projects How to best implement a data driven transformation? 2 Visualization as a catalyst for change How to use data to drive organisational change? Contributions What was delivered by programme? Contributions to Practice Contributions to Research
- 10. Page 10 Conclusions Closing remarks and observations Data process tools are organisational transformation initiatives not tool deployments 1 Data transformations will impact first by uncovering systems inefficiencies 2 Visualization artefacts are relatively easy to implement and drive value for early wins in transformation efforts – low hanging fruit 3 You MUST tackle the presence of existing legacy systems and issue of multiplicity as it has material impact on sales behaviour. 4