More Related Content Similar to Problem 1 (50 points) All Financial Data should only be obtained from.pdf (20) More from arrowcomputers8700 (20) 1. Problem 1 (50 points) All Financial Data should only be obtained from the website
https://finance.yahoo.com Consider the monthly adjusted closing prices of Apple Inc. (AAPL),
Ama zon.com I. (AMZN), Wal-Mart Stores Inc. (WMT) and Exxon Mobil Corp. (XOM) from
February 1, 2012 to December 29, 2017 1. Using Excel or any other spreadsheet software, find
the expected monthly rates of return and standard deviation of monthly rates of return for each of
these stocks. Moreover, find the covariance of monthly rates of return for each pair these stocks.
Solution
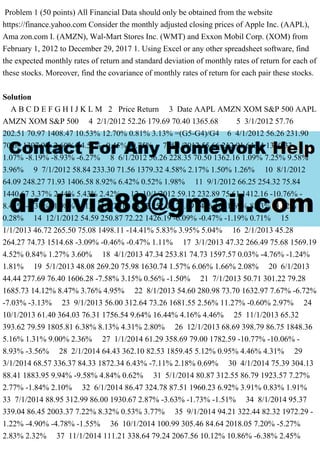
A B C D E F G H I J K L M 2 Price Return 3 Date AAPL AMZN XOM S&P 500 AAPL
AMZN XOM S&P 500 4 2/1/2012 52.26 179.69 70.40 1365.68 5 3/1/2012 57.76
202.51 70.97 1408.47 10.53% 12.70% 0.81% 3.13% =(G5-G4)/G4 6 4/1/2012 56.26 231.90
70.65 1397.91 -2.60% 14.51% -0.45% -0.75% 7 5/1/2012 55.66 212.91 64.34 1310.33 -
1.07% -8.19% -8.93% -6.27% 8 6/1/2012 56.26 228.35 70.50 1362.16 1.09% 7.25% 9.58%
3.96% 9 7/1/2012 58.84 233.30 71.56 1379.32 4.58% 2.17% 1.50% 1.26% 10 8/1/2012
64.09 248.27 71.93 1406.58 8.92% 6.42% 0.52% 1.98% 11 9/1/2012 66.25 254.32 75.84
1440.67 3.37% 2.44% 5.43% 2.42% 12 10/1/2012 59.12 232.89 75.61 1412.16 -10.76% -
8.43% -0.31% -1.98% 13 11/1/2012 58.12 252.05 73.09 1416.18 -1.69% 8.23% -3.32%
0.28% 14 12/1/2012 54.59 250.87 72.22 1426.19 -6.09% -0.47% -1.19% 0.71% 15
1/1/2013 46.72 265.50 75.08 1498.11 -14.41% 5.83% 3.95% 5.04% 16 2/1/2013 45.28
264.27 74.73 1514.68 -3.09% -0.46% -0.47% 1.11% 17 3/1/2013 47.32 266.49 75.68 1569.19
4.52% 0.84% 1.27% 3.60% 18 4/1/2013 47.34 253.81 74.73 1597.57 0.03% -4.76% -1.24%
1.81% 19 5/1/2013 48.08 269.20 75.98 1630.74 1.57% 6.06% 1.66% 2.08% 20 6/1/2013
44.44 277.69 76.40 1606.28 -7.58% 3.15% 0.56% -1.50% 21 7/1/2013 50.71 301.22 79.28
1685.73 14.12% 8.47% 3.76% 4.95% 22 8/1/2013 54.60 280.98 73.70 1632.97 7.67% -6.72%
-7.03% -3.13% 23 9/1/2013 56.00 312.64 73.26 1681.55 2.56% 11.27% -0.60% 2.97% 24
10/1/2013 61.40 364.03 76.31 1756.54 9.64% 16.44% 4.16% 4.46% 25 11/1/2013 65.32
393.62 79.59 1805.81 6.38% 8.13% 4.31% 2.80% 26 12/1/2013 68.69 398.79 86.75 1848.36
5.16% 1.31% 9.00% 2.36% 27 1/1/2014 61.29 358.69 79.00 1782.59 -10.77% -10.06% -
8.93% -3.56% 28 2/1/2014 64.43 362.10 82.53 1859.45 5.12% 0.95% 4.46% 4.31% 29
3/1/2014 68.57 336.37 84.33 1872.34 6.43% -7.11% 2.18% 0.69% 30 4/1/2014 75.39 304.13
88.41 1883.95 9.94% -9.58% 4.84% 0.62% 31 5/1/2014 80.87 312.55 86.79 1923.57 7.27%
2.77% -1.84% 2.10% 32 6/1/2014 86.47 324.78 87.51 1960.23 6.92% 3.91% 0.83% 1.91%
33 7/1/2014 88.95 312.99 86.00 1930.67 2.87% -3.63% -1.73% -1.51% 34 8/1/2014 95.37
339.04 86.45 2003.37 7.22% 8.32% 0.53% 3.77% 35 9/1/2014 94.21 322.44 82.32 1972.29 -
1.22% -4.90% -4.78% -1.55% 36 10/1/2014 100.99 305.46 84.64 2018.05 7.20% -5.27%
2.83% 2.32% 37 11/1/2014 111.21 338.64 79.24 2067.56 10.12% 10.86% -6.38% 2.45%
2. 38 12/1/2014 103.66 310.35 81.50 2058.90 -6.79% -8.35% 2.85% -0.42% 39 1/1/2015
110.03 354.53 77.07 1994.99 6.14% 14.24% -5.44% -3.10% 40 2/1/2015 120.64 380.16
78.05 2104.50 9.64% 7.23% 1.28% 5.49% 41 3/1/2015 117.32 372.10 75.50 2067.89 -2.75%
-2.12% -3.28% -1.74% 42 4/1/2015 118.00 421.78 77.60 2085.51 0.58% 13.35% 2.79%
0.85% 43 5/1/2015 122.84 429.23 75.67 2107.39 4.10% 1.77% -2.48% 1.05% 44 6/1/2015
118.76 434.09 74.51 2063.11 -3.32% 1.13% -1.54% -2.10% 45 7/1/2015 114.85 536.15 70.94
2103.84 -3.29% 23.51% -4.80% 1.97% 46 8/1/2015 106.91 512.89 67.38 1972.18 -6.91% -
4.34% -5.01% -6.26% 47 9/1/2015 104.91 511.89 67.21 1920.03 -1.88% -0.19% -0.26% -
2.64% 48 10/1/2015 113.66 625.90 74.79 2079.36 8.34% 22.27% 11.28% 8.30% 49
11/1/2015 112.51 664.80 73.81 2080.41 -1.00% 6.22% -1.31% 0.05% 50 12/1/2015 100.54
675.89 71.08 2043.94 -10.64% 1.67% -3.71% -1.75% 51 1/1/2016 92.98 587.00 70.98
1940.24 -7.52% -13.15% -0.13% -5.07% 52 2/1/2016 92.35 552.52 73.08 1932.23 -0.67% -
5.87% 2.95% -0.41% 53 3/1/2016 104.67 593.64 76.91 2059.74 13.33% 7.44% 5.24% 6.60%
54 4/1/2016 90.02 659.59 81.34 2065.30 -13.99% 11.11% 5.75% 0.27% 55 5/1/2016 95.90
722.79 81.91 2096.95 6.53% 9.58% 0.70% 1.53% 56 6/1/2016 92.37 715.62 86.97 2098.86 -
3.68% -0.99% 6.19% 0.09% 57 7/1/2016 100.69 758.81 82.53 2173.60 9.01% 6.04% -5.11%
3.56% 58 8/1/2016 102.51 769.16 80.85 2170.95 1.81% 1.36% -2.03% -0.12% 59
9/1/2016 109.82 837.31 81.67 2168.27 7.13% 8.86% 1.01% -0.12% 60 10/1/2016 110.30
789.82 77.96 2126.15 0.43% -5.67% -4.54% -1.94% 61 11/1/2016 107.36 750.57 81.69
2198.81 -2.66% -4.97% 4.78% 3.42% 62 12/1/2016 113.09 768.66 85.21 2238.83 5.33%
2.41% 4.31% 1.82% 63 1/1/2017 118.49 823.48 79.19 2278.87 4.77% 7.13% -7.06% 1.79%
64 2/1/2017 133.76 845.04 76.77 2363.64 12.89% 2.62% -3.06% 3.72% 65 3/1/2017 140.88
886.54 78.13 2362.72 5.32% 4.91% 1.77% -0.04% 66 4/1/2017 140.87 924.99 77.78 2384.20
-0.01% 4.34% -0.44% 0.91% 67 5/1/2017 149.80 994.62 76.69 2411.80 6.34% 7.53% -1.41%
1.16% 68 6/1/2017 141.82 968.00 77.63 2423.41 -5.33% -2.68% 1.23% 0.48% 69
7/1/2017 146.45 987.78 76.97 2470.30 3.27% 2.04% -0.85% 1.93% 70 8/1/2017 161.49
980.60 73.40 2471.65 10.27% -0.73% -4.64% 0.05% 71 9/1/2017 152.36 961.35 79.60
2519.36 -5.66% -1.96% 8.44% 1.93% 72 10/1/2017 167.11 1105.28 80.93 2575.26 9.68%
14.97% 1.67% 2.22% 73 11/1/2017 169.88 1176.75 80.87 2584.84 1.66% 6.47% -0.07%
0.37% 74 12/1/2017 167.90 1169.47 81.96 2673.61 -1.17% -0.62% 1.35% 3.43% 75
76 1) 77 AAPL AMZN XOM S&P 500 78 Mean 1.90% 2.99% 0.31% 1.00%
=AVERAGE(K5:K74) 79 St. Deviation 6.71% 7.60% 4.24% 2.76% =STDEV.S(K5:K74)
80 81 Covariance Matrix can be created as follows: 82 83 AAPL
AMZN XOM S&P 500 84 AAPL 0.00450 0.00168 0.00022 0.00091
=COVARIANCE.S($H$5:$H$74,K5:K74) 85 AMZN 0.00168 0.00577 0.00058 0.00110
86 XOM 0.00022 0.00058 0.00180 0.00067 87 S&P 500 0.00091 0.00110 0.00067
3. 0.00076 88 89 5) 90 91 To calculate sharpe and Jensen indexes,
weight of stocks in the portfolio is needed. 92