Beginners Guide to TikTok for Search - Rachel Pearson - We are Tilt __ Bright...
Fsa case 4 1
1. PURWANINGRUM
IPMI - MMFIM – FSA
CASE 4-1 – Integrated Analysis of Pfizer, Takeda Chemical, and Roche
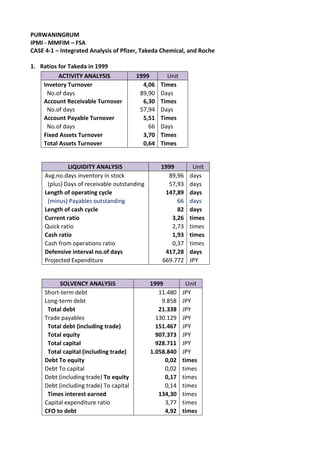
1. Ratios for Takeda in 1999
ACTIVITY ANALYSIS 1999 Unit
Invetory Turnover 4,06 Times
No.of days 89,90 Days
Account Receivable Turnover 6,30 Times
No.of days 57,94 Days
Account Payable Turnover 5,51 Times
No.of days 66 Days
Fixed Assets Turnover 3,70 Times
Total Assets Turnover 0,64 Times
LIQUIDITY ANALYSIS 1999 Unit
Avg.no.days inventory in stock 89,96 days
(plus) Days of receivable outstanding 57,93 days
Length of operating cycle 147,89 days
(minus) Payables outstanding 66 days
Length of cash cycle 82 days
Current ratio 3,26 times
Quick ratio 2,73 times
Cash ratio 1,93 times
Cash from operations ratio 0,37 times
Defensive interval no.of days 417,28 days
Projected Expenditure 669.772 JPY
SOLVENCY ANALYSIS 1999 Unit
Short-term debt 11.480 JPY
Long-term debt 9.858 JPY
Total debt 21.338 JPY
Trade payables 130.129 JPY
Total debt (including trade) 151.467 JPY
Total equity 907.373 JPY
Total capital 928.711 JPY
Total capital (including trade) 1.058.840 JPY
Debt To equity 0,02 times
Debt To capital 0,02 times
Debt (including trade) To equity 0,17 times
Debt (including trade) To capital 0,14 times
Times interest earned 134,30 times
Capital expenditure ratio 3,77 times
CFO to debt 4,92 times
2. PROFITABILITY ANALYSIS 1999
Gross margin 48,41%
Operating margin 16,84%
Pretax margin 21,56%
Profit margin 10,86%
ROA (preinterest)
After tax 7,04%
Pretax 10,84%
ROE
After tax 10,57%
Pretax 20,97%
ROTC (preinterest)
After tax 10,24%
Pretax 15,78%
2. Comparison of Activity Ratio Analysis shows that:
a. Takeda has higher Inventory Turnover compared to Pfizer, which means it has better
inventory turn over, with average number of days inventory in stock 89 days compared
to Pfizer 251 days. Further info showed that in 1999 Pfizer changed its accounting
method from LIFO to FIFO, and since Japanese company use Just in Time procedure to
maintain the scale of Inventory, Takeda use average methode that affected the book
value higher than FIFO method.
b. Takeda has higher A/R turnover compared to Pfizer, it has better account receivables
turn over, with average number of days Receivables outstanding 58 days compared to
Pfizer 76 days. This also means Takeda manage to get the cash from customer faster
than Pfizer.
c. Takeda has higher Fixed Asset turnover than Pfizer (Takeda 3,7 times and Pfizer 3,32
times), it shows that Takeda has better efficiency in long-term (capital) investment.
d. However, Takeda has a total asset turnover lower than Pfizer (Takeda 0.64 times and
Pfizer 0.83 times), it means that Pfizer has better efficiency in overall investment.
TAKEDA PFIZER
ACTIVITY ANALYSIS Unit
1999 1999
Inventory Turnover 4,06 1,45 X
No.of days 89,90 251 days
Account Receivable Turnover 6,3 4,78 X
No.of days 58 76 days
Account Payable Turnover 5,5 2,45 X
No.of days 66 149 days
Fixed Assets Turnover 3,70 3,32 X
Total Assets Turnover 0,64 0,83 X
3. Comparison of Liquidity Ratio Analysis shows that:
Pfizer’s Operating Cycle is longer than Takeda’s. This is because Pfizer’s Inventory
Turnover and Receivable Turnover are lower than Takeda. This also because
Japanese company use Just in Time procedure to maintain the scale of Inventory to
be minimum, so that, its inventory days are minimal. Thus, Takeda has better length
of operating cycle than Pfizer.
On the other hand, Pfizer’s Cash Cycle is longer than Takeda’s, which implies Pfizer
has more time to pay its suppliers. But overall, total of cash cycle of Takeda is
better than Pfizer.
Current Ratio, Quick Ratio, and Cash Ratio show that Takeda is financially stronger
than Pfizer.
However, Pfizer has better defensive interval number of days than Takeda. Pfizer
could maintain the current level of operations with its present cash resourses
without considering any additional revenues in 237 days.
TAKEDA PFIZER
LIQUIDITY ANALYSIS Unit
1999 1999
Avg.no.days inventory in stock 89,96 251 days
(plus) Days of receivable outstanding 57,93 76 days
Length of operating cycle 147,89 328 days
(minus) Payables outstanding 66 149 days
Length of cash cycle 82 179 days
Current ratio 3,26 1,22 X
Quick ratio 2,73 0,9 X
Cash ratio 1,93 0,48 X
Cash from operations ratio 0,37 0,33 X
Defensive interval no.of days 417,28 273 days
Comparison of Solvency Ratio Analysis shows that:
Pfizer has a higher Debt to Equity Ratio than Takeda, which might imply that Pfizer
is riskier than Takeda because a higher proportion of debt relative to equity
increases the riskiness of the firm. However, since most of Pfizer’s Debt is short-
term, its still safe and reasonable.
Times interest earned of Takeda is strongly better than Pfizer, which implies that
debt is properly used, as evidenced by high times interest earned.
Capital expenditure ratio of Takeda is higher than Pfizer. It indicates Takeda has
enough cash left for debt repayment or dividends after capital expenditures.
CFO to Debt of Takeda is also higher than Pfizer. It implies that Pfizer may have a
long-term solvency problem, as the firm does not generate enough cash internally
to repay its debt.
4. TAKEDA PFIZER
SOLVENCY ANALYSIS Unit Unit
1999 1999
Short-term debt 11.480 Yen 5.001 USD
Long-term debt 9.858 Yen 525 USD
Total debt 21.338 Yen 5.526 USD
Trade payables 118.852 Yen 1.820 USD
Total debt (including trade) 140.190 Yen 7.346 USD
Total equity 907.373 Yen 8.887 USD
Total capital 928.711 Yen 14.413 USD
Total capital (including trade) 1.047.563 Yen 16.233 USD
Debt To equity 0,02 X 0,62 X
Debt To capital 0,02 X 0,38 X
Debt (including trade) To equity 0,15 X 0,83 X
Debt (including trade) To capital 0,13 X 0,45 X
Times interest earned 172,99 X 19,83 X
Capital expenditure ratio 3,77 X 2,06 X
CFO to debt 4,91 X 0,56 X
Comparison of Profitability Ratio Analysis shows that:
Takeda has lower gross, operating and profit margin than Pfizer, it could means that
Takeda was unable to sell its product at high price which might be due to Japanese
government regulation.
Pfizer has higher Gross Margin, which could mean that Pfizer was able to sell their
product at higher price compare to Takeda. This is in-line with the Net Profit margin
of Pfizer which is also higher than Takeda.
Pfizer also has higher Operating Margin than Takeda. It means that Pfizer’s
operational efficiency is better than Takeda.
ROA, ROE, ROTC (pretax and after tax) Pfizer is better than Takeda, which shows
that Pfizer have higher return than Takeda.
TAKEDA PFIZER
PROFITABILITY ANALYSIS Unit
1999 1999
Gross margin 48,41 84,4 %
Operating margin 16,84 28,88 %
Pretax margin 21,56 27,42 %
Profit margin 10,86 19,74 %
ROA (preinterest) After tax 7,04 17,33 %
ROA (preinterest) Pretax 10,84 24,07 %
ROE After tax 10,57 36,15 %
ROE Pretax 20,97 50,21 %
ROTC (preinterest) After tax 10,24 25,45 %
ROTC (preinterest)Pretax 15,78 35,34 %
5. 3. DISAGGREGATION OF PRETAX ROA AND ROE 1999
A. Return on Assets B. Return on Equity
Preinterest and Assets Interest Postinterest
Tax Margin X Turnover = Preinterest ROA - on Assets = ROA X Leverage = Pretax ROE
EBIT Sales EBIT Interest Expense EBIT Average Total Assets EBT
Sales Average Average Average Total Average Total Average Average
(%) X Total Assets = Total Assets (%) - Assets (%) = Assets (%) Common Equity = Common Equity (%)
16,84% X 0,64 = 10,84% - 0,08% = 10,76% X 1,51 = 16,26%
ROA measures the return to all capital providers (creditor & shareholder) and is calculated on
pre-interest basis. This calculation uses Earning before interest & tax (EBIT) to calculate the
ratio.
ROE measures return to the firm’s shareholder and is calculated after deducting the returns
paid to creditors (interest), therefore the ROE is calculated in post-interest basis. This
calculation uses Earning before tax (EBT) to calculate the ratio.
DISAGGREGATION OF ROE (AFTER TAX) 1999
A.Three-Component Disaggregation of ROE
(Profitability X Turnover) X Solvency = ROE
Net Income Sales Net Income Average Total Assets Net Income
Sales X Average = Average X Average = Average
Total Assets Total Assets Common Equity Common Equity
10,86% X 0,64 = 7,00% X 1,51 = 10,57%
B. Five-Component Disaggregation of ROE
(Profitability X Turnover) X Solvency = ROE
Taxes Financing Operations
Net Income EBT EBIT Net Income Sales Net Income Average Total Assets Net Income
EBT X EBIT X Sales = Sales X Average = Average X Average = Average
Total Assets Total Assets Common Equity Common Equity
0,50 X 0,99 X 21,69% = 10,86% X 0,64 = 7,00% X 1,51 = 10,57%
Three-component disaggregation of ROE is breaking down the ROE into three categories:
Profitability : measured by Profit Margin.
Activity : measured by Asset Turnover.
Solvency : measured by Financial Leverage.
Profit Margin could also be broken down to see the effect on profit from the following:
Tax effect : measured by comparing Net Income to pre-tax earning (EBT).
Financing (interest) effect : measured by comparing EBT to earning before interest &
tax (EBIT).
Operation effect : measured by comparing EBIT to total Sales.
The resulting calculation of after-tax ROE is 10.57% compared to 16.26% before-tax.
4. Comparison of 1999 after-tax ROE between Pfizer and Takeda shows that Pfizer has higher
ROE (36.15%) than Takeda (10.57%). This big difference can be examined by further
comparison of three-component disaggregation of ROE as follows:
6. A.Three-Component Disaggregation of ROE
(Profitability X Turnover) X Solvency = ROE
Net Income Sales Net Income Average Total Assets Net Income
Sales X Average = Average X Average = Average
Total Assets Total Assets Common Equity Common Equity
TAKEDA
1999 10,86% X 0,64 = 7,00% X 1,51 = 10,57%
PFIZER
1999 19,74% X 0,83 = 16,46% X 2,2 = 36,15%
Difference (0,09) (0,19) (0,09) (0,69) (0,26)
Difference between ROE for Pfizer and Takeda lies on profitability ratios (net income/sales),
which comes from effects of taxes and operations.
Other factor that diffirentiate those firms is the composition of Cost Of Good Sold to Sales
(using common size balance sheet).
5. (i) Changes in Roche’s ROE from 1999 to 2000
Five-Component Disaggregation of ROE
(Profitability X Turnover) X Solvency = ROE
Effects of: Taxes Financing Operations
Net Income EBT EBIT Net Income Sales Net Income Average Total Assets Net Income
EBT X EBIT X Sales = Sales X Average = Average X Average = Average
Total Assets Total Assets Common Equity Common Equity
1999 0,76 X 1,18 X 23,29% = 20,91% X 0,44 = 9,13% X 2,60 = 23,71%
2000 0,91 X 1,33 X 24,87% = 30,16% X 0,41 = 12,36% X 2,57 = 31,70%
Difference 20% 13% 7% 44% -6% 35% -1% 34%
The key Ratio: Profitability Ratio (Sales/ Avereage Total Assets) shows the largest difference
that can make significant difference on ROE, which is caused by the effect of Taxes, while
Turnover Ratio and Solvency Ratio remains stable.
(ii) Difference between the 1999 ROE for Pfizer and Roche
Five-Component Disaggregation of ROE
(Profitability X Turnover) X Solvency = ROE
Effects of: Taxes Financing Operations
Net Income EBT EBIT Net Income Sales Net Income Average Total Assets Net Income
EBT X EBIT X Sales = Sales X Average = Average X Average = Average
Total Assets Total Assets Common Equity Common Equity
ROCHE
1999 0,76 X 1,18 X 23,29% = 20,91% X 0,44 = 9,13% X 2,60 = 23,71%
PFIZER
1999 0,72 X 0,95 X 28,88% = 19,74% X 0,83 = 16,46% X 2,2 = 36,15%
Difference: -0,04 -0,23 0,06 -0,01 0,39 0,07 -0,40 0,12
Key Ratio:
Difference between ROE for Pfizer and Roche lies on asset turnover, which describe asset
management of Pfizer is better than Roche.