Downloaded 868 times


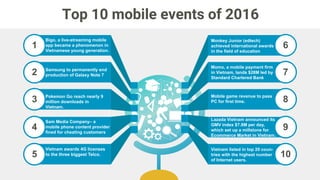

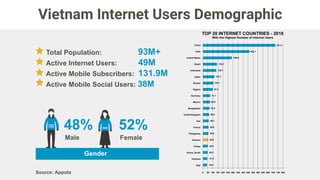
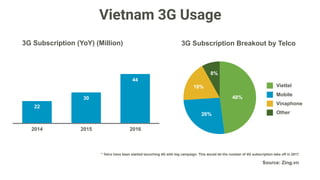
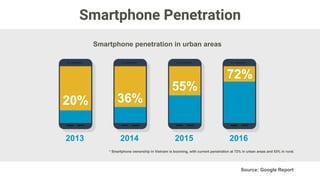

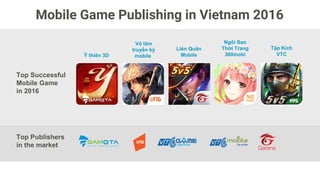
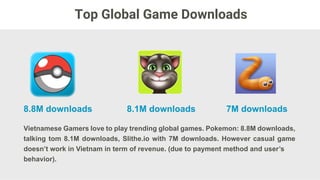
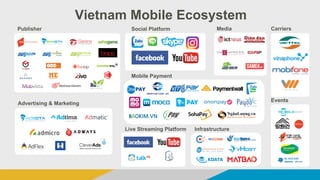

The document outlines significant trends and events in Vietnam's mobile market in 2016, highlighting the growth of mobile device usage, the rise of mobile commerce, and the importance of social networking and messaging apps. Key statistics include smartphone penetration reaching 72% in urban areas, the rapid adoption of 4G by major telecom providers, and the dominance of cash on delivery in e-commerce transactions. Additionally, the mobile gaming sector saw noteworthy growth, with major titles receiving millions of downloads.


![[Vietnam survey] Vietnamese education for kids](https://cdn.slidesharecdn.com/ss_thumbnails/vietnameseeducationforkidsen-150807124942-lva1-app6891-thumbnail.jpg?width=640&height=640&fit=bounds)


![VIETNAM ESPORTS GUIDEBOOK 2019 by Appota Esports [Short Version]](https://cdn.slidesharecdn.com/ss_thumbnails/lite-190312074147-thumbnail.jpg?width=640&height=640&fit=bounds)


