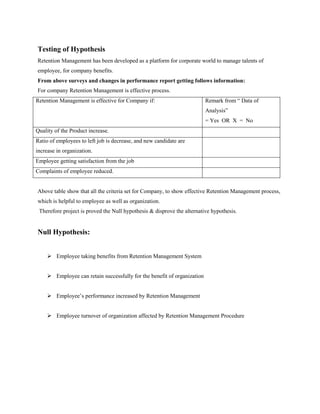
SlideShare a Scribd company logo
1 of 97
“A CASE STUDY ON RETAINING THE BEST TALENTS IN
MURUGAPPA GROUP OF COMPANIES CHENNAI”
PROJECT REPORT
(A Report submitted in Partial Fulfillment of the requirements for the degree of
Master of Business Administration in Pondicherry University)
Submitted by
ANIL KUMAR KHADKA
ENROLLMENT NO: 0212390591
MBA Human Resource Management
(Course Code 039)
DIRECTORATE OF DISTANCE EDUCATION
PONDICHERRY UNIVERSITY
PONDICHERRY – 605 014
May 2014
CERTIFICATE OF THE GUIDE
This is to certify that the Project Work titled “A CASE STUDY ON
RETAINING THE BEST TALENTS IN MURUGAPPA GROUP OF
COMPANIES CHENNAI” is a bonafide work of ANIL KUMAR KHADKA,
Enroll No: 0212390591 carried out in partial fulfillment for the award of degree of
MBA Human Resource Management of Pondicherry University under my guidance. This
Project work is original and not submitted earlier for the award of any degree/diploma or
associate ship of any other University/Institution.
Place: Chennai Signature of the guide
Date: Prof. R. SELVAPARY M.A., M.Phil
Department of Economics (Visiting Faculty)
PULC – Twinning Programme
Loyola College. Chennai – 600 034
STUDENTS’S DECLARATION
I, ANIL KUMAR KHADKA hereby declare that the Project Work titled “A
CASE STUDY ON RETAINING THE BEST TALENTS IN MURUGAPPA
GROUP OF COMPANIES CHENNAI” is the original work done by me and
submitted to the Pondicherry University in partial fulfillment of requirements for the
award of Master of Business Administration in Human Resource Management is a
record of original work done by me under the Supervision of
Prof.R. SELVAPARY M.A., M.Phil.
Enroll No: 0212390591 Signature of the Student
Date :
ACKNOWLEDGEMENT
I would like to thank the Co- ordinator, Pondicherry University and Loyola College
Twinning Programme for providing all the encouragement and valuable inputs to do the project
work by organizing seminars. I wish to convey my heartfelt thanks to
Prof. R. SELVA PARY. M.A., M.Phil., Dept. of Economics Loyola College, Ch-34, Visiting
faculty Human Resource Management, Pondicherry University- Loyola Twinning program for
giving me all the valuable guidance to improvise the project.
I would like to thank “MURUGAPPA GROUP OF COMPANIES” for providing me an
opportunity to work with them and giving necessary guidance in completing the project to the
best of my abilities. I am obliged to Mr.PARTHASARATHY, Senior HR Manager and
Mr.MURALI GIRI, Senior Admin Manager - IT - Projects, Murugappa Group of Companies,
Chennai who provided me the essential information and extended his best support.
I would like to extend special gratitude to Mr. PARTHASARATHY, Senior HR Manager and
Mr.MURALI GIRI Senior Admin Manager IT - Projects, Murugappa Group of Companies, for
being my company guide and providing me an insight into various issues pertaining to cases
mentioned in the report. This is his sincere support and consistent guidance that led to the
completion of the project. Finally it is my foremost duty to express my gratitude to my parents,
sister and friends for their moral support and encouragement without which would have not be a
complete one.
(ANIL KUMAR KHADKA)
EXECUTIVE AND SUMMERY
Every organization needs inventory for smooth running of its activities. It serves as a link
between production and distribution processes. The investment in inventories constitutes the
most significant part of current assets/working capital in most of the undertakings. Thus, it is
very essential to have proper control and management of inventories. The purpose of inventory
management is to ensure availability of materials in sufficient quantity as and when required and
also to minimize investment in inventories. Raw materials, goods in process and finished goods
all represent various forms of inventory. Each type represents money tied up until the inventory
leaves the company as purchased products. Because of the large size of the inventories
maintained by firms, a considerable amount of funds is required to be committed to them.
It is therefore absolutely imperative to manage inventories efficiently and effectively in
order to avoid unnecessary investments. A firm neglecting the management of inventories will be
jeopardizing its long run profitability and may fail ultimately. The reduction in excessive
inventories carries a favorable impact on the company’s profitability.
The study starts with an introduction to inventory management, Company’s profile,
Achievements and also the need for study, review of literature and objectives are set out for the
study. Research methodology, Data analysis & Interpretation, Findings and Suggestions of the
study follow.
One of the main areas of the project is the analysis part, where the data are analyzed &
interpreted, to find out how the inventories were managed. Some of the tools used in inventory
are regarding to:
 Economic Order Quantity
 Safety Stock
 FSN Analysis
 Trend Analysis and
 Inventory Turnover Ratio.
TABLE OF CONTENTS
CHAPTER NO TITLE PAGE NO
1
INTRODUCTION
1.1 Objective of the Study
1.2 Need for the Study
1.3 Scope of the Study
1.4 Limitation of the Study
1.5 Research Methodology
2
4
4
6
6
7
2 COMPANY PROFILE 11
3 REVIEW OF LITERATURE 37
4 DATA ANALYSIS AND INTERPRETATION 43
5 FINDINGS, SUGGESTION,CONCLUSIONS 74
BIBLIOGRAPHY 82
QUESTIONNAIRE 84
LIST OF TABLES
TABLE
NO TOPICS PAGE NO
4.1 GENDER 44
4.2 AGE 45
4.3 DESIGNATION 46
4.4 EDUCATIONAL QUALIFICATION 47
4.5 EXPERIENCE 48
4.6 MARITAL STATUS 49
4.7 INCOME 50
4.8 RECRUITMENTS 51
4.9 JOB SECURITY 52
4.10 DIRECT BENEFITS 53
4.11 INDIRECT BENEFITS 54
4.12 PEFORMANCE APPRAISAL 55
4.13 TRAINING PROGRAM 56
4.14 LEARNING AND DEVELOPMENT 57
4.15 COMMUNICATION 58
4.16 RESPONSIBILTY 59
4.17 TALENT RETENTION WORK SHOP 61
4.18 FEEDBACK MECHANISM 62
4.19 JOB SATISFICATION 63
4.20
EMPLOYEE’S PERFORMANCE AFTER
IMPLEMENTING RETENTION MANAGEMENT
CONCEPT 65
LIST OF FIGURES
CHART TOPICS PAGE NO
4.1 GENDER 44
4.2 AGE 45
4.3 DESIGNATION 46
4.4 EDUCATIONAL QUALIFICATION 47
4.5 EXPERIENCE 48
4.6 MARITAL STATUS 49
4.7 INCOME 50
4.8 RECRUITMENTS 51
4.9 JOB SECURITY 52
4.10 DIRECT BENEFITS 53
4.11 INDIRECT BENEFITS 54
4.12 WORKING ENVIORNMENT 55
4.13 TRAINING PROGRAM 56
4.14 LEARNING AND DEVELOPMENT 57
4.15 COMMUNICATION 58
4.16 RESPONSIBILTY 59
4.17 TALENT RETENTION WORK SHOP 61
4.18 FEEDBACK MECHANISM 62
4.19 JOB SATISFICATION 63
4.20
EMPLOYEE’S PERFORMANCE AFTER
IMPLEMENTING RETENTION MANAGEMENT
CONCEPT 65
Chapter 1: Introduction
Introduction
Human Resource Development is concerned with people, dimensions of the organization. The
organization objectives can be best achieved by acquiring human resources, develop them, cast
them for our need &motivate them for still better performance and ensure that they continue to
Maintain their involvement, commitment, loyalty to the organizational. The Human Resource
Development basically consists of three “C”s i.e. competencies, commitment and culture
Companies that engage in Retention Management (Human Capital Management) are
strategic and deliberate in how they source, attract, select, train, develop, retain, promote, and
move employees through the organization.
Research done on the value of such systems implemented within companies consistently
uncovers benefits in these critical economic areas: revenue, customer satisfaction, quality,
productivity, cost, cycle time, and market capitalization. . The term Retention Management
means different things to different organizations. To some it is about the management of high-
worth individuals or "the talented" whilst to others it is about how talent is managed generally -
i.e. on the assumption that all people have talent which should be identified and liberated.
From a Retention Management standpoint, employee evaluations concern two major areas of
measurement: performance and potential. Current employee performance within a specific job
has always been a standard evaluation measurement tool of the profitability of an employee.
However, Retention Management also seeks to focus on an employee’s potential, meaning an
employee’s future performance.
Retaining the best Talent
Retention refers to the ability of an organization to retain its employees. Employee retention can
be represented by a simple statistic for example; a retention rate of 80% usually indicates that an
organization kept 80% of its employees in a given period. However, many consider employee
retention as relating to the efforts by which employers attempt to retain employees in their
workforce. In this sense, retention becomes the "Strategies" rather than the outcome.
A distinction should be drawn between low performing employees and top performers, and
efforts to retain employees should be targeted at valuable, contributing employees. Employee
turnover is a symptom of a deeper issue that has not been resolved. These deeper issues may
include low employee morale, absence of a clear career path, and lack of recognition, poor
employee-manager relationships or many other issues. A lack of satisfaction and commitment to
the organization can also cause an employee to withdraw and begin looking for other
opportunities. Pay does not always play as large a role in inducing turnover as is typically
believed.
In a business setting, the goal of employers is usually to decrease employee turnover, thereby
decreasing training costs, recruitment costs and loss of talent and organisational knowledge. By
implementing lessons learned from key organizational behavior concepts employers can improve
retention rates and decrease the associated costs of high turnover. However, this isn't always the
case. Employers can seek "positive turnover" whereby they aim to maintain only those
employees who they consider to be high performers.
1.1 Objectives:-
In the current scenario of cutthroat competition, every company has to survive to satisfy its
customers by providing them quality products and services. The Following objectives emerged:
Primary Objective:
 To suggest and come out with various ways & means of retaining the top talents in the
organization.
Secondary Objective:
 To map the entire process of Retention procedure and policies involved in the said
organization.
 To study the accuracy and quality of work of employees by Retention Management
procedure.
 To suggest possible improvement in Retention Management process.
1.2 Need for the Study
The purpose of this study is to analyzed the retaining the best talents in Companies. The study
aims is to improve Operational Efficiency and Productivity of the Manufacturing Company and
its aims is to enabling Business Agility. It aims is to simplify and transform the company to
adopt talent management practices to retain the best employees in the company.
After putting the more efforts, time and Cost to hire the best employee for the Right
person for Right job. Many books have been written and exit interviews conducted as employers
look for the secret to keeping their good employees satisfied.
Salary, retirement plans and vacation benefits are high on the list of why those great
employees took the job, but they are not reasons enough to keep them in your employ for the
long haul. Job satisfaction will increase your employee retention rate.
List of points to retain talent:
1. Create the work atmosphere that makes your employees feel that they are the asset of
the company:
Don’t make them feel like overhead. Allow them to feel secure in their job. Greet them
by name, letting them know that you know who they are and what their contributions are to the
company. Get their input about rules or changes that may need to be made. Encourage goal-
setting and let them make their own choices as often as possible.
2. Make expectations and goals of the company clear:
Be sure you have job descriptions so your employees know what is required of them. If
there are changes that need to be made, don’t expect them to learn that by osmosis. You must
communicate directly and clearly. Good employees want to please you, but they need to know
what it is they need to do to make that happen.
3. Create an open and honest work environment:
Give feedback on work performed and be willing to listen, really listen, to the concerns
of your employees. Chance meetings in the hall where social greetings are exchanged are good,
but do not take the place of actually sitting down face-to-face and discussing any work-related
concerns. Be open and listen to new ideas. Accept suggestions for problem-solving. Be available
and open when your employee asks for your guidance. Keep your top talent informed about what
is happening with the company - don’t let rumors take over. If there are problems or set-backs,
communicate this.
4. Provide opportunities to grow and learn in organization:
Provide tuition for continuing education classes. Give challenging and stimulating work.
Tap into their passion and allow them to focus their time and energy on projects they can enjoy.
Let them know what career development plans you may have for them and what opportunities
are available for them to grow with the company.
1.3 Scope of Study
This study was done through primary research. The primary data was collected from the
workers of the Murugappa Group of Companies. Primary data was collected through a sampling
method from male and female employees in the company through circulation of questionnaires.
Data collected was analyzed for achieving the objectives of the study.
1.4 Limitation of Study
The limitation includes:
 The study was conducted for a period of 4-5 months
 The study was limited to only Operations, Supply chain and logistics, Human Resource,
departments of the Organization
 The other main business units such as Information Technology/Administration were not
considered because it was more of a centralized function operating on a larger scale for
the entire group.
Rationale of the study
Today the war for talent is as big as for the Market share. Because of Liberalization and
Globalization the standard of the workforce and expectations of the employees from the
organization has moved away from aspiring for a job to seeking a career. In this scenario,
companies look for greater talents so as the candidates look for branded companies to pursue
their career. Now it becomes unavoidable for companies to attract the top talents and to retain
them to have a successful market share.
1.5 Research Methodology
Research Methodology is a way to systematically solve the research problems. It may be
understand as a science of studying how research is done scientifically. In it we are studying his
research problems along with the logic behind them. It is necessary the researcher to know not
only the research method techniques but also the methodology.
Types of Research
It is descriptive type of research. Descriptive Research survey and fact finding inquiries of
different kind. The major purpose of descriptive research is descriptive the state of affairs, as it
exist at present. The main control over the variable; he can only report what has to discover the
even when there he cannot the variable. The methods has to researcher utilized in descriptive
research are survey methods of all kind.
Data Source:-
The source of project depends on accurate data. That’s why data collecting the appropriate data,
which differ considerable in context money, cost, time and other resources at the disposal
researcher.
There are two types of data collection methods available
1. Primary Data Collection Method.
2. Secondary Data Collection Method.
Primary Data Collection Method.
Primary data are those that are obtain by the user for fulfillment their purpose. It has Primary
Data through personal visit of HR head, and HR executive. At all levels and observation methods
to get more reliable information. It also collected primary data to be filled, ‘Yes’ or ‘No’ format
questionnaire frame by the employee of Company, This data helped us to justify the statements.
Secondary Data Collection Method.
The Secondary Data is that which is already collected and stored or we can say already saved or
ready data by others. I got secondary data from their journals, records, specimen of appraisal
form etc. And from newspapers magazines, articles, internet etc I got basic information of Talent
Management. I collect secondary data by referring some specimen of company and by referring
some books and web sites of company from internet.
1.6 Hypothesis
Hypotheses are the essential assumptions which the researcher formulates about the possible
causes, findings and ultimate output of the issue in under research. Under hypotheses mere
assumptions or suppositions are made which are to be proved or disproved. For researcher it is a
formal question that he intends to resolve. A hypotheses consist either of a suggested explanation
for a phenomenon or of a reasoned proposal suggesting a possible correlation between multiple
phenomenon. The assumptions be true or false are to be proved through the completion of
project.
The hypotheses for this project are as follows:
Null Hypothesis
1. Employee taking benefits from Retention Management System
2. Employee can retain successfully for the benefit of organization
3. Employee’s performance increased by Retention Management
4. Employee turnover of organization affected by Retention Management Procedure
Alternate Hypothesis
1. Employees are not able to take benefits from Retention Management System
2. Employee cannot retain successfully for the benefit of organization
3. Employee’s performance cannot increase by Retention Management.
4. Retention Management is not affecting on employee turnover of organization
Chapter 2: Company Profile
2.1HistoryofMurugappa Group of Companies
Founded in 1900, Murugappa Group is one of India's leading business conglomerates. The
Group has 28 businesses including eight listed Companies actively traded in NSE & BSE.
Headquartered in Chennai, the major Companies of the Group include Carborundum Universal
Ltd., Cholamandalam Investment and Finance Company Ltd., Cholamandalam MS General
Insurance Company Ltd., Coromandel International Ltd., Coromandel Engineering Company
Ltd., E.I.D. Parry (India) Ltd., Parry Agro Industries Ltd., Tube Investments of India Ltd., and
Wendt (India) Ltd.
Market leaders in served segments including Abrasives, Auto Components, Cycles, Sugar, Farm
Inputs, Fertilizers, Plantations, Bio-products and Nutraceuticals, the Group has forged strong
alliances with leading international companies like Groupe Chimique Tunisien, Foskor, Cargill,
Mitsui Sumitomo, Morgan Crucible and Sociedad Qu mica y Minera de Chile (SQM). The
Group has a wide geographical presence spanning 13 states in India and 5 continents.
Renowned brands like BSA, Hercules, Ballmaster, Ajax, Parry’s, Chola, Gromor and Paramfos
are from the Murugappa stable. The organization fosters an environment of professionalism and
has a workforce of over 32,000 employees.
2.2 COMPANY IN INDIA
The Making of the Murugappa Group of Company
Headquartered in Chennai, the INR 225 Billion Murugappa Group is one of India's leading
business conglomerates. The Group has 28 businesses including eleven listed Companies traded
in NSE & BSE. Headquartered in Chennai.
Major Companies
1.Carborundum Universal Ltd.,
2. Cholamandalam Investment and Finance Company Ltd.,
3. Cholamandalam MS General Insurance Company Ltd.,
4. Coromandel International Ltd.,
5. Coromandel Engineering Company Ltd.,
6. E.I.D. Parry (India) Ltd.,
7. Parry Agro Industries Ltd.,
8. Sabero Organics Ltd.,
9.Shanthi Gears Ltd.,
10.Tube Investments of India Ltd.
Market leaders in served segments including Abrasives, Auto Components, Cycles, Sugar, Farm
Inputs, Fertilizers, Plantations, Bio-products and Nutraceuticals, the Group has forged strong
alliances with leading international companies like Groupe Chimique Tunisien, Foskor, Mitsui
Sumitomo, Morgan Crucible and Sociedad Química y Minera de Chile (SQM). The Group has a
wide geographical presence spanning 13 states in India and 5 continents. Renowned brands like
BSA, Hercules, Ballmaster, Ajax, Parry’s, Gromor and Paramfos are from the Murugappa stable.
The organization fosters an environment of professionalism and has a workforce of over 32,000
employees.
Coromandel International Limited
Coromandel International Limited, India’s second largest Phosphatic fertiliser player, is in the
business segments of Fertilisers, Specialty Nutrients, Crop Protection and Retail. The Company
manufactures a wide range of fertilisers and markets around 2.9 million tons making it a leader
in its addressable markets. In its endeavor to be a complete plant nutrition solutions Company,
Coromandel has also introduced a range of Specialty Nutrient products including Organic
Fertilisers. The Crop Protection business produces insecticides, fungicides and herbicides and
markets these products in India and across the globe. Coromandel is the second largest
manufacturer of Malathion and only the second manufacturer of Phenthoate. Coromandel has
also ventured into the retail business setting up more than 640 rural retail centers in the States of
Andhra Pradesh and Karnataka.
The Company has strategic partnerships with leading companies across the globe.
The Company clocked a turnover of 8,560 Crore during FY 2012-13. lt was ranked among the
top 20 best companies to work for by Business Today and was also voted as one of the ten
greenest companies in India by TERI, reflecting its commitment to the environment and society.
Coromandel is a part of the INR 225 Billion Murugappa Group.
E.I.D. Parry (India) Limited
E.I.D. Parry has been synonymous with dynamism since 1788. It became a part of the
Murugappa Group in 1981 and its businesses now cover a wide range of products including
sugar, microalgal health supplements from Parry Nutraceuticals and bio products from Bio
Products Division.
E.I.D. Parry set up India's first sugar plant at Nellikuppam in 1842. The pioneering spirit has
seen E.I.D. Parry setting up the first fully automated sugar plant at Pudukottai in 2000, a
distillery, and more recently, zero waste integrated sugar complexes. Silkroad Sugar Private
Limited is a joint venture with Cargill International where E.I.D. Parry holds 50% stake. A sugar
refinery with a capacity of 600,000 MT located in a Food Processing Special Economic Zone of
Parry Infrastructure Company Private Limited at Kakinada is being set up. The company is one
of the few to introduce branded sugar in the retail market in India under the Parry’s Pure and
Parry’s White Label. The company produces a variety of sugars at its four fully automated plants
in Tamil Nadu and a fifth one in Pondicherry. These cater to the food, bakery, confectioneries
and beverage manufacturing industries, and are also used in pharma applications.
E.I.D. Parry pioneered integrated sugar complexes that maximise the utility of sugarcane through
the production of sugar and using its other components in more purposeful ways. The company
also converts bagasse into electricity in its cogeneration units and processes molasses into
various types of alcohol, thus completing the value chain. In addition, EID Parry has a stand-
alone distillery in Sivaganga in Tamil Nadu.
The cogeneration plants at these three locations are among the first in the country to use air
cooled instead of water cooled condensers to conserve water. The Pettavaithalai plant uses
submerged ultra filtration with two reverse osmosis systems to save water and minimise usage of
chemicals - the first of its kind in India for boiler feed water. The Pudukottai plant is amongst the
first in South India to earn carbon credits and to be registered in UNFCCC under the Kyoto
protocol for climate change.
However, the biggest innovation spearheaded by E.I.D. Parry has nothing to do with
manufacturing or marketing of sugar but with the difference it has made to the 1, 00,000
sugarcane farmers associated with it. Parry has introduced complete IT enabled services for
farmers such as Remote Sensing, Geographic Information System and Global Positioning
System for mapping and monitoring sugarcane growing area. Village-wise soil nutrient analysis,
detailed farm boundary mapping, integration with Cane Management System and soil maps
ensure efficient cane management.
E.I.D. Parry has introduced Namadhu Parry Maiyam, a concept where a local entrepreneur
(usually a sugarcane farmer) is trained to become a Namadhu Parry Maiyam operator. The
company extends interest free loans to these operators for buying high end farm equipment,
which can then be hired out to small farmers who are unable to afford such sophisticated
equipment. This helps mechanise farm services, accelerate sugarcane harvesting and save costs
as manual labour is becoming increasingly expensive.
E.I.D. Parry pioneered sugarcane research and probably runs the only private R&D centre for
sugarcane and tissue culture to develop new and improved cane varieties. It has also been
aggressively promoting eco-friendly pest management systems.
Today, E.I.D. Parry is one of the Top 5 sugar producers in India and is on the path to sweetening
more lives around the world.
Parry Agro Industries Limited
Parry Agro has tea plantation factories both in South and North-East India and between the two
regions; the Company produces around 17 million kilograms of tea.
A pioneer in organic plantations, Parry Agro’s Iyerpadi Estate has been certified organic by
IMO, JAS (Organic Laws of Japan), NOP (Organic Laws of USA) and NPOP (Organic Laws of
India). The Iyerpadi factory is also ISO 22000 and is FLO (Fairtrade Labelling Organisation)
Certified.
Three of Parry Agro’s tea factories namely Mayura, Attikunna and Carolyn are certified for ISO
9001:2000. Mayura, one of the first CTC Tea factories thus certified, is also one of the first to
have micro-processor based control and monitoring systems, reflecting the forward looking
approach of the Management.
Not content with just the cultivation of tea, Parry Agro has been conducting extensive research
on better cropping as well as processing aspects of tea at its NABL certified R&D facility for
nearly a decade. It has also pioneered research on reversal of soil degradation using earthworms.
Parry Agro, in collaboration with Sambalpur University, Orissa and Institut de Recheche pour le
Development (IRD), has developed Earthworm FBO Technology called Fertilisation Bio
Organique (FBO) Technology to improve the soil fertility of plantation crops. This technology is
patented by IRD in France, China and Sri Lanka.
Carborundum Universal Limited
Carborundum Universal Limited (CUMI) was founded in 1954 as a tripartite collaboration
between the Murugappa Group, Carborundum Inc, USA, and the Universal Grinding Wheel Co
Ltd, UK.
CUMI pioneered the manufacture of coated and bonded abrasives in India, besides super
refractories, electro minerals, industrial ceramics and ceramic fibres. In sync with the global
vision, CUMI is expanding its product spread. The Company makes over 20,000 varieties of
products manufactured at 25 locations across India, Russia, South Africa, Australia, China,
Thailand and Canada. CUMI exports its products to 43 countries spread across the globe. All the
manufacturing facilities of CUMI are ISO 9001:2008 and ISO 14001: 2004 certified for quality
standards and environment-friendly manufacturing practices.
State-of-the-art facilities and strategic alliances with global partners have earned CUMI a
reputation for quality and innovation. It is one of the few manufacturers of abrasives and
ceramics in the world with fully integrated operations that include mining, fusioning, power
generation and manufacturing, besides marketing and distribution.
CUMI is equipped with a state-of-the-art Research and Development centre that works
aggressively on product development and efficiency enhancement. Its in-house R&D and
collaborative research with leading research institutions have ensured market leadership in India
and abroad. CUMI has manufacturing practices like Lean and Six Sigma in place to improve its
cost competitiveness.
The Company has a commanding list of subsidiaries across the globe that include Volzhsky
Abrasive Works-Russia, CUMI Australia Pty Ltd, Foskor Zirconia Pty Ltd-South Africa, CUMI
Middle East-RAK, CUMI Canada Inc, CUMI America Inc, Sterling Abrasives Limited-
Ahmedabad, Net Access India Limited, Southern Energy Development Corporation Limited
(SEDCO), CUMI Abrasives and Ceramics China Limited (CACCL), Cellaris Refractories India
Limited and CUMI International Limited, Cyprus. CUMI's joint ventures include Wendt (India)
Limited – manufacturing super abrasives, Murugappa Morgan Thermal Ceramics -
manufacturers of ceramic fibre and Ciria India Limited - specialising in design and installation of
refractory liners for petrochemical and fertiliser industries. This unique strength allows the
Company to serve diverse markets and geographies leveraging the local strength of its partners.
2.3 Tube Investments of India Limited - Murugappa Group
TII Heritage
the Group traces its origins to 1898, when Dewan Bahadur an M Murugappa Chettiar went as an
apprentice to Burma (now Myanmar). Quick to learn financial skills and Burmese, he realized he
was destined to greater achievements; he founded a firm in Moulmein, a large port-city in Lower
Burma. This grew into a prosperous family-owned business, with interests in Banking, Rubber
and Trade, covering Malaya (Malaysia), Ceylon (Sri Lanka), Indonesia and Vietnam. The
outbreak of the World War II and subsequent political upheavals in the region cut short the
firm’s growth. While a good portion of its hard earned fortunes were lost, the family had the
foresight to move significant assets to India; this financial prudence ensured that the business
would rebound after the disaster and rebound it.
Back home in India, the Group had engaged in businesses like Rubber, Steel cabinets, Yarn and
other traded goods. But the real major industrial opportunity came soon after Independence.
Political Independence spawned Economic Independence: and AMM Murugappa Chettiar,
Dewan Bahadur’s eldest son (and by then, head of the family) was quick to realize it. His vision
was to start a business that would manufacture a product for the common man which they could
sell in large numbers. Thus, in 1949, TI Cycles of India (TICI) was born in collaboration with TI
of UK. It was the Group’s first of many successful Joint Ventures and also its first foray into
large scale manufacturing. Later, as a measure of backward integration two more companies
were formed: Tube Products of India (TPI) in 1955, to make steel tubes for bicycle frames and
TI Diamond Chain (TIDC) in 1960 to make bicycle chains. Over a period of time these two
businesses have moved up the value chain from bicycle parts to higher technology products.
In 1959, Tube Investments of India (TII) was formed by merging TI Cycles of India and
Tube Products of India. TI Diamond Chain was merged with the parent company, in 2004. In
1962, the company saw a potential to leverage its engineering skills to address the market for roll
formed metal products. So a new unit called TI Metal Forming was created to realize this
potential; to this day it is recognized as the pioneer in this business.
During the 1990s TII made many bold acquisitions to enhance its presence in its core
businesses. The most notable, was the case of Satavahana chains, a sick BIFR company that was
turned round to a highly profitable unit. Other success stories were the acquisition of a Japanese
Tube plant and a German Chains plant which were re-erected in Chennai to address the growing
export markets. A successful GDR issue in 1994 increased its financial muscle and accelerated
both acquisitions and expansions. Capacities were increased in all its units to meet the growing
customer demands. In the six decades of its existence, TII has built significant skills in
engineering and metallurgy, which is fully supported by a central R&D function.
A Total Quality Management approach has ensured a satisfied community of customers
and TII is the preferred supplier in all the markets it operates. TII continues the tradition of
financial discipline and prudence set by the founding fathers. It is this tradition that has earned
TII the unique distinction of uninterrupted dividend distribution since 1954.
2.4 Tube Investments of India Limited - Murugappa Group
Management Tress
BOARD OF DIRECTORS
General Manager (Corporate Affairs)
Service Department
Work Manager
Deputy woks Manager (Floor Incharge)
Body & Paint Dept Spares Department HR, Accounts &
True Value Dept.
Service Coordinator Supporting Section
Manager Manager
Manager
Supervisor Customer care, Front Office,
Lobby Hostess, Service Mktg)
Supervisors Sr. Executive
Sr. Executives
Asst. Service Advisors
Senoir Executives
Asst. Supervisor Officiers
Executive
Officiers
Service Advisors
Executives
Technicians Asst.Officiers
Asst.Officiers
Technicians
Technicians
Asst Officiers
Technicians
Officers
Technicians
TII Ltd - Board of Director Management
Mr. L. Ramkumar (Managing Director)
Mr. Kalyan Kumar Paul (President)
Mr. P. Ramachandran (President TI Diamond Chain India)
Mr. Arun Alagappan (President TI Cycle)
Mr. K. R. Srinivasan (Sr. Vice President-TI Metal Forming)
Mr. Arjun Ananth (Sr. Vice President and CFO)
Mr. R. Natarajan (Sr. Vice President- Corporate Technology Centre)
Mr. N. Prasad (Sr. Vice President – HR)
2.5 TII Ltd. Quality Focus
TII journey towards excellence began with introduction of basic TQM which focuses on
Customer, Continuous improvement, Employee involvement, Employee empowerment, and
building a learning organization.
The outcomes of the above initiatives were development of documented management systems
for Quality, SHE (Safety Health and Environment), TEI (Total Employee Involvement), and
related metrics of measures including that for customer satisfaction and Employee satisfaction /
Engagement.
Development of vision, mission, strategic plans, Process focus and integration of all the earlier /
above initiatives in a robust manner was supported by the introduction of the EFQM Model for
Business Excellence. Similarly concept of OEE, autonomous maintenance and related matrices
of measures for success are from the TPM introduction.
Though they were benefited from many of these initiatives and moved closer to the bench mark
levels, the drive needs to continue. As an engineering company, they believe that the need now is
to focus and excel in Manufacturing / Operations without losing any of the gains we had from
the previous initiatives.
Strengthening the organisational structure and aligning them appropriately including formation
of a new function for Manufacturing Engineering Technology (MET) are the new initiatives in
this direction. To create more focus for this drive, we have developed a Model for Operational
Excellence, and launched the same during Sept 2012.
In this House of Excellence, the two pillars represent our commitment to delight customers by
meeting and exceeding their expectations in terms of Quality, Delivery and other services, and
our intent to partner suppliers / Vendors in this process. The base steps show our approach to
create shop floor excellence leading to LEAN Manufacturing.
2.6 Company Profile
Tube Investments of India Limited is an India-based company engaged in the production of
bicycles/components/electric scooters, engineering and metal formed products. It operates in three
segments: Cycles/Components /E Scooters, Engineering and Metal Formed Products. The
Bicycles/Components/Electric scooters division of the Company consists of bicycles of the standard and
special variety, including alloy bikes and specialty performance bikes, bicycle components sold as spares,
fitness equipment and electric scooters. The Engineering division of it consists of cold rolled steel strips
and precision steel tubes, cold drawn welded tubes (CDW), electric resistance welded tubes (ERW) and
Stainless Steel tubes. It has presence in automotive and industrial chains, fine blanked products, roll-
formed car doorframes and cold rolled formed sections for railway wagons & passenger coaches.
TI Cycles of India
A pioneer in the Cycles market, TI Cycles, formed in 1949, has constantly come up with new trends in
line with evolving consumer needs. TI Cycles’ vision is “To be the most preferred brand in fitness,
recreation & personal mobility solutions”. It strives to give its customers not only a bicycle but a lifetime
experience.
TI Cycles have introduced fun and entertaining stores across the length and breadth of India. The
company has been proactive and was first Bicycle Company to change the cycle retail landscape,
both in urban and rural areas. With the first urban store in 2007, Hercules is sold in over 200
exclusive urban stores known as 'BSA Hercules Exclusive Stores' which have revolutionized the
way people buy bicycles in India. These stores are a one-stop premium shop for all Hercules,
BSA & Montra products and have a customer friendly ambience which serves as a model for
other bicycle outlets in the country. In 2010, the company started “Hercules BSA Cycles” to
provide the urban retail buying experience in smaller towns. In just over a year’s time, there are
over 200 of these rural stores. For its retail innovation, the company recently received the
certificate of appreciation for 'Excellence in Rural Retailing' at the ET Retail Awards 2011.
TI Cycles has plants at Chennai, Nasik and Noida, major Warehouses at Guwahati, Durgapur,
Patna and Cuttack and regional offices, through which it serves it nationwide 2500 plus dealer
network. Certified with ISO 9001:2000, OSHAS 18001-2007 and ISO 14001-2004, TI Cycles is
a quality and customer centric organization.
BSA stands for style, fun and comfort. There are several models catering to consumer segments
ranging from kids, ladies and other premium end customers. BSA Ladybird, BSA SLR, BSA
Champ, BSA Mach are trendsetters and icons in their respective categories. It signifies the joy of
cycling. Excitement and comfort go hand in hand with BSA. Today, BSA is an intrinsic part of
the Indian family.
Source: www.bsahercules.com
our first brand is still as young as ever, signifying strength and passion. It is rugged, robust and is
for the rough and tough. Hercules stands for a unique pride of possession. The range of Hercules
Roadeo and Hercules MTB Turbodrive has been pioneers in the bicycles category catering to the
youth. The range of Hercules Ryders is for urban adults for them to ride towards a healthier,
happier self. The Hercules Popular brand of "standard" bicycle is a market leader in the segment.
Source: www.facebook.com/HerculesRoadeo
Track and Trail is the ultimate destination for everything in cycles - from the best of international
bicycles and world-class accessories to a network of people with expertise on technology,
performance and the intricacies of cycling. For mountain, road and hybrid bikes, you can choose
from Cannondale, Bianchi or Schwinn – world-class brands known for incomparable designs,
superior comfort and ease of riding. We also have an exciting range of BMX and MTB cycles
from GT and Mongoose for those who like a bit of adventure in their lives.
Source: www.trackandtrail.in
Faster, lighter and stronger than any cycle ever created in India, Montra brings international
standard carbon frame bike for the first time in India. It is designed and manufactured
ingeniously and is a part of the flagship range of TI cycles under Track and Trail. Montra,
meaning “My Track” is the bike that lets you ride our aspirations, that lets you choose your own
path.
Source: www.montra.in
2.7 BSA MOTORS (Birmingham Small Arms)
BSA Motors is the youngest division of TII which made their venture into the Electric scooters
segment in 2008. It provides the Indian customers convenient personal mobility options which
are cost effective and environmentally responsible.
BSA Motors has the widest product range in the electric scooter industry specially designed and
developed to suit customer needs of the target segments like school / college girls & boys and
working women. The models ranges from 250 Watts and lower end models do not require
license or registration. The BSA Motors plant at Ambattur has the best R&D testing facilities
for electric two wheelers in India. With its focus on customer understanding,
Technology, product development, quality systems and after sales service capabilities, BSA
Motors intends to provide superior experience to its customers.Tube Products of India Ltd was
established in 1955, in collaboration with Tube Products (Old Bury) Limited-UK, as a measure
of backward integration with the bicycles plant. In 1959, Tube Investments of India (TII) was
formed by merging TI Cycles of India and Tube Products of India.
Today, TPI is the preferred supplier of precision tubes, Electric Resistance Welded (ERW) and
Cold Drawn Welded (CDW), to major automotive companies in India and abroad. TPI is India's
undisputed market leader in CDW tubes to the automotive industry. It has also significant market
presence in power plants, boiler, textile machinery, general engineering. It is the Market leader in
Telescopic Front Fork Inner tubes and Cylinder bore tubes for shock absorber and gas spring
applications, Propeller shaft tubes for Automotive segment. Other Specialty products include
Rear Axle Tubes, Side Impact Beams, and Tie Rods, Drag links, Heavy thick steering shafts and
Hydraulic Cylinder tubes.
The International Business Division (IBD) was formed to focus on international markets, gearing
TPI to compete with global tube manufacturers. The most recent addition to TPI is the Tubular
Components Division (TCD), which manufactures high strength tubular auto components,
providing the advantage of weight reduction, higher component efficiency and cost reduction.
TPI produces a wide range of CRCA strips including special extra deep drawing, high tensile,
medium carbon, high carbon finding application in industries such as Bearings, Automobile,
Auto Ancillaries, white goods, fine blanking and General Engineering.
TPI has been supplying to customers such as Bajaj Auto Ancillaries, TVS Motors Ancillaries,
Hero Honda Ancillaries, Tata Motors, Toyota India, Delphi, Gabriel, Escorts, and Endurance. Its
success stems from market driven, customer oriented approach coupled with superior process
design, short product development cycle, delivering high quality products and efficient customer
service ensuring total customer satisfaction.TPI has integrated manufacturing facilities at
Chennai (Two tubes plants and one strips plant at Avadi and one at Ambattur), Shirwal &
Mohali.These plants conform to international standards and achieve operational excellence
through TPM. TPI has distribution centers across India, which ensures timely service to the
customer’s daily requirements.
TPI has received ISO-TS 16949 for all plants, ISO 9001: 2000 for all plants, ISO 14001:2004 for
Avadi & IBD Plants, Self-certification for boiler tubes by the central boiler board. TPI is the
Winner of the Sword of honor for outstanding safety performance from the British Safety
council. Tubular Components Division (TCD), a plant of TPI, has won Supplier Performance
Award 2007-2008. Timely delivery, top notch quality and excellent service have been key for the
division for winning this award.
Tube Investment Diamond:
TIDC applies a collaborative approach with customers in developing new products that provide
value to customers. For this, TIDC relies on extensive in-house R&D and advanced design
software. In the domestic market the 'Diamond' brand chains cater to a range of two wheelers and
industrial OEMs. TIDC also services the after-market with kits and chains through a well-
established distribution network and warehouses in India and abroad. TIDC has plants at
Chennai, Hyderabad and Uttaranchal. I Cycles was established by the Murugappa Group in the
year 1949, in collaboration with Tube Investments of India ltd, UK. The first Hercules bicycle
rolled out in 1951.Today, TI Cycles is the leader in the ‘specials’ segment. The energy of the
company can be felt nationwide, thanks to a network of around 1,500 primary dealers and 10,000
secondary dealers.
TI Cycles has the capacity to manufacture 4 million cycles a year at 3 plants across India -
Chennai in the South, Nasik in the West and Noida in the North. This is supported by 4 zonal
offices and 4 warehouses across the country. I Cycles offer consumers a range of bicycles, e-
scooters, fitness equipment and infant mobility solutions
Cholamandalam MS General Insurance Company Ltd
Cholamandalam MS General Insurance Company Ltd. is a Joint Venture between the USD 3.03
billion Murugappa Group, one of India’s leading business conglomerates and Mitsui Sumitomo
Insurance Company Limited, which is part of the Mitsui Sumitomo Insurance Group of Japan,
the largest General Insurance Company in Japan and 5th largest insurance group globally.
Chola MS offers a wide range of products that include Accident, Engineering, Health, Liability
and Marine, Motor, Property, Travel and Rural insurance for individuals, SME’s and the
corporate sector.
The company has achieved Rs. 785 crores Gross Written Premium (GWP) mark for 2009-10.
Having posted a remarkable growth of 15% year-on-year, the company has been one of the
fastest growing General Insurance companies for the previous many quarters. The company has a
network of 108 branches across the country. The company offer well-integrated operational
capabilities to ensure the smooth performance of delivery like strong underwriting, tie-ups with
global reinsurers, fast-track claims settlement and cash-free settlement for Health Insurance.
With exposure to various industry sectors and services, Chola MS is fully equipped to provide
world class customer service such as centralized policy issuance, renewal management through
CRM Cell. A toll free helpline number accessible 24 X 7 and a completely interactive and user-
friendly website which makes Chola accessible from anywhere in the world.
Cholamandalam Investment & Finance Company Ltd
Cholamandalam Investment & Finance Company Limited (CIFCL) was incorporated in 1978 as
the financial services arm of the Murugappa Group. The Company that commenced business as
an equipment financing company has now emerged as a comprehensive financial services
solution provider that offers vehicle finance, business finance, home equity loans, stock broking
and distribution of financial products to its customers. The Company operates from over 200
branches across India with an asset under management over Rs.9000 Crores. The subsidiaries of
Cholamandalam include Cholamandalam Securities Limited (CSec) and Cholamandalam
Distribution Limited (CDSL). CIFCL is a subsidiary of TII which holds 60.48% of CIFCL’s
Share Capital.
Sedis
Sedis is a leading manufacturer of Industrial and Engineering Class Chains in France and
possesses a product range covering the requirements of a whole range of industries including the
high growth infrastructure sector.
The brand “Sedis” has strong brand equity and the client list includes names such as:-
Lafarge, Charles De Gaulle airport, BAA Heathrow, Metro net, Cairo Metro, Kone, Otis,
Schindler etc. Sedis has a presence in almost 100 countries through its vast distribution and sales
network. It has two plants in France and a marketing company in the United Kingdom. This
Group is a subsidiary of TI, which holds 77.13%. Sedis possesses superior technology for
manufacture of special and engineering class chains.
2.8 Company Products
Fertilisers Pesticides
Plantations Sugar and Bio-Products
Nutraceuticals
Tube - Automobile
Bearings Stampings Auto & Auto Ancillaries
Transmission Chain Fine Blanking Clutch
Tube - Boiler
1. Self Certification for Boiler tubes
2. Well Known Tube Maker Certification
3. Direct for "U" Bend usage
Bicycles Tube - General
Metal forms
1. Bright Finished tubes for plating application
2. Full Flattening of tubes
3. High Strength tubes
Tube Process
Chapter 3: Review of Literature
3.1 Review of Literature:
Retention management V/S Traditional HR approach
Traditional HR: Systems approach people development from the perspective of developing
competencies in the organization. This can actually be a risk-prone approach, especially for
companies operating in fast evolving industries, since competencies become redundant with time
and new competencies need to be developed. Thus, over time, the entire approach to
development of people might be rendered obsolete calling for rethinking the entire development
initiative.
Retention Management: on the other hand focuses on enhancing the potential of people by
developing capacities. Capacities are the basic DNA of an organization and also of individual
potential.
D Point of Departure
N
Navigation
A
Point of Arrival
3.2 Role of Retention Management:
1. Translating organizational vision into goals and mapping the required level of capacities
and competencies to achieve goals aligning individual values and vision with
organizational values and vision.
2. Clear understanding of the varied roles within the organization and appreciation of the
value-addition from self and others leading to building a culture of trust, sharing and
team orientation.
3. Assessment of talent to profile the level of capacities and set of competencies possessed
within the organization. Enhancing capacities to learn, think relate and act through
development initiatives. Individual growth to meet and accept varied incremental and
transformational roles in an overall scenario of acknowledged need for change.
4. Gap analysis and identification of development path helping individuals realize their full
potential through learning & development.
3.3 Understanding Talent
The idea of developing talent is not a new concept in any business. In fact every successful
company that has 'stood the test of time' has done so, because of their ability to attract, retain and
get the best out of their talent.
This has emerged, not because companies have forgotten about talent, or allowed it drop off of
the radar but, because in some fundamental ways, the talent has changed. We have a new kind of
young person entering the business world, with a very different world view, set of values,
priorities and goals.
Focus 1: Attracting and recruiting Talent:
In order to effectively attract and recruit talented employees.
1. We need to understand what talent is looking for in a career
2. How they will view your business in terms of fitting in with their needs
By examining this through the perspectives of the different generations, we are able to look at
their attitudes to work:
 what kind of career, organization and benefits they are looking for
 What kind of techniques will ensure that your recruitment process is successful in each
generational context?
This focus unit looks at the following:
 Attitudes to work
 Career goals
 Views on organizations and how they are currently run
 What benefits each generation is looking for
 Techniques to attract the different generations: what will make your organization stand
out?
 Techniques to recruit the different generations: how should the job offer be presented?
Focus 2: Retaining and developing Talent
In order to retain and develop talent we need to understand what the generations are looking in a
future career and in an organization. Our approach to each one of our employees needs to be
altered to fit individual goals and personal needs.
This focus unit looks at the following:
 Work ethics and values
 Career planning
 Work environments and culture
 Benefits and reward systems
 Ways of motivating
Focus 3: Managing Talent
In depths look:
 How the generations internalize authority will enable us to adjust our management style
to fit in with what they are.
 We are able to look at the attitudes of the different generations to the leadership and
management;
 What kind of management approaches will ensure that you gain maximum loyalty,
productivity and job satisfaction from each of your employees?
This focus unit looks at the following:
 Attitudes to authority
 Management styles for the different generations including conflict management
 Leadership styles used by the different generations
 Specific techniques to help you manage different generations including communication
and feedback preferences
 Coaching and mentoring preferences including
 The role of coach
 The coaching process
 How to plan for and create conversations
Chapter 4: Data Analysis and Interpretation
4.1 Introduction of Data Analysis.
The word Analysis means the process of breaking down a Complex set of facts into simple element while
Interpretation stands for the explanations which analyzed the statements and also make out or bring out
the meaning of creative work.
Analysis and Interpretation are done according to department wise and according to questionnaire. This
analysis and Interpretation will definitely help to the company for the future strategies. Following are the
analysis and Interpretation of the results.
These all analysis is imagining for general company. It is very necessary to understand the psychological
tendency of employee. Because it is a quietly subjective so it will slightly deviate the opinion of the
employee.
The researched has done his study in the following departments envisaged below. There are 100
employees in each department. Total employees are 500.
 Supply chain and logistics support
 Production/Operations
 Packing and dispatch
 Research and Development
 Finance/Accounts
Retention Questionnaires:
TABLE 1: SHOWING GENDER
Particulars Number of Respondents Total
Male 78 78
Female 22 32
TOTAL 100 100
CHART SHOWING GENDER
Inference
From the above table it is inferred that 78% of the respondents are male, 22% of the respondents
Female.
0
10
20
30
40
50
60
70
80
Male
Female
TABLE 2: SHOWING AGE
Age Number of Respondents Total
20-30 year’s 23 23
31-40 year’s 56 56
41-50 years 15 15
Above 50 years 6 6
TOTAL 100 100
CHART SHOWING AGE
Inference
From the above table it is inferred that 23% of the respondents are 20-30 aged persons,
56% of the respondents are 31-40 aged persons, 15% of the respondents are 41-50 aged persons
and 6% of the respondents are above 50 aged persons.
0
10
20
30
40
50
60
TABLE 3: SHOWING DESIGNATION
Particulars Number of Respondents Total
Junior executive 48 48
Operator 21 21
Manager 31 31
TOTAL 100 100
CHART SHOWING DESIGNATION
Inference
From the above table it is inferred that 48% of the respondents are junior executive, 21% of the
respondents are Operator, and 31% of the respondents are Manager.
0
10
20
30
40
50
60
TABLE 4: SHOWING THE EDUCATIONAL QUALIFICATION OF THE EMPLOYEES
Qualification Number of Employees Total
UG 60 60
PG 20 20
Diploma 10 10
HSC 10 10
TOTAL 100 100
CHART SHOWING THE EDUCATIONAL QUALIFICATION OF THE EMPLOYEES
Inference
From the above table it is inferred that 60% of the respondents are UG, 20% of the respondents
are PG, 10% of the respondents are diploma, and 10% of the respondents are HSC.
0
10
20
30
40
50
60
70
TABLE 5: SHOWING THE EXPRIENCE OF THE EMPLOYEES
Particulars Number of Employees Percentage
Below 5Yrs 55 55
6-10 yrs 15 15
11-15 yrs 10 10
16-20yrs 15 15
Above 20 Yrs 5 5
TOTAL 100 100
CHART SHOWING THE EXPRIENCE OF THE EMPLOYEES
Inference
From the above table it is inferred that 55% of the respondents are below 5yrs, 15% of
the respondents are 6-10yrs, 10% of the respondents are 11-15yrs, 15% of the respondents are
16-20yrs and 5% of the respondents are above 20yrs.
0
10
20
30
40
50
60
Below 5Yrs 6-10 yrs 11-15 yrs 16-20yrs
TABLE 6: SHOWING THE MARITAL STATUS
Particulars Number of Respondents Total
Married 44 44
Single 56 56
TOTAL 100 100
CHART SHOWING MARITAL STATUS
Inference
From the above table it is inferred that 44% of the respondents Married and 56% of the
respondents are Unmarried.
44
56
100
0
20
40
60
80
100
120
Married Single TOTAL
Chart Title
Number of Respondents
Total
TABLE 7: SHOWING THE MONTHLY INCOME
Annual income
Rs
Number of Respondents Total
Below 10000 54 54
10000-20000 15 15
20000-30000 16 16
Above 30000 15 15
TOTAL 100 100
CHART SHOWING MONTHLY INCOME
Inference: From the above table it is inferred that 54% of the respondents are below 10000, 15%
of the respondents are 10000-20000, 16% of the respondents are 20000-30000, and 15% of the
respondents are above 30000.
0
10
20
30
40
50
60
TABLE 8: SHOWING THE RECRUITMENTS
Particulars Number of Respondents Total
Campus Recruitment 54 54
Consultancy 15 15
Direct Recruitment 16 16
Reference 15 15
TOTAL 100 100
CHART SHOWING RECRUITMENTS
Inference: From the above table it is inferred that 54% of the respondents are Campus
Recruitment, 15% of the respondents are Consultancy, 16% of the respondents are Direct
Recruitment, and 15% of the respondents are Reference.
0
10
20
30
40
50
60
TABLE 9: BELOW SHOWS THE JOB SECURITY OF THE EMPLOYEES
REWARDS
ACHIEVEMENT
NUMBER OF
EMPLOYEES
PERCENTAGE
Yes 94 94
No 6 6
TOTAL 100 100
GRAPH BELOW SHOWS THE JOB SECURITY OF THE EMPLOYEES
Inference
From the above table it is inferred that 94% of the respondents are Yes, and 39% of the
respondents are No.
PERCENTAGE OF JOB SECURITY OF THE
EMPLOYEES
Yes
No
TABLE 10: SHOWING THE DIRECT BENEFITS
Particulars Number of Respondents Total
Leave Encashment 28 28
Holiday pay benefits 12 12
Vocation pay benefits 25 25
Worker’s compensation benefits 13 13
Life Insurance benefits 22 22
TOTAL 100 100
CHART SHOWING DIRECT BENEFITS
Inference: From the above table it is inferred that 28% of the respondents are Leave
Encashment, 12% of the respondents are Holiday pay benefits, 25% of the respondents are
Vocation pay benefits, 13% of the respondents are Worker’s compensation benefits and 22% of
the respondents are Life Insurance benefits.
0
5
10
15
20
25
30
35
40
45
50 Leave Encashment
Holiday pay benefits
Vocation pay benefits
Worker’s compensation
benefits
Life Insurance benefits
TABLE 11: SHOWING THE INDIRECT BENEFITS
Particulars Number of Respondents Total
Flexible timings 48 48
Holiday homes 12 12
Hospitalization 24 24
Workplace Flexibility 16 16
TOTAL 100 100
CHART SHOWING INDIRECT BENEFITS
Inference
From the above table it is inferred that 48% of the respondents are Flexible timings, 12% of the
respondents are Holiday homes, 24% of the respondents are Hospitalization, and 16% of the
respondents are Overtime.
48
12
24 16
100
48
12
24 16
100
Chart Title
Number of Respondents Total
TABLE 12: SHOWING THE REGULAR LEARNING PROGRAM OFFERED
Particulars Number of Respondents Total
Yes 68 68
No 32 32
TOTAL 100 100
CHART SHOWING REGULAR LEARNING PROGRAM OFFERED
Inference
From the above table it is inferred that 68% of the respondents are Yes, and 32% of the
respondents are No.
0
10
20
30
40
50
60
70
80
Yes
No
TABLE 13: SHOWING THE TRAINING PROGRAM
Particulars Number of Respondents Total
Strongly Agree 42 42
Agree 11 11
Neutral 41 41
Disagree 4 4
Strongly disagree 2 2
TOTAL 100 100
CHART SHOWING TRAINING PROGRAM
Inference
From the above table it is inferred that 42% of the respondents are strongly agree, 11% of
the respondents are Agree, 41% of the respondents are Neutral,4% of the respondents are
disagree and 2% of the respondents are strongly disagree.
0
5
10
15
20
25
30
35
40
45
Strongly Agree
Agree
Neutral
Disagree
Strongly disagree
TABLE 14: SHOWING THE REGULAR APPRAISALS
Particulars Number of Respondents Total
Yes 79 79
No 21 21
TOTAL 100 100
CHART SHOWING REGULAR APPRAISALS
Inference
From the above table it is inferred that 79% of the respondents are Yes, and 21% of the
respondents are No.
0
10
20
30
40
50
60
70
80
90
TABLE 15: SHOWING THE INTERNAL COMMUNICATION IN MURUGAPPA
GROUP OF COMPANY
Particulars Number of Respondents Total
Good 64 64
Needs improvement 23 23
Not bad 13 13
TOTAL 100 100
CHART SHOWING INTERNAL COMMUNICATION IN MURUGAPPA GROUP OF
COMPANY
Inference
From the above table it is inferred that 64% of the respondents are good, 23% of the respondents
are Needs improvement and 13% of the respondents are not bad.
0
10
20
30
40
50
60
70
TABLE 16: SHOWING THE GOOD RESPONSE FOR VOCATIONAL TALENT
Particulars Number of Respondents Total
Strongly agree 31 31
Agree 21 21
Neutral 40 40
Disagree 5 5
Strongly disagree 3 3
TOTAL 100 100
CHART SHOWING GOOD RESPONSE FOR VOCATIONAL TALENT
Inference : From the above table it is inferred that 31% of the respondents are strongly agree,
21% of the respondents are Agree, 40% of the respondents are Neutral,5% of the respondents are
disagree and 3% of the respondents are strongly disagree.
0
5
10
15
20
25
30
35
40
Strongly agree
Agree
Neutral
Disagree
Strongly
disagree
TABLE 17: SHOWING THE TALENT OF EMPLOYEE AFTER JOINED IN TO THE
COMPANY
Particulars Number of Respondents Total
Good 41 41
Excellent 30 30
No improvement 25 25
Bad 4 4
TOTAL 100 100
CHART SHOWING TALENT OF EMPLOYEE AFTER JOINED IN TO THE
COMPANY
Inference:
From the above table it is inferred that 41% of the respondents are good, 30% of the respondents
are Excellent and 25% of the respondents are No improvement and 4% of the respondents are
bad.
0
20
40
60
80
100
Chart Title
Number of Respondents Total
TABLE 18: SHOWING TALENT RETENTION WORKSHOP
Particulars Number of Respondents Total
Good 46 46
Need Improvement 54 54
Total 100 100
CHART SHOWING TALENT RETENTION WORKSHOP
Inference
From the above table it is inferred that 46% of the respondents are good, 54% of the respondents
are Needs improvement.
0
20
40
60
80
100
120
Good Need
Improvement
Total
Chart Title
Number of Respondents
Total
TABLE 19: SHOWING FEEDBACK MECHANISM IN ORGANIZATION
Particulars Number of Respondents Total
Good 38 38
Indifferent 24 24
Needs Improvement 20 20
Needs a lot improvement 18 18
Total 100 100
CHART SHOWING FEEDBACK MECHANISM IN ORGANIZATION
Inference
From the above table it is inferred that 38% of the respondents are good, 24% of the respondents
are indifferent, 20% of the respondents are Needs improvement, and 18% of the respondents are
needs a lot improvement.
0
20
40
60
80
100
120
Number of Respondents
Total
TABLE 20: SHOWING SATISFIES AN EMPLOYEE IN AN ORGANIZATION
Particulars Number of Respondents Total
Salary 18 18
Designation 20 20
Benefits 12 12
Psychological need
satisfaction
28 28
Training Given 10 10
Employer relation 12 12
Total 100 100
CHART SHOWING SATISFIES AN EMPLOYEE IN AN ORGANIZATION
Inference : From the above table it is inferred that 18% of the respondents are Salary, 20% of
the respondents are Designation, 12% of the respondents are Benefits, and 28% of the
respondents are Psychological need satisfaction.10% of the respondents are Training Given and
12% of the respondents are Employer relation.
0
20
40
60
80
100
120
Number of Respondents
Total
TABLE 21: SHOWING NEEDS TO BE IMPROVED IN ORGANIZATION
Particulars Number of Respondents Total
Work Culture 23 23
Benefits 27 27
Communication 20 20
Feedback Mechanism 30 30
Total 100 100
CHART SHOWING NEEDS TO BE IMPROVED IN ORGANIZATION
Inference
From the above table it is inferred that 11% of the work culture and the 14% Benefits and the 10
% the respondents are Designation, 20% of the respondents are Benefits, and 30% of the
respondents are Feedback Mechanism.
23 27
20
30
100
23 27
20
30
100
0
20
40
60
80
100
120
Number of Respondents Total
TABLE 22: Employee’s performance after implementing Retention Management concept:
Department Good Bad
Purchase 75 25
Finance 90 10
Production 85 15
R & D 80 20
Dispatch 70 30
Total 400 100
Chart showing Employees performance after Implementing Talent Management Initiatives
Inference: In above both diagram we can compare performance of all department, before
implementing concept of Retention Management and after implementing concept of Retention
Management. We can observe that, performance of all departments is increase after
implementing Retention Management concept.
0
50
100
150
200
250
300
350
400
Chart Title
Good
Bad
4.2 Performance appraisals as a tool for Retention:
I. Performance appraisal is a method of evaluating the behavior of employees in the work spot,
normally including both the quantitative and qualitative aspects of job performance. Performance
here refers to the degree of accomplishment of the tasks that make up an individual‘s job. It
indicates how well an individual is fulfilling the job demands. Often the term is confused with
effort, but performance is always measured in terms of results and not efforts.
II. Need of Performance Appraisal:
Performance appraisal is needed in order to:
 Provides information about the performance ranks, basing on which decision regarding salary
fixation, confirmation, promotion, transfer and demotion are taken.
 Provide feedback information about the level of achievement and behavior of subordinate. This
information helps to review the performance of the subordinate, rectifying performance
deficiencies and to set new standards of work, if necessary.
 Provide information, which helps to counsel the subordinate.
 Provide information to diagnose deficiency in employee regarding skill, knowledge, determine
training and developmental needs and to prescribe the means for employee growth provides
information for correcting placement.
 To prevent grievances and in disciplinary activities.
Purpose
Performance appraisal aims at attaining the different purpose. They are:
 To create and maintain a satisfactory level of performance.
 To contribute to the employee growth and development through training self and management
development programs.
 To help the superiors to have a proper understanding about their subordinates.
 To guide the job changes with the help to continuous ranking.
 To facilitate fair and equitable compensation based on performance.
Methods of Performance Appraisal:
The methods of performance Appraisal are basically classified as Traditional Methods, Modern Methods
and result – Oriented Appraisal: -
The Traditional Methods consists of ‘Graphic Rating Scales, Ranking Method, Paired comparison
Method, Forced Distribution Method, Checklist method, APPRAISAL, Group Appraisal and confidential
Report.
Modern Methods of evaluating performance appraisal are ‘Behaviorally Anchored Rating Scales
(BARS)’, BOS, Assessment Center’, Human Resource Accounting’, Management by objectives’,
Psychology Appraisal’.
Uses of Performance Appraisals:-
Performance Improvement: Performance feedback allows the employee, manager, and personnel
specialists to intervene with appropriate actions to improve performance.
Placement Decisions: Promotions, transfers, and demotions are usually based on past or anticipated
performance. Often promotions are a reward for past performance.
Training and Development; Poor performance may indicate the need for retraining. Likewise, good
performance may indicate untapped potential that should be developed.
Career Planning and Development: Performance feedback guides career decisions about specific career
paths one should investigate.
Staffing Process Deficiencies: Good and Bad performance implies strength or weakness in the personnel
department‘s staffing procedures.
Traditional and modern Methods of Performance Appraisal
METHODS OF PERFORMANCE APPRAISAL
Traditional methods Modern Methods
1) Graphic rating scales 1) Behaviorally anchored rating scales
2) Ranking Method 2) Assessment centers/Development centers
3) Paired comparison method 3) Human Asset accounting method
4) Forced distribution method 4) Management by Objectives method
5) Checklist methods 5) 360° Feedback
6) Essay from appraisal
7) Group appraisal
8) Confidential reports.
4.3 Learning and Development - What it means to Retention
Introduction
After an employee selected, placed and introduced her or she must be provided with training facilities.
Training is the act of increasing the knowledge and skills of an employee for doing a particular job.
Training is a short-term educational process and utilizing a systematic and organized procedure by which
employees learn technical knowledge and skills for a definite purpose. Dale S. Beach Define training,
“The organized procedure by which people learn knowledge and/or skill for a definite purpose.” In other
words training improves, changes, moulds the employee’s knowledge, skill, behavior, aptitude, and
attitude towards the requirements of the job and organization. Training refers to the teaching and learning
activity carried on for the primary purpose of helping members on an organization, to acquire and apply
the knowledge, skills, abilities and attitudes needed by a particular job and organization.
Benefits of training for organization
 Lead to prove profitability and/or more positive attitudes towards profit orientation
 Improves the job knowledge and skills at all level of the organization
 Improves the morale of workforce
 Helps people identify with organizational goal
 Helps create a better corporate image
 Aids in organizational development
 Learns from the trainee
 Helps to prepare guideline for work
 Organization gets more effective decision making and problem solving
 It helps to improve labor-management relations.
Benefits to the individual which in turn ultimately should benefit the organization
 Helps the individual in making better decisions and effective problem solving
 Through training and development, motivational variables of achievement, growth,
responsibilities and advancement are internalized and operationised
 It helps to an individual to handle stress tension or conflicts.
 It provides information to improve leadership knowledge.
 Develops a séance of growth in learning
 Improves morale
 Improves impersonal skills
Technological advances:
Every organization in order to survive and to be effective should adopt the latest technology, i.e.
mechanization, computerization, automation. Adoption of the latest technology means and methods will
not be complete until they are manned by employees possessing skill to operate them. So, organization
should train the employee to enrich them in the areas of changing technical skills and knowledge from
time to time.
Human relations:
Trends in approach towards personel management have change from the commodity approach to
partnership approach, crossing the human relations approach. So, today, management of most of the
organization has to maintain human relations besides maintaining sound industrial relations although
hitherto the managers are not accustomed to deal with workers accordingly. So, training in human
relations is necessary to deal with human problems and to maintain human relations.
Methods of Training
The most widely used methods of training used by organizations are classified into two categories: On-
the-Job Training & Off-the-Job Training.
ON-THE-JOB TRAINING
It’s given at the work place by superior in relatively short period of time. This type of training is
cheaper & less time-consuming. This training can be impacted by basically four methods: -
Job Rotation: -
In this method, the trainees move from one job to another, so that he/she should be able to perform
all types of jobs. E.g. In banking industry, employees are trained for both back-end & front-end jobs. In
case of emergency, (absenteeism or resignation), any employee would be able to perform any type of job.
OFF THE JOB TRAINING: -
Lectures/Conferences:-
This approach is well adapted to convey specific information, rules, procedures or methods. This method
is useful, where the information is to be shared among a large number of trainees. The cost per trainee is
low in this method.
Films:
It can provide information & explicitly demonstrate skills that are not easily presented by other
techniques. Motion pictures are often used in conjunction with Conference, discussions to clarify &
amplify those points that the film emphasized.
Simulation Exercise: -
Any training activity that explicitly places the trainee in an artificial environment that closely mirrors
actual working conditions can be considered a Simulation. Simulation activities include case experiences,
experiential exercises, vestibule training, management games & role-play.
Cases: -
Present an in depth description of a particular problem an employee might encounter on the job. The
employee attempts to find and analyze the problem, evaluate alternative courses of action & decide what
course of action would be most satisfactory.
Vestibule Training: -
Employees learn their jobs on the equipment they will be using, but the training is conducted away
from the actual work floor. While expensive, Vestibule training allows employees to get a full feel for
doing task without real world pressures. Additionally, it minimizes the problem of transferring learning to
the job.
.Search for Internal or External trainer:
Internal Trainer: - After assessment of need of training, they search for a trainer in theirs company
who can train there employee. They search trainer among their employees.
External trainer: - If they didn’t find internal trainer then they go for External trainer. They try to find
external professional trainer from their personnel contact, by giving advertisement in news paper etc.
Design program for training: - HR manager or head of the department present there need to trainer.
They assess type of training and design training program by the help of trainer within the budget.
Chapter 5: Findings, Suggestion and
Conclusions
FINDINGS
 From the above survey conducted it is inferred that 78% of the respondents are male,
22% of the respondents Female.
 23% of the respondents are 20-30 aged persons, 56% of the respondents are 31-40 aged
persons, 15% of the respondents are 41-50 aged persons and 6% of the respondents are
above 50 aged persons.
 48% of the respondents are junior executive, 21% of the respondents are Operator, and
31% of the respondents are Manager.
 60% of the respondents are UG, 20% of the respondents are PG, 10% of the respondents
are diploma, and 10% of the respondents are HSC.
 55% of the respondents are below 5yrs, 15% of the respondents are 6-10yrs, 10% of the
respondents are 11-15yrs, 15% of the respondents are 16-20yrs and 5% of the
respondents are above 20yrs.
 44% of the respondents Married and 56% of the respondents are Unmarried.
 54% of the respondents are below 10000, 15% of the respondents are 10000-20000, 16%
of the respondents are 20000-30000, and 15% of the respondents are above 30000.
 54% of the respondents are Campus Recruitment, 15% of the respondents are
Consultancy, 16% of the respondents are Direct Recruitment, and 15% of the respondents
are Reference.
 94% of the respondents are Yes, and 39% of the respondents are No.
 28% of the respondents are Leave Encashment, 12% of the respondents are Holiday pay
benefits, 25% of the respondents are Vocation pay benefits, 13% of the respondents are
Worker’s compensation benefits and 22% of the respondents are Life Insurance benefits.
 48% of the respondents are Flexible timings, 12% of the respondents are Holiday homes,
24% of the respondents are Hospitalization, and 16% of the respondents are Overtime.
 42% of the respondents are strongly agree, 11% of the respondents are Agree, 41% of the
respondents are Neutral,4% of the respondents are disagree and 2% of the respondents
are strongly disagree.
 31% of the respondents are strongly agree, 21% of the respondents are Agree, 40% of the
respondents are Neutral,5% of the respondents are disagree and 3% of the respondents
are strongly disagree.
 18% of the respondents are Salary, 20% of the respondents are Benefits, 24% of the
respondents are Needs Incentives, and 38% of the respondents are Position.
 18% of the respondents are Salary, 20% of the respondents are Designation, 12% of the
respondents are Benefits, and 28% of the respondents are Psychological need
satisfaction.10% of the respondents are Training Given and 12% of the respondents are
Employer relation.
 23% of the respondents are Salary, 27% of the respondents are Designation, 20% of the
respondents are Benefits, and 30% of the respondents are Feedback Mechanism.
Suggestion and Recommendation:
 HR Department should interact and expose inbound employee
 Perform various task to motivate employee for work, because various employee cannot work with
motivation they just do it, because organization pay for them.
 Most of respondent feel that they are well taken care by their employer but still should have
regular meeting with employees and ask about their feedback.
 New training session should be there to update employee’s skills.
 Equal promotion opportunity should be given at correct interval.
Conclusion:
Retaining Retention Management for the HR Community is an opportunity for HR professionals to
develop in their areas of expertise and in their careers. A strong HR Community helps create a strong
public service. The goal of Retention Management is to better understand our people in the HR
Community so we can support professional and career development and align individual needs and goals
with the business focus of HR. We also want to ensure that we as a Community have the ability to
develop people so that we are meeting the future needs of the community and government and our clients.
This first broad sweep of the Community provides a foundation on which to ensure leadership continuity,
knowledge transfer and service continuity.
The initial implementation resulted in a number of important human resource priorities and strategies,
such as performance management, leadership and management development, attraction and retention,
employee learning and development and culture, all of which are supported by the HR Strategy for the
HR Community.
The critical next step in the process is the implementation of the Retaining Retention Management. Plan
for the HR Community. Individually, members of the community and their managers should work
together to move forward individual career development plans.
The HR Community must work together to promote a Retention Management mindset,
Commit to supporting development as a professional group, and integrate Retention Management into the
daily fabric of doing business.
Retention: We understand it help to developing and implementing practices that reward and support
employees. Employee development: Retention Management ensuring continuous informal and formal
learning and development. Performance management: Retention Management is specific processes that
nurture and support performance, including feedback/measurement.
Testing of Hypothesis
Retention Management has been developed as a platform for corporate world to manage talents of
employee, for company benefits.
From above surveys and changes in performance report getting follows information:
For company Retention Management is effective process.
Retention Management is effective for Company if: Remark from “ Data of
Analysis”
= Yes OR X = No
Quality of the Product increase.
Ratio of employees to left job is decrease, and new candidate are
increase in organization.
Employee getting satisfaction from the job
Complaints of employee reduced.
Above table show that all the criteria set for Company, to show effective Retention Management process,
which is helpful to employee as well as organization.
Therefore project is proved the Null hypothesis & disprove the alternative hypothesis.
Null Hypothesis:
 Employee taking benefits from Retention Management System
 Employee can retain successfully for the benefit of organization
 Employee’s performance increased by Retention Management
 Employee turnover of organization affected by Retention Management Procedure
Appendices
Company Workshop
Name of Employee:
Roll No.
Department:
Designation:
Joining Date:
Qualification:
Bibliography
Bibliography
I am overwhelmed in presenting my MBA project report in Murugappa Group of Company
works for this I wish to express my deep sense of gratitude for following web sources and
authors to take their references for these projects.
Books:
1) Human Resource Management ---- Margam Publications
2) Human Resource Management System ----- Prof. Mr. Subbarao
3) Human Resource Management ---------- Jyotsna Bhatnagar
4) Retention Management ---- Zarmilaemba
Web Sources:
1) Oneclickhr.com
2) Weckipedia.com
3) Google.com
4) Amanet.org
5) Cityhr.com
Questionnaires
Questionnaires
1. Name :
2. Gender : □ Male □ Female
3. Age : □ 20-30 year’s □ 31-40 year’s □ 41-50 years □ above 50 years
4. Designation : □ junior executive □ Operator □ Manager and above
5. Qualification : □ UG □ PG □ Diploma □ HSC.
6. Work Experience : □ below 5Yrs □ 6-10 yrs □ 11-15 yrs. □16-20yrs
7. How did you get placed in your organization?
a) Campus Recruitment
b) Consultancy
c) Direct Recruitment
d) Reference
8. Are you offered any variable benefits for your deliverables?
a) Yes
b) No
9. What Direct benefits do you get from your company?
a) Leave Encashment
b) Holiday pay benefits
c) Vocation pay benefits
d) Worker’s compensation benefits
10. What indirect benefits do you get from your company?
a) Flexible timings
b) Holiday homes
c) Hospitalization
d) Overtime
11. Are you being given ongoing or continuous training program in your organization?
a) Yes
b) No
12. Do the performance appraisal system is done in organization.
a) Annually
b) Half yearly
c) Quarterly
d) Monthly
13. How do you feel is the Internal communication of your organization?
a) Good
b) Needs improvement
c) Not bad
14. Are you satisfied with the performance appraisal mechanism?
a) Yes
b) No
15. What do you think about your talent after joined in to the company?
a) Good
b) Excellent
c) No improvement
d) Bad
16. What do you feel about your talent retention workshop?
a) Good
b) Need improvement
c) Satisfactory
d) Unsatisfied
17. How effective do you feel is the feedback mechanism in your organization?
a) Good
b) Indifferent
c) Needs improvement
d) Needs a lot of improvement
18. What in your opinion satisfies an employee the most in an organization?
a) Salary
b) Designation
c) Benefits
19. What according to you needs to be improved in your organization?
a) Work Culture
b) Benefits
c) Communication
20. Do you feel satisfaction while you complete your work?
a) Yes
b) No

More Related Content

What's hot

Summer training project for finance
Summer training project for financeSummer training project for finance
Summer training project for financejaiswal123456789
 
Research project report on 4th sem of mba
Research project report on  4th sem of mbaResearch project report on  4th sem of mba
Research project report on 4th sem of mbaMohd Affan Ali
 
PROJECT ON JOB SATISFACTION
PROJECT ON JOB SATISFACTIONPROJECT ON JOB SATISFACTION
PROJECT ON JOB SATISFACTIONPavani Guduru
 
List of mba project topics reports
List of  mba project topics  reportsList of  mba project topics  reports
List of mba project topics reportsBabasab Patil
 
Project working capital management
Project working capital managementProject working capital management
Project working capital managementThoudamSuraj1
 
Financial Statement Analysis With The Help of Ratios (Suyesh Metel Pressing p...
Financial Statement Analysis With The Help of Ratios (Suyesh Metel Pressing p...Financial Statement Analysis With The Help of Ratios (Suyesh Metel Pressing p...
Financial Statement Analysis With The Help of Ratios (Suyesh Metel Pressing p...Avinash Labade
 
Employee motivation FOR MBA FROJECT
Employee motivation FOR MBA FROJECTEmployee motivation FOR MBA FROJECT
Employee motivation FOR MBA FROJECTJohn Ap
 
MBA Summer Training Project Report
MBA Summer Training Project Report MBA Summer Training Project Report
MBA Summer Training Project Report Aparna Sharma
 
Finance projects topics
Finance projects topicsFinance projects topics
Finance projects topicsBabasab Patil
 
MBA Report on Recruitment and Selection procedure
MBA Report on Recruitment and Selection procedure MBA Report on Recruitment and Selection procedure
MBA Report on Recruitment and Selection procedure samra khan
 
Project report on working capital management
Project report on working capital managementProject report on working capital management
Project report on working capital managementProjects Kart
 
WORKING CAPITAL MANAGEMENT PROJECT REPORT
WORKING CAPITAL MANAGEMENT PROJECT REPORTWORKING CAPITAL MANAGEMENT PROJECT REPORT
WORKING CAPITAL MANAGEMENT PROJECT REPORTRajeshwar Ojha
 
Project report on Employee Satisfaction
 Project report on Employee Satisfaction Project report on Employee Satisfaction
Project report on Employee SatisfactionMegha Sanghavi
 
recruitment and selection policy of reliance
recruitment and selection policy of reliancerecruitment and selection policy of reliance
recruitment and selection policy of reliancebunnysharma
 
Project report on evaluation of recruitment and selection process
Project report on evaluation of recruitment and selection processProject report on evaluation of recruitment and selection process
Project report on evaluation of recruitment and selection processElina Pari
 
SIP Project Report by Vivek Goyal
SIP Project Report by Vivek GoyalSIP Project Report by Vivek Goyal
SIP Project Report by Vivek GoyalVivek Goyal
 

What's hot (20)

Summer training project for finance
Summer training project for financeSummer training project for finance
Summer training project for finance
 
Research project report on 4th sem of mba
Research project report on  4th sem of mbaResearch project report on  4th sem of mba
Research project report on 4th sem of mba
 
MBA Internship.ppt
MBA Internship.pptMBA Internship.ppt
MBA Internship.ppt
 
PROJECT ON JOB SATISFACTION
PROJECT ON JOB SATISFACTIONPROJECT ON JOB SATISFACTION
PROJECT ON JOB SATISFACTION
 
List of mba project topics reports
List of  mba project topics  reportsList of  mba project topics  reports
List of mba project topics reports
 
Project working capital management
Project working capital managementProject working capital management
Project working capital management
 
Ratio analysis project
Ratio analysis project Ratio analysis project
Ratio analysis project
 
Financial Statement Analysis With The Help of Ratios (Suyesh Metel Pressing p...
Financial Statement Analysis With The Help of Ratios (Suyesh Metel Pressing p...Financial Statement Analysis With The Help of Ratios (Suyesh Metel Pressing p...
Financial Statement Analysis With The Help of Ratios (Suyesh Metel Pressing p...
 
Employee motivation FOR MBA FROJECT
Employee motivation FOR MBA FROJECTEmployee motivation FOR MBA FROJECT
Employee motivation FOR MBA FROJECT
 
MBA Summer Training Project Report
MBA Summer Training Project Report MBA Summer Training Project Report
MBA Summer Training Project Report
 
Finance projects topics
Finance projects topicsFinance projects topics
Finance projects topics
 
MBA Report on Recruitment and Selection procedure
MBA Report on Recruitment and Selection procedure MBA Report on Recruitment and Selection procedure
MBA Report on Recruitment and Selection procedure
 
Project report on working capital management
Project report on working capital managementProject report on working capital management
Project report on working capital management
 
WORKING CAPITAL MANAGEMENT PROJECT REPORT
WORKING CAPITAL MANAGEMENT PROJECT REPORTWORKING CAPITAL MANAGEMENT PROJECT REPORT
WORKING CAPITAL MANAGEMENT PROJECT REPORT
 
Project report on Employee Satisfaction
 Project report on Employee Satisfaction Project report on Employee Satisfaction
Project report on Employee Satisfaction
 
recruitment and selection policy of reliance
recruitment and selection policy of reliancerecruitment and selection policy of reliance
recruitment and selection policy of reliance
 
‘Human resources recuritment’ project report
‘Human resources recuritment’ project report‘Human resources recuritment’ project report
‘Human resources recuritment’ project report
 
Bba project
Bba projectBba project
Bba project
 
Project report on evaluation of recruitment and selection process
Project report on evaluation of recruitment and selection processProject report on evaluation of recruitment and selection process
Project report on evaluation of recruitment and selection process
 
SIP Project Report by Vivek Goyal
SIP Project Report by Vivek GoyalSIP Project Report by Vivek Goyal
SIP Project Report by Vivek Goyal
 

Viewers also liked

BHP on Murugappa group
BHP on Murugappa groupBHP on Murugappa group
BHP on Murugappa groupSri Krishna
 
murugappa group- the complete world.
 murugappa group- the complete world. murugappa group- the complete world.
murugappa group- the complete world.Dhruv Agarwal
 
Strategic Leadership - Murugappa group
Strategic Leadership - Murugappa groupStrategic Leadership - Murugappa group
Strategic Leadership - Murugappa groupCharlotte L
 
Road ahead - Murugappa Presentation
Road ahead - Murugappa PresentationRoad ahead - Murugappa Presentation
Road ahead - Murugappa PresentationPixel
 
Indian family businesses
Indian family businessesIndian family businesses
Indian family businessesmaheshtcm
 

Viewers also liked (6)

BHP on Murugappa group
BHP on Murugappa groupBHP on Murugappa group
BHP on Murugappa group
 
murugappa group- the complete world.
 murugappa group- the complete world. murugappa group- the complete world.
murugappa group- the complete world.
 
Strategic Leadership - Murugappa group
Strategic Leadership - Murugappa groupStrategic Leadership - Murugappa group
Strategic Leadership - Murugappa group
 
Road ahead - Murugappa Presentation
Road ahead - Murugappa PresentationRoad ahead - Murugappa Presentation
Road ahead - Murugappa Presentation
 
Indian family businesses
Indian family businessesIndian family businesses
Indian family businesses
 
Mba project report
Mba project reportMba project report
Mba project report
 

Similar to Mba hr & finance project may 2014

ATTRITION MANAGEMENT.pdf
ATTRITION MANAGEMENT.pdfATTRITION MANAGEMENT.pdf
ATTRITION MANAGEMENT.pdfTina Gabel
 
A_SUMMER_TRAINING_REPORT_ON_RECRUITMENT.docx
A_SUMMER_TRAINING_REPORT_ON_RECRUITMENT.docxA_SUMMER_TRAINING_REPORT_ON_RECRUITMENT.docx
A_SUMMER_TRAINING_REPORT_ON_RECRUITMENT.docxRavinderpunia4
 
A study on_the_retention_issues_at_metlife_india_insurance_co[1]
A study on_the_retention_issues_at_metlife_india_insurance_co[1]A study on_the_retention_issues_at_metlife_india_insurance_co[1]
A study on_the_retention_issues_at_metlife_india_insurance_co[1]anishu89
 
Institute of management studies
Institute of management studiesInstitute of management studies
Institute of management studiesSumit Giri
 
Real World Talent Management.pdf
Real World Talent Management.pdfReal World Talent Management.pdf
Real World Talent Management.pdfVANDANANARWAL1
 
Developing employees
Developing employeesDeveloping employees
Developing employeesAhmad Thanin
 
A study on the Employee Satisfaction
A study on the Employee SatisfactionA study on the Employee Satisfaction
A study on the Employee SatisfactionAtul K. Shukla
 
Talent management
Talent managementTalent management
Talent managementRiTu Karn
 
talentmanagement-131005132409-phpapp01.pdf
talentmanagement-131005132409-phpapp01.pdftalentmanagement-131005132409-phpapp01.pdf
talentmanagement-131005132409-phpapp01.pdfLanaSami2
 
A STUDY ON RECRUITMENT AND SELECTION AT VIDYA GLOBAL ACADEMY
A STUDY ON RECRUITMENT AND SELECTION AT VIDYA GLOBAL ACADEMYA STUDY ON RECRUITMENT AND SELECTION AT VIDYA GLOBAL ACADEMY
A STUDY ON RECRUITMENT AND SELECTION AT VIDYA GLOBAL ACADEMYVijayKumar6072
 
Effects Of Hr Practices On Organizational Performance
Effects Of Hr Practices On Organizational PerformanceEffects Of Hr Practices On Organizational Performance
Effects Of Hr Practices On Organizational PerformancePatricia Johnson
 
Talent management practices of corporates
Talent management practices of corporatesTalent management practices of corporates
Talent management practices of corporatesTanyaSingh528655
 
40092775 project-report-on-recruitment-and-selection-by-preeti-converted
40092775 project-report-on-recruitment-and-selection-by-preeti-converted40092775 project-report-on-recruitment-and-selection-by-preeti-converted
40092775 project-report-on-recruitment-and-selection-by-preeti-convertedDeepVyas25
 
Identificationoftraining
IdentificationoftrainingIdentificationoftraining
IdentificationoftrainingV Venkateswarlu
 
Human Resource Development In Apollo Hospital Mysore
Human Resource Development In Apollo Hospital MysoreHuman Resource Development In Apollo Hospital Mysore
Human Resource Development In Apollo Hospital MysoreAMU
 

Similar to Mba hr & finance project may 2014 (20)

ATTRITION MANAGEMENT.pdf
ATTRITION MANAGEMENT.pdfATTRITION MANAGEMENT.pdf
ATTRITION MANAGEMENT.pdf
 
Talent management
Talent managementTalent management
Talent management
 
NFED Paper Presentation(2)
NFED Paper Presentation(2)NFED Paper Presentation(2)
NFED Paper Presentation(2)
 
A_SUMMER_TRAINING_REPORT_ON_RECRUITMENT.docx
A_SUMMER_TRAINING_REPORT_ON_RECRUITMENT.docxA_SUMMER_TRAINING_REPORT_ON_RECRUITMENT.docx
A_SUMMER_TRAINING_REPORT_ON_RECRUITMENT.docx
 
A study on_the_retention_issues_at_metlife_india_insurance_co[1]
A study on_the_retention_issues_at_metlife_india_insurance_co[1]A study on_the_retention_issues_at_metlife_india_insurance_co[1]
A study on_the_retention_issues_at_metlife_india_insurance_co[1]
 
Institute of management studies
Institute of management studiesInstitute of management studies
Institute of management studies
 
Real World Talent Management.pdf
Real World Talent Management.pdfReal World Talent Management.pdf
Real World Talent Management.pdf
 
Developing employees
Developing employeesDeveloping employees
Developing employees
 
A study on the Employee Satisfaction
A study on the Employee SatisfactionA study on the Employee Satisfaction
A study on the Employee Satisfaction
 
Talent management
Talent managementTalent management
Talent management
 
TM Unit 1 12-10-22.pptx
TM Unit 1 12-10-22.pptxTM Unit 1 12-10-22.pptx
TM Unit 1 12-10-22.pptx
 
talentmanagement-131005132409-phpapp01.pdf
talentmanagement-131005132409-phpapp01.pdftalentmanagement-131005132409-phpapp01.pdf
talentmanagement-131005132409-phpapp01.pdf
 
A STUDY ON RECRUITMENT AND SELECTION AT VIDYA GLOBAL ACADEMY
A STUDY ON RECRUITMENT AND SELECTION AT VIDYA GLOBAL ACADEMYA STUDY ON RECRUITMENT AND SELECTION AT VIDYA GLOBAL ACADEMY
A STUDY ON RECRUITMENT AND SELECTION AT VIDYA GLOBAL ACADEMY
 
Effects Of Hr Practices On Organizational Performance
Effects Of Hr Practices On Organizational PerformanceEffects Of Hr Practices On Organizational Performance
Effects Of Hr Practices On Organizational Performance
 
Talent management practices of corporates
Talent management practices of corporatesTalent management practices of corporates
Talent management practices of corporates
 
Talent Management
Talent ManagementTalent Management
Talent Management
 
40092775 project-report-on-recruitment-and-selection-by-preeti-converted
40092775 project-report-on-recruitment-and-selection-by-preeti-converted40092775 project-report-on-recruitment-and-selection-by-preeti-converted
40092775 project-report-on-recruitment-and-selection-by-preeti-converted
 
Identificationoftraining
IdentificationoftrainingIdentificationoftraining
Identificationoftraining
 
Human Resource Development In Apollo Hospital Mysore
Human Resource Development In Apollo Hospital MysoreHuman Resource Development In Apollo Hospital Mysore
Human Resource Development In Apollo Hospital Mysore
 
Employee Motivation
Employee MotivationEmployee Motivation
Employee Motivation
 

More from City Union Bank Ltd (20)

Human Resource Information Systems
Human Resource Information SystemsHuman Resource Information Systems
Human Resource Information Systems
 
Industrial, labour and General laws
Industrial, labour and General lawsIndustrial, labour and General laws
Industrial, labour and General laws
 
Managing talent
Managing talentManaging talent
Managing talent
 
Internet history and growth
Internet history and growthInternet history and growth
Internet history and growth
 
Really rare photos
Really rare photosReally rare photos
Really rare photos
 
Managing talent
Managing talentManaging talent
Managing talent
 
Employment law
Employment lawEmployment law
Employment law
 
Employment Legislation MBA - HRM Notes
Employment Legislation MBA - HRM  NotesEmployment Legislation MBA - HRM  Notes
Employment Legislation MBA - HRM Notes
 
Tally 9 Shortcut keys
Tally 9 Shortcut keysTally 9 Shortcut keys
Tally 9 Shortcut keys
 
Pictures of Earth
Pictures of EarthPictures of Earth
Pictures of Earth
 
40 Pieces of Advice
40 Pieces of Advice40 Pieces of Advice
40 Pieces of Advice
 
Tata Consultancy Services (Question Bank )
Tata Consultancy Services (Question Bank )Tata Consultancy Services (Question Bank )
Tata Consultancy Services (Question Bank )
 
Dividend policy
Dividend policyDividend policy
Dividend policy
 
Human resource management (mba)
Human resource management (mba) Human resource management (mba)
Human resource management (mba)
 
Strategic management
Strategic managementStrategic management
Strategic management
 
Research methodology notes
Research methodology notesResearch methodology notes
Research methodology notes
 
Production function
Production functionProduction function
Production function
 
Monetary policy
Monetary policyMonetary policy
Monetary policy
 
Markets
MarketsMarkets
Markets
 
Managerial economics
Managerial economicsManagerial economics
Managerial economics
 

Recently uploaded

Music 9 - 4th quarter - Vocal Music of the Romantic Period.pptx
Music 9 - 4th quarter - Vocal Music of the Romantic Period.pptxMusic 9 - 4th quarter - Vocal Music of the Romantic Period.pptx
Music 9 - 4th quarter - Vocal Music of the Romantic Period.pptxleah joy valeriano
 
Barangay Council for the Protection of Children (BCPC) Orientation.pptx
Barangay Council for the Protection of Children (BCPC) Orientation.pptxBarangay Council for the Protection of Children (BCPC) Orientation.pptx
Barangay Council for the Protection of Children (BCPC) Orientation.pptxCarlos105
 
Daily Lesson Plan in Mathematics Quarter 4
Daily Lesson Plan in Mathematics Quarter 4Daily Lesson Plan in Mathematics Quarter 4
Daily Lesson Plan in Mathematics Quarter 4JOYLYNSAMANIEGO
 
How to do quick user assign in kanban in Odoo 17 ERP
How to do quick user assign in kanban in Odoo 17 ERPHow to do quick user assign in kanban in Odoo 17 ERP
How to do quick user assign in kanban in Odoo 17 ERPCeline George
 
ROLES IN A STAGE PRODUCTION in arts.pptx
ROLES IN A STAGE PRODUCTION in arts.pptxROLES IN A STAGE PRODUCTION in arts.pptx
ROLES IN A STAGE PRODUCTION in arts.pptxVanesaIglesias10
 
Earth Day Presentation wow hello nice great
Earth Day Presentation wow hello nice greatEarth Day Presentation wow hello nice great
Earth Day Presentation wow hello nice greatYousafMalik24
 
Full Stack Web Development Course for Beginners
Full Stack Web Development Course  for BeginnersFull Stack Web Development Course  for Beginners
Full Stack Web Development Course for BeginnersSabitha Banu
 
Inclusivity Essentials_ Creating Accessible Websites for Nonprofits .pdf
Inclusivity Essentials_ Creating Accessible Websites for Nonprofits .pdfInclusivity Essentials_ Creating Accessible Websites for Nonprofits .pdf
Inclusivity Essentials_ Creating Accessible Websites for Nonprofits .pdfTechSoup
 
INTRODUCTION TO CATHOLIC CHRISTOLOGY.pptx
INTRODUCTION TO CATHOLIC CHRISTOLOGY.pptxINTRODUCTION TO CATHOLIC CHRISTOLOGY.pptx
INTRODUCTION TO CATHOLIC CHRISTOLOGY.pptxHumphrey A Beña
 
Integumentary System SMP B. Pharm Sem I.ppt
Integumentary System SMP B. Pharm Sem I.pptIntegumentary System SMP B. Pharm Sem I.ppt
Integumentary System SMP B. Pharm Sem I.pptshraddhaparab530
 
Global Lehigh Strategic Initiatives (without descriptions)
Global Lehigh Strategic Initiatives (without descriptions)Global Lehigh Strategic Initiatives (without descriptions)
Global Lehigh Strategic Initiatives (without descriptions)cama23
 
GRADE 4 - SUMMATIVE TEST QUARTER 4 ALL SUBJECTS
GRADE 4 - SUMMATIVE TEST QUARTER 4 ALL SUBJECTSGRADE 4 - SUMMATIVE TEST QUARTER 4 ALL SUBJECTS
GRADE 4 - SUMMATIVE TEST QUARTER 4 ALL SUBJECTSJoshuaGantuangco2
 
Grade 9 Quarter 4 Dll Grade 9 Quarter 4 DLL.pdf
Grade 9 Quarter 4 Dll Grade 9 Quarter 4 DLL.pdfGrade 9 Quarter 4 Dll Grade 9 Quarter 4 DLL.pdf
Grade 9 Quarter 4 Dll Grade 9 Quarter 4 DLL.pdfJemuel Francisco
 
ANG SEKTOR NG agrikultura.pptx QUARTER 4
ANG SEKTOR NG agrikultura.pptx QUARTER 4ANG SEKTOR NG agrikultura.pptx QUARTER 4
ANG SEKTOR NG agrikultura.pptx QUARTER 4MiaBumagat1
 
Student Profile Sample - We help schools to connect the data they have, with ...
Student Profile Sample - We help schools to connect the data they have, with ...Student Profile Sample - We help schools to connect the data they have, with ...
Student Profile Sample - We help schools to connect the data they have, with ...Seán Kennedy
 
Transaction Management in Database Management System
Transaction Management in Database Management SystemTransaction Management in Database Management System
Transaction Management in Database Management SystemChristalin Nelson
 
Incoming and Outgoing Shipments in 3 STEPS Using Odoo 17
Incoming and Outgoing Shipments in 3 STEPS Using Odoo 17Incoming and Outgoing Shipments in 3 STEPS Using Odoo 17
Incoming and Outgoing Shipments in 3 STEPS Using Odoo 17Celine George
 
Visit to a blind student's school🧑‍🦯🧑‍🦯(community medicine)
Visit to a blind student's school🧑‍🦯🧑‍🦯(community medicine)Visit to a blind student's school🧑‍🦯🧑‍🦯(community medicine)
Visit to a blind student's school🧑‍🦯🧑‍🦯(community medicine)lakshayb543
 
Activity 2-unit 2-update 2024. English translation
Activity 2-unit 2-update 2024. English translationActivity 2-unit 2-update 2024. English translation
Activity 2-unit 2-update 2024. English translationRosabel UA
 

Recently uploaded (20)

Music 9 - 4th quarter - Vocal Music of the Romantic Period.pptx
Music 9 - 4th quarter - Vocal Music of the Romantic Period.pptxMusic 9 - 4th quarter - Vocal Music of the Romantic Period.pptx
Music 9 - 4th quarter - Vocal Music of the Romantic Period.pptx
 
Barangay Council for the Protection of Children (BCPC) Orientation.pptx
Barangay Council for the Protection of Children (BCPC) Orientation.pptxBarangay Council for the Protection of Children (BCPC) Orientation.pptx
Barangay Council for the Protection of Children (BCPC) Orientation.pptx
 
Daily Lesson Plan in Mathematics Quarter 4
Daily Lesson Plan in Mathematics Quarter 4Daily Lesson Plan in Mathematics Quarter 4
Daily Lesson Plan in Mathematics Quarter 4
 
How to do quick user assign in kanban in Odoo 17 ERP
How to do quick user assign in kanban in Odoo 17 ERPHow to do quick user assign in kanban in Odoo 17 ERP
How to do quick user assign in kanban in Odoo 17 ERP
 
ROLES IN A STAGE PRODUCTION in arts.pptx
ROLES IN A STAGE PRODUCTION in arts.pptxROLES IN A STAGE PRODUCTION in arts.pptx
ROLES IN A STAGE PRODUCTION in arts.pptx
 
Raw materials used in Herbal Cosmetics.pptx
Raw materials used in Herbal Cosmetics.pptxRaw materials used in Herbal Cosmetics.pptx
Raw materials used in Herbal Cosmetics.pptx
 
Earth Day Presentation wow hello nice great
Earth Day Presentation wow hello nice greatEarth Day Presentation wow hello nice great
Earth Day Presentation wow hello nice great
 
Full Stack Web Development Course for Beginners
Full Stack Web Development Course  for BeginnersFull Stack Web Development Course  for Beginners
Full Stack Web Development Course for Beginners
 
Inclusivity Essentials_ Creating Accessible Websites for Nonprofits .pdf
Inclusivity Essentials_ Creating Accessible Websites for Nonprofits .pdfInclusivity Essentials_ Creating Accessible Websites for Nonprofits .pdf
Inclusivity Essentials_ Creating Accessible Websites for Nonprofits .pdf
 
INTRODUCTION TO CATHOLIC CHRISTOLOGY.pptx
INTRODUCTION TO CATHOLIC CHRISTOLOGY.pptxINTRODUCTION TO CATHOLIC CHRISTOLOGY.pptx
INTRODUCTION TO CATHOLIC CHRISTOLOGY.pptx
 
Integumentary System SMP B. Pharm Sem I.ppt
Integumentary System SMP B. Pharm Sem I.pptIntegumentary System SMP B. Pharm Sem I.ppt
Integumentary System SMP B. Pharm Sem I.ppt
 
Global Lehigh Strategic Initiatives (without descriptions)
Global Lehigh Strategic Initiatives (without descriptions)Global Lehigh Strategic Initiatives (without descriptions)
Global Lehigh Strategic Initiatives (without descriptions)
 
GRADE 4 - SUMMATIVE TEST QUARTER 4 ALL SUBJECTS
GRADE 4 - SUMMATIVE TEST QUARTER 4 ALL SUBJECTSGRADE 4 - SUMMATIVE TEST QUARTER 4 ALL SUBJECTS
GRADE 4 - SUMMATIVE TEST QUARTER 4 ALL SUBJECTS
 
Grade 9 Quarter 4 Dll Grade 9 Quarter 4 DLL.pdf
Grade 9 Quarter 4 Dll Grade 9 Quarter 4 DLL.pdfGrade 9 Quarter 4 Dll Grade 9 Quarter 4 DLL.pdf
Grade 9 Quarter 4 Dll Grade 9 Quarter 4 DLL.pdf
 
ANG SEKTOR NG agrikultura.pptx QUARTER 4
ANG SEKTOR NG agrikultura.pptx QUARTER 4ANG SEKTOR NG agrikultura.pptx QUARTER 4
ANG SEKTOR NG agrikultura.pptx QUARTER 4
 
Student Profile Sample - We help schools to connect the data they have, with ...
Student Profile Sample - We help schools to connect the data they have, with ...Student Profile Sample - We help schools to connect the data they have, with ...
Student Profile Sample - We help schools to connect the data they have, with ...
 
Transaction Management in Database Management System
Transaction Management in Database Management SystemTransaction Management in Database Management System
Transaction Management in Database Management System
 
Incoming and Outgoing Shipments in 3 STEPS Using Odoo 17
Incoming and Outgoing Shipments in 3 STEPS Using Odoo 17Incoming and Outgoing Shipments in 3 STEPS Using Odoo 17
Incoming and Outgoing Shipments in 3 STEPS Using Odoo 17
 
Visit to a blind student's school🧑‍🦯🧑‍🦯(community medicine)
Visit to a blind student's school🧑‍🦯🧑‍🦯(community medicine)Visit to a blind student's school🧑‍🦯🧑‍🦯(community medicine)
Visit to a blind student's school🧑‍🦯🧑‍🦯(community medicine)
 
Activity 2-unit 2-update 2024. English translation
Activity 2-unit 2-update 2024. English translationActivity 2-unit 2-update 2024. English translation
Activity 2-unit 2-update 2024. English translation
 

Mba hr & finance project may 2014

  • 1. “A CASE STUDY ON RETAINING THE BEST TALENTS IN MURUGAPPA GROUP OF COMPANIES CHENNAI” PROJECT REPORT (A Report submitted in Partial Fulfillment of the requirements for the degree of Master of Business Administration in Pondicherry University) Submitted by ANIL KUMAR KHADKA ENROLLMENT NO: 0212390591 MBA Human Resource Management (Course Code 039) DIRECTORATE OF DISTANCE EDUCATION PONDICHERRY UNIVERSITY PONDICHERRY – 605 014 May 2014
  • 2. CERTIFICATE OF THE GUIDE This is to certify that the Project Work titled “A CASE STUDY ON RETAINING THE BEST TALENTS IN MURUGAPPA GROUP OF COMPANIES CHENNAI” is a bonafide work of ANIL KUMAR KHADKA, Enroll No: 0212390591 carried out in partial fulfillment for the award of degree of MBA Human Resource Management of Pondicherry University under my guidance. This Project work is original and not submitted earlier for the award of any degree/diploma or associate ship of any other University/Institution. Place: Chennai Signature of the guide Date: Prof. R. SELVAPARY M.A., M.Phil Department of Economics (Visiting Faculty) PULC – Twinning Programme Loyola College. Chennai – 600 034
  • 3. STUDENTS’S DECLARATION I, ANIL KUMAR KHADKA hereby declare that the Project Work titled “A CASE STUDY ON RETAINING THE BEST TALENTS IN MURUGAPPA GROUP OF COMPANIES CHENNAI” is the original work done by me and submitted to the Pondicherry University in partial fulfillment of requirements for the award of Master of Business Administration in Human Resource Management is a record of original work done by me under the Supervision of Prof.R. SELVAPARY M.A., M.Phil. Enroll No: 0212390591 Signature of the Student Date :
  • 4. ACKNOWLEDGEMENT I would like to thank the Co- ordinator, Pondicherry University and Loyola College Twinning Programme for providing all the encouragement and valuable inputs to do the project work by organizing seminars. I wish to convey my heartfelt thanks to Prof. R. SELVA PARY. M.A., M.Phil., Dept. of Economics Loyola College, Ch-34, Visiting faculty Human Resource Management, Pondicherry University- Loyola Twinning program for giving me all the valuable guidance to improvise the project. I would like to thank “MURUGAPPA GROUP OF COMPANIES” for providing me an opportunity to work with them and giving necessary guidance in completing the project to the best of my abilities. I am obliged to Mr.PARTHASARATHY, Senior HR Manager and Mr.MURALI GIRI, Senior Admin Manager - IT - Projects, Murugappa Group of Companies, Chennai who provided me the essential information and extended his best support. I would like to extend special gratitude to Mr. PARTHASARATHY, Senior HR Manager and Mr.MURALI GIRI Senior Admin Manager IT - Projects, Murugappa Group of Companies, for being my company guide and providing me an insight into various issues pertaining to cases mentioned in the report. This is his sincere support and consistent guidance that led to the completion of the project. Finally it is my foremost duty to express my gratitude to my parents, sister and friends for their moral support and encouragement without which would have not be a complete one. (ANIL KUMAR KHADKA)
  • 5. EXECUTIVE AND SUMMERY Every organization needs inventory for smooth running of its activities. It serves as a link between production and distribution processes. The investment in inventories constitutes the most significant part of current assets/working capital in most of the undertakings. Thus, it is very essential to have proper control and management of inventories. The purpose of inventory management is to ensure availability of materials in sufficient quantity as and when required and also to minimize investment in inventories. Raw materials, goods in process and finished goods all represent various forms of inventory. Each type represents money tied up until the inventory leaves the company as purchased products. Because of the large size of the inventories maintained by firms, a considerable amount of funds is required to be committed to them. It is therefore absolutely imperative to manage inventories efficiently and effectively in order to avoid unnecessary investments. A firm neglecting the management of inventories will be jeopardizing its long run profitability and may fail ultimately. The reduction in excessive inventories carries a favorable impact on the company’s profitability. The study starts with an introduction to inventory management, Company’s profile, Achievements and also the need for study, review of literature and objectives are set out for the study. Research methodology, Data analysis & Interpretation, Findings and Suggestions of the study follow. One of the main areas of the project is the analysis part, where the data are analyzed & interpreted, to find out how the inventories were managed. Some of the tools used in inventory are regarding to:  Economic Order Quantity  Safety Stock  FSN Analysis  Trend Analysis and  Inventory Turnover Ratio.
  • 6. TABLE OF CONTENTS CHAPTER NO TITLE PAGE NO 1 INTRODUCTION 1.1 Objective of the Study 1.2 Need for the Study 1.3 Scope of the Study 1.4 Limitation of the Study 1.5 Research Methodology 2 4 4 6 6 7 2 COMPANY PROFILE 11 3 REVIEW OF LITERATURE 37 4 DATA ANALYSIS AND INTERPRETATION 43 5 FINDINGS, SUGGESTION,CONCLUSIONS 74 BIBLIOGRAPHY 82 QUESTIONNAIRE 84
  • 7. LIST OF TABLES TABLE NO TOPICS PAGE NO 4.1 GENDER 44 4.2 AGE 45 4.3 DESIGNATION 46 4.4 EDUCATIONAL QUALIFICATION 47 4.5 EXPERIENCE 48 4.6 MARITAL STATUS 49 4.7 INCOME 50 4.8 RECRUITMENTS 51 4.9 JOB SECURITY 52 4.10 DIRECT BENEFITS 53 4.11 INDIRECT BENEFITS 54 4.12 PEFORMANCE APPRAISAL 55 4.13 TRAINING PROGRAM 56
  • 8. 4.14 LEARNING AND DEVELOPMENT 57 4.15 COMMUNICATION 58 4.16 RESPONSIBILTY 59 4.17 TALENT RETENTION WORK SHOP 61 4.18 FEEDBACK MECHANISM 62 4.19 JOB SATISFICATION 63 4.20 EMPLOYEE’S PERFORMANCE AFTER IMPLEMENTING RETENTION MANAGEMENT CONCEPT 65
  • 9. LIST OF FIGURES CHART TOPICS PAGE NO 4.1 GENDER 44 4.2 AGE 45 4.3 DESIGNATION 46 4.4 EDUCATIONAL QUALIFICATION 47 4.5 EXPERIENCE 48 4.6 MARITAL STATUS 49 4.7 INCOME 50 4.8 RECRUITMENTS 51 4.9 JOB SECURITY 52 4.10 DIRECT BENEFITS 53 4.11 INDIRECT BENEFITS 54 4.12 WORKING ENVIORNMENT 55
  • 10. 4.13 TRAINING PROGRAM 56 4.14 LEARNING AND DEVELOPMENT 57 4.15 COMMUNICATION 58 4.16 RESPONSIBILTY 59 4.17 TALENT RETENTION WORK SHOP 61 4.18 FEEDBACK MECHANISM 62 4.19 JOB SATISFICATION 63 4.20 EMPLOYEE’S PERFORMANCE AFTER IMPLEMENTING RETENTION MANAGEMENT CONCEPT 65
  • 12. Introduction Human Resource Development is concerned with people, dimensions of the organization. The organization objectives can be best achieved by acquiring human resources, develop them, cast them for our need &motivate them for still better performance and ensure that they continue to Maintain their involvement, commitment, loyalty to the organizational. The Human Resource Development basically consists of three “C”s i.e. competencies, commitment and culture Companies that engage in Retention Management (Human Capital Management) are strategic and deliberate in how they source, attract, select, train, develop, retain, promote, and move employees through the organization. Research done on the value of such systems implemented within companies consistently uncovers benefits in these critical economic areas: revenue, customer satisfaction, quality, productivity, cost, cycle time, and market capitalization. . The term Retention Management means different things to different organizations. To some it is about the management of high- worth individuals or "the talented" whilst to others it is about how talent is managed generally - i.e. on the assumption that all people have talent which should be identified and liberated. From a Retention Management standpoint, employee evaluations concern two major areas of measurement: performance and potential. Current employee performance within a specific job has always been a standard evaluation measurement tool of the profitability of an employee. However, Retention Management also seeks to focus on an employee’s potential, meaning an employee’s future performance.
  • 13. Retaining the best Talent Retention refers to the ability of an organization to retain its employees. Employee retention can be represented by a simple statistic for example; a retention rate of 80% usually indicates that an organization kept 80% of its employees in a given period. However, many consider employee retention as relating to the efforts by which employers attempt to retain employees in their workforce. In this sense, retention becomes the "Strategies" rather than the outcome. A distinction should be drawn between low performing employees and top performers, and efforts to retain employees should be targeted at valuable, contributing employees. Employee turnover is a symptom of a deeper issue that has not been resolved. These deeper issues may include low employee morale, absence of a clear career path, and lack of recognition, poor employee-manager relationships or many other issues. A lack of satisfaction and commitment to the organization can also cause an employee to withdraw and begin looking for other opportunities. Pay does not always play as large a role in inducing turnover as is typically believed. In a business setting, the goal of employers is usually to decrease employee turnover, thereby decreasing training costs, recruitment costs and loss of talent and organisational knowledge. By implementing lessons learned from key organizational behavior concepts employers can improve retention rates and decrease the associated costs of high turnover. However, this isn't always the case. Employers can seek "positive turnover" whereby they aim to maintain only those employees who they consider to be high performers.
  • 14. 1.1 Objectives:- In the current scenario of cutthroat competition, every company has to survive to satisfy its customers by providing them quality products and services. The Following objectives emerged: Primary Objective:  To suggest and come out with various ways & means of retaining the top talents in the organization. Secondary Objective:  To map the entire process of Retention procedure and policies involved in the said organization.  To study the accuracy and quality of work of employees by Retention Management procedure.  To suggest possible improvement in Retention Management process. 1.2 Need for the Study The purpose of this study is to analyzed the retaining the best talents in Companies. The study aims is to improve Operational Efficiency and Productivity of the Manufacturing Company and its aims is to enabling Business Agility. It aims is to simplify and transform the company to adopt talent management practices to retain the best employees in the company. After putting the more efforts, time and Cost to hire the best employee for the Right person for Right job. Many books have been written and exit interviews conducted as employers look for the secret to keeping their good employees satisfied. Salary, retirement plans and vacation benefits are high on the list of why those great employees took the job, but they are not reasons enough to keep them in your employ for the
  • 15. long haul. Job satisfaction will increase your employee retention rate. List of points to retain talent: 1. Create the work atmosphere that makes your employees feel that they are the asset of the company: Don’t make them feel like overhead. Allow them to feel secure in their job. Greet them by name, letting them know that you know who they are and what their contributions are to the company. Get their input about rules or changes that may need to be made. Encourage goal- setting and let them make their own choices as often as possible. 2. Make expectations and goals of the company clear: Be sure you have job descriptions so your employees know what is required of them. If there are changes that need to be made, don’t expect them to learn that by osmosis. You must communicate directly and clearly. Good employees want to please you, but they need to know what it is they need to do to make that happen. 3. Create an open and honest work environment: Give feedback on work performed and be willing to listen, really listen, to the concerns of your employees. Chance meetings in the hall where social greetings are exchanged are good, but do not take the place of actually sitting down face-to-face and discussing any work-related concerns. Be open and listen to new ideas. Accept suggestions for problem-solving. Be available and open when your employee asks for your guidance. Keep your top talent informed about what is happening with the company - don’t let rumors take over. If there are problems or set-backs, communicate this. 4. Provide opportunities to grow and learn in organization: Provide tuition for continuing education classes. Give challenging and stimulating work. Tap into their passion and allow them to focus their time and energy on projects they can enjoy.
  • 16. Let them know what career development plans you may have for them and what opportunities are available for them to grow with the company. 1.3 Scope of Study This study was done through primary research. The primary data was collected from the workers of the Murugappa Group of Companies. Primary data was collected through a sampling method from male and female employees in the company through circulation of questionnaires. Data collected was analyzed for achieving the objectives of the study. 1.4 Limitation of Study The limitation includes:  The study was conducted for a period of 4-5 months  The study was limited to only Operations, Supply chain and logistics, Human Resource, departments of the Organization  The other main business units such as Information Technology/Administration were not considered because it was more of a centralized function operating on a larger scale for the entire group. Rationale of the study Today the war for talent is as big as for the Market share. Because of Liberalization and Globalization the standard of the workforce and expectations of the employees from the organization has moved away from aspiring for a job to seeking a career. In this scenario, companies look for greater talents so as the candidates look for branded companies to pursue their career. Now it becomes unavoidable for companies to attract the top talents and to retain them to have a successful market share.
  • 17. 1.5 Research Methodology Research Methodology is a way to systematically solve the research problems. It may be understand as a science of studying how research is done scientifically. In it we are studying his research problems along with the logic behind them. It is necessary the researcher to know not only the research method techniques but also the methodology. Types of Research It is descriptive type of research. Descriptive Research survey and fact finding inquiries of different kind. The major purpose of descriptive research is descriptive the state of affairs, as it exist at present. The main control over the variable; he can only report what has to discover the even when there he cannot the variable. The methods has to researcher utilized in descriptive research are survey methods of all kind. Data Source:- The source of project depends on accurate data. That’s why data collecting the appropriate data, which differ considerable in context money, cost, time and other resources at the disposal researcher. There are two types of data collection methods available 1. Primary Data Collection Method. 2. Secondary Data Collection Method.
  • 18. Primary Data Collection Method. Primary data are those that are obtain by the user for fulfillment their purpose. It has Primary Data through personal visit of HR head, and HR executive. At all levels and observation methods to get more reliable information. It also collected primary data to be filled, ‘Yes’ or ‘No’ format questionnaire frame by the employee of Company, This data helped us to justify the statements. Secondary Data Collection Method. The Secondary Data is that which is already collected and stored or we can say already saved or ready data by others. I got secondary data from their journals, records, specimen of appraisal form etc. And from newspapers magazines, articles, internet etc I got basic information of Talent Management. I collect secondary data by referring some specimen of company and by referring some books and web sites of company from internet. 1.6 Hypothesis Hypotheses are the essential assumptions which the researcher formulates about the possible causes, findings and ultimate output of the issue in under research. Under hypotheses mere assumptions or suppositions are made which are to be proved or disproved. For researcher it is a formal question that he intends to resolve. A hypotheses consist either of a suggested explanation for a phenomenon or of a reasoned proposal suggesting a possible correlation between multiple phenomenon. The assumptions be true or false are to be proved through the completion of project.
  • 19. The hypotheses for this project are as follows: Null Hypothesis 1. Employee taking benefits from Retention Management System 2. Employee can retain successfully for the benefit of organization 3. Employee’s performance increased by Retention Management 4. Employee turnover of organization affected by Retention Management Procedure Alternate Hypothesis 1. Employees are not able to take benefits from Retention Management System 2. Employee cannot retain successfully for the benefit of organization 3. Employee’s performance cannot increase by Retention Management. 4. Retention Management is not affecting on employee turnover of organization
  • 21. 2.1HistoryofMurugappa Group of Companies Founded in 1900, Murugappa Group is one of India's leading business conglomerates. The Group has 28 businesses including eight listed Companies actively traded in NSE & BSE. Headquartered in Chennai, the major Companies of the Group include Carborundum Universal Ltd., Cholamandalam Investment and Finance Company Ltd., Cholamandalam MS General Insurance Company Ltd., Coromandel International Ltd., Coromandel Engineering Company Ltd., E.I.D. Parry (India) Ltd., Parry Agro Industries Ltd., Tube Investments of India Ltd., and Wendt (India) Ltd. Market leaders in served segments including Abrasives, Auto Components, Cycles, Sugar, Farm Inputs, Fertilizers, Plantations, Bio-products and Nutraceuticals, the Group has forged strong alliances with leading international companies like Groupe Chimique Tunisien, Foskor, Cargill, Mitsui Sumitomo, Morgan Crucible and Sociedad Qu mica y Minera de Chile (SQM). The Group has a wide geographical presence spanning 13 states in India and 5 continents. Renowned brands like BSA, Hercules, Ballmaster, Ajax, Parry’s, Chola, Gromor and Paramfos are from the Murugappa stable. The organization fosters an environment of professionalism and has a workforce of over 32,000 employees.
  • 22. 2.2 COMPANY IN INDIA The Making of the Murugappa Group of Company Headquartered in Chennai, the INR 225 Billion Murugappa Group is one of India's leading business conglomerates. The Group has 28 businesses including eleven listed Companies traded in NSE & BSE. Headquartered in Chennai. Major Companies 1.Carborundum Universal Ltd., 2. Cholamandalam Investment and Finance Company Ltd., 3. Cholamandalam MS General Insurance Company Ltd., 4. Coromandel International Ltd., 5. Coromandel Engineering Company Ltd., 6. E.I.D. Parry (India) Ltd., 7. Parry Agro Industries Ltd., 8. Sabero Organics Ltd., 9.Shanthi Gears Ltd., 10.Tube Investments of India Ltd. Market leaders in served segments including Abrasives, Auto Components, Cycles, Sugar, Farm Inputs, Fertilizers, Plantations, Bio-products and Nutraceuticals, the Group has forged strong alliances with leading international companies like Groupe Chimique Tunisien, Foskor, Mitsui Sumitomo, Morgan Crucible and Sociedad Química y Minera de Chile (SQM). The Group has a wide geographical presence spanning 13 states in India and 5 continents. Renowned brands like BSA, Hercules, Ballmaster, Ajax, Parry’s, Gromor and Paramfos are from the Murugappa stable. The organization fosters an environment of professionalism and has a workforce of over 32,000 employees.
  • 23. Coromandel International Limited Coromandel International Limited, India’s second largest Phosphatic fertiliser player, is in the business segments of Fertilisers, Specialty Nutrients, Crop Protection and Retail. The Company manufactures a wide range of fertilisers and markets around 2.9 million tons making it a leader in its addressable markets. In its endeavor to be a complete plant nutrition solutions Company, Coromandel has also introduced a range of Specialty Nutrient products including Organic Fertilisers. The Crop Protection business produces insecticides, fungicides and herbicides and markets these products in India and across the globe. Coromandel is the second largest manufacturer of Malathion and only the second manufacturer of Phenthoate. Coromandel has also ventured into the retail business setting up more than 640 rural retail centers in the States of Andhra Pradesh and Karnataka. The Company has strategic partnerships with leading companies across the globe. The Company clocked a turnover of 8,560 Crore during FY 2012-13. lt was ranked among the top 20 best companies to work for by Business Today and was also voted as one of the ten greenest companies in India by TERI, reflecting its commitment to the environment and society. Coromandel is a part of the INR 225 Billion Murugappa Group.
  • 24. E.I.D. Parry (India) Limited E.I.D. Parry has been synonymous with dynamism since 1788. It became a part of the Murugappa Group in 1981 and its businesses now cover a wide range of products including sugar, microalgal health supplements from Parry Nutraceuticals and bio products from Bio Products Division. E.I.D. Parry set up India's first sugar plant at Nellikuppam in 1842. The pioneering spirit has seen E.I.D. Parry setting up the first fully automated sugar plant at Pudukottai in 2000, a distillery, and more recently, zero waste integrated sugar complexes. Silkroad Sugar Private Limited is a joint venture with Cargill International where E.I.D. Parry holds 50% stake. A sugar refinery with a capacity of 600,000 MT located in a Food Processing Special Economic Zone of Parry Infrastructure Company Private Limited at Kakinada is being set up. The company is one of the few to introduce branded sugar in the retail market in India under the Parry’s Pure and Parry’s White Label. The company produces a variety of sugars at its four fully automated plants in Tamil Nadu and a fifth one in Pondicherry. These cater to the food, bakery, confectioneries and beverage manufacturing industries, and are also used in pharma applications. E.I.D. Parry pioneered integrated sugar complexes that maximise the utility of sugarcane through the production of sugar and using its other components in more purposeful ways. The company also converts bagasse into electricity in its cogeneration units and processes molasses into various types of alcohol, thus completing the value chain. In addition, EID Parry has a stand- alone distillery in Sivaganga in Tamil Nadu.
  • 25. The cogeneration plants at these three locations are among the first in the country to use air cooled instead of water cooled condensers to conserve water. The Pettavaithalai plant uses submerged ultra filtration with two reverse osmosis systems to save water and minimise usage of chemicals - the first of its kind in India for boiler feed water. The Pudukottai plant is amongst the first in South India to earn carbon credits and to be registered in UNFCCC under the Kyoto protocol for climate change. However, the biggest innovation spearheaded by E.I.D. Parry has nothing to do with manufacturing or marketing of sugar but with the difference it has made to the 1, 00,000 sugarcane farmers associated with it. Parry has introduced complete IT enabled services for farmers such as Remote Sensing, Geographic Information System and Global Positioning System for mapping and monitoring sugarcane growing area. Village-wise soil nutrient analysis, detailed farm boundary mapping, integration with Cane Management System and soil maps ensure efficient cane management. E.I.D. Parry has introduced Namadhu Parry Maiyam, a concept where a local entrepreneur (usually a sugarcane farmer) is trained to become a Namadhu Parry Maiyam operator. The company extends interest free loans to these operators for buying high end farm equipment, which can then be hired out to small farmers who are unable to afford such sophisticated equipment. This helps mechanise farm services, accelerate sugarcane harvesting and save costs as manual labour is becoming increasingly expensive. E.I.D. Parry pioneered sugarcane research and probably runs the only private R&D centre for sugarcane and tissue culture to develop new and improved cane varieties. It has also been aggressively promoting eco-friendly pest management systems. Today, E.I.D. Parry is one of the Top 5 sugar producers in India and is on the path to sweetening more lives around the world.
  • 26. Parry Agro Industries Limited Parry Agro has tea plantation factories both in South and North-East India and between the two regions; the Company produces around 17 million kilograms of tea. A pioneer in organic plantations, Parry Agro’s Iyerpadi Estate has been certified organic by IMO, JAS (Organic Laws of Japan), NOP (Organic Laws of USA) and NPOP (Organic Laws of India). The Iyerpadi factory is also ISO 22000 and is FLO (Fairtrade Labelling Organisation) Certified. Three of Parry Agro’s tea factories namely Mayura, Attikunna and Carolyn are certified for ISO 9001:2000. Mayura, one of the first CTC Tea factories thus certified, is also one of the first to have micro-processor based control and monitoring systems, reflecting the forward looking approach of the Management. Not content with just the cultivation of tea, Parry Agro has been conducting extensive research on better cropping as well as processing aspects of tea at its NABL certified R&D facility for nearly a decade. It has also pioneered research on reversal of soil degradation using earthworms. Parry Agro, in collaboration with Sambalpur University, Orissa and Institut de Recheche pour le Development (IRD), has developed Earthworm FBO Technology called Fertilisation Bio Organique (FBO) Technology to improve the soil fertility of plantation crops. This technology is patented by IRD in France, China and Sri Lanka.
  • 27. Carborundum Universal Limited Carborundum Universal Limited (CUMI) was founded in 1954 as a tripartite collaboration between the Murugappa Group, Carborundum Inc, USA, and the Universal Grinding Wheel Co Ltd, UK. CUMI pioneered the manufacture of coated and bonded abrasives in India, besides super refractories, electro minerals, industrial ceramics and ceramic fibres. In sync with the global vision, CUMI is expanding its product spread. The Company makes over 20,000 varieties of products manufactured at 25 locations across India, Russia, South Africa, Australia, China, Thailand and Canada. CUMI exports its products to 43 countries spread across the globe. All the manufacturing facilities of CUMI are ISO 9001:2008 and ISO 14001: 2004 certified for quality standards and environment-friendly manufacturing practices. State-of-the-art facilities and strategic alliances with global partners have earned CUMI a reputation for quality and innovation. It is one of the few manufacturers of abrasives and ceramics in the world with fully integrated operations that include mining, fusioning, power generation and manufacturing, besides marketing and distribution. CUMI is equipped with a state-of-the-art Research and Development centre that works aggressively on product development and efficiency enhancement. Its in-house R&D and collaborative research with leading research institutions have ensured market leadership in India and abroad. CUMI has manufacturing practices like Lean and Six Sigma in place to improve its cost competitiveness.
  • 28. The Company has a commanding list of subsidiaries across the globe that include Volzhsky Abrasive Works-Russia, CUMI Australia Pty Ltd, Foskor Zirconia Pty Ltd-South Africa, CUMI Middle East-RAK, CUMI Canada Inc, CUMI America Inc, Sterling Abrasives Limited- Ahmedabad, Net Access India Limited, Southern Energy Development Corporation Limited (SEDCO), CUMI Abrasives and Ceramics China Limited (CACCL), Cellaris Refractories India Limited and CUMI International Limited, Cyprus. CUMI's joint ventures include Wendt (India) Limited – manufacturing super abrasives, Murugappa Morgan Thermal Ceramics - manufacturers of ceramic fibre and Ciria India Limited - specialising in design and installation of refractory liners for petrochemical and fertiliser industries. This unique strength allows the Company to serve diverse markets and geographies leveraging the local strength of its partners. 2.3 Tube Investments of India Limited - Murugappa Group TII Heritage the Group traces its origins to 1898, when Dewan Bahadur an M Murugappa Chettiar went as an apprentice to Burma (now Myanmar). Quick to learn financial skills and Burmese, he realized he was destined to greater achievements; he founded a firm in Moulmein, a large port-city in Lower Burma. This grew into a prosperous family-owned business, with interests in Banking, Rubber and Trade, covering Malaya (Malaysia), Ceylon (Sri Lanka), Indonesia and Vietnam. The outbreak of the World War II and subsequent political upheavals in the region cut short the firm’s growth. While a good portion of its hard earned fortunes were lost, the family had the foresight to move significant assets to India; this financial prudence ensured that the business would rebound after the disaster and rebound it. Back home in India, the Group had engaged in businesses like Rubber, Steel cabinets, Yarn and other traded goods. But the real major industrial opportunity came soon after Independence. Political Independence spawned Economic Independence: and AMM Murugappa Chettiar, Dewan Bahadur’s eldest son (and by then, head of the family) was quick to realize it. His vision
  • 29. was to start a business that would manufacture a product for the common man which they could sell in large numbers. Thus, in 1949, TI Cycles of India (TICI) was born in collaboration with TI of UK. It was the Group’s first of many successful Joint Ventures and also its first foray into large scale manufacturing. Later, as a measure of backward integration two more companies were formed: Tube Products of India (TPI) in 1955, to make steel tubes for bicycle frames and TI Diamond Chain (TIDC) in 1960 to make bicycle chains. Over a period of time these two businesses have moved up the value chain from bicycle parts to higher technology products. In 1959, Tube Investments of India (TII) was formed by merging TI Cycles of India and Tube Products of India. TI Diamond Chain was merged with the parent company, in 2004. In 1962, the company saw a potential to leverage its engineering skills to address the market for roll formed metal products. So a new unit called TI Metal Forming was created to realize this potential; to this day it is recognized as the pioneer in this business. During the 1990s TII made many bold acquisitions to enhance its presence in its core businesses. The most notable, was the case of Satavahana chains, a sick BIFR company that was turned round to a highly profitable unit. Other success stories were the acquisition of a Japanese Tube plant and a German Chains plant which were re-erected in Chennai to address the growing export markets. A successful GDR issue in 1994 increased its financial muscle and accelerated both acquisitions and expansions. Capacities were increased in all its units to meet the growing customer demands. In the six decades of its existence, TII has built significant skills in engineering and metallurgy, which is fully supported by a central R&D function. A Total Quality Management approach has ensured a satisfied community of customers and TII is the preferred supplier in all the markets it operates. TII continues the tradition of financial discipline and prudence set by the founding fathers. It is this tradition that has earned TII the unique distinction of uninterrupted dividend distribution since 1954.
  • 30. 2.4 Tube Investments of India Limited - Murugappa Group Management Tress BOARD OF DIRECTORS General Manager (Corporate Affairs) Service Department Work Manager Deputy woks Manager (Floor Incharge) Body & Paint Dept Spares Department HR, Accounts & True Value Dept. Service Coordinator Supporting Section Manager Manager Manager Supervisor Customer care, Front Office, Lobby Hostess, Service Mktg) Supervisors Sr. Executive Sr. Executives Asst. Service Advisors Senoir Executives Asst. Supervisor Officiers Executive Officiers Service Advisors Executives Technicians Asst.Officiers Asst.Officiers Technicians Technicians Asst Officiers Technicians Officers Technicians
  • 31. TII Ltd - Board of Director Management Mr. L. Ramkumar (Managing Director) Mr. Kalyan Kumar Paul (President) Mr. P. Ramachandran (President TI Diamond Chain India) Mr. Arun Alagappan (President TI Cycle) Mr. K. R. Srinivasan (Sr. Vice President-TI Metal Forming) Mr. Arjun Ananth (Sr. Vice President and CFO) Mr. R. Natarajan (Sr. Vice President- Corporate Technology Centre) Mr. N. Prasad (Sr. Vice President – HR) 2.5 TII Ltd. Quality Focus
  • 32. TII journey towards excellence began with introduction of basic TQM which focuses on Customer, Continuous improvement, Employee involvement, Employee empowerment, and building a learning organization. The outcomes of the above initiatives were development of documented management systems for Quality, SHE (Safety Health and Environment), TEI (Total Employee Involvement), and related metrics of measures including that for customer satisfaction and Employee satisfaction / Engagement. Development of vision, mission, strategic plans, Process focus and integration of all the earlier / above initiatives in a robust manner was supported by the introduction of the EFQM Model for Business Excellence. Similarly concept of OEE, autonomous maintenance and related matrices of measures for success are from the TPM introduction. Though they were benefited from many of these initiatives and moved closer to the bench mark levels, the drive needs to continue. As an engineering company, they believe that the need now is to focus and excel in Manufacturing / Operations without losing any of the gains we had from the previous initiatives. Strengthening the organisational structure and aligning them appropriately including formation of a new function for Manufacturing Engineering Technology (MET) are the new initiatives in this direction. To create more focus for this drive, we have developed a Model for Operational Excellence, and launched the same during Sept 2012. In this House of Excellence, the two pillars represent our commitment to delight customers by meeting and exceeding their expectations in terms of Quality, Delivery and other services, and our intent to partner suppliers / Vendors in this process. The base steps show our approach to create shop floor excellence leading to LEAN Manufacturing.
  • 33. 2.6 Company Profile Tube Investments of India Limited is an India-based company engaged in the production of bicycles/components/electric scooters, engineering and metal formed products. It operates in three segments: Cycles/Components /E Scooters, Engineering and Metal Formed Products. The Bicycles/Components/Electric scooters division of the Company consists of bicycles of the standard and special variety, including alloy bikes and specialty performance bikes, bicycle components sold as spares, fitness equipment and electric scooters. The Engineering division of it consists of cold rolled steel strips and precision steel tubes, cold drawn welded tubes (CDW), electric resistance welded tubes (ERW) and Stainless Steel tubes. It has presence in automotive and industrial chains, fine blanked products, roll- formed car doorframes and cold rolled formed sections for railway wagons & passenger coaches. TI Cycles of India A pioneer in the Cycles market, TI Cycles, formed in 1949, has constantly come up with new trends in line with evolving consumer needs. TI Cycles’ vision is “To be the most preferred brand in fitness, recreation & personal mobility solutions”. It strives to give its customers not only a bicycle but a lifetime experience.
  • 34. TI Cycles have introduced fun and entertaining stores across the length and breadth of India. The company has been proactive and was first Bicycle Company to change the cycle retail landscape, both in urban and rural areas. With the first urban store in 2007, Hercules is sold in over 200 exclusive urban stores known as 'BSA Hercules Exclusive Stores' which have revolutionized the way people buy bicycles in India. These stores are a one-stop premium shop for all Hercules, BSA & Montra products and have a customer friendly ambience which serves as a model for other bicycle outlets in the country. In 2010, the company started “Hercules BSA Cycles” to provide the urban retail buying experience in smaller towns. In just over a year’s time, there are over 200 of these rural stores. For its retail innovation, the company recently received the certificate of appreciation for 'Excellence in Rural Retailing' at the ET Retail Awards 2011. TI Cycles has plants at Chennai, Nasik and Noida, major Warehouses at Guwahati, Durgapur, Patna and Cuttack and regional offices, through which it serves it nationwide 2500 plus dealer network. Certified with ISO 9001:2000, OSHAS 18001-2007 and ISO 14001-2004, TI Cycles is a quality and customer centric organization. BSA stands for style, fun and comfort. There are several models catering to consumer segments ranging from kids, ladies and other premium end customers. BSA Ladybird, BSA SLR, BSA Champ, BSA Mach are trendsetters and icons in their respective categories. It signifies the joy of cycling. Excitement and comfort go hand in hand with BSA. Today, BSA is an intrinsic part of the Indian family. Source: www.bsahercules.com
  • 35. our first brand is still as young as ever, signifying strength and passion. It is rugged, robust and is for the rough and tough. Hercules stands for a unique pride of possession. The range of Hercules Roadeo and Hercules MTB Turbodrive has been pioneers in the bicycles category catering to the youth. The range of Hercules Ryders is for urban adults for them to ride towards a healthier, happier self. The Hercules Popular brand of "standard" bicycle is a market leader in the segment. Source: www.facebook.com/HerculesRoadeo Track and Trail is the ultimate destination for everything in cycles - from the best of international bicycles and world-class accessories to a network of people with expertise on technology, performance and the intricacies of cycling. For mountain, road and hybrid bikes, you can choose from Cannondale, Bianchi or Schwinn – world-class brands known for incomparable designs, superior comfort and ease of riding. We also have an exciting range of BMX and MTB cycles from GT and Mongoose for those who like a bit of adventure in their lives. Source: www.trackandtrail.in
  • 36. Faster, lighter and stronger than any cycle ever created in India, Montra brings international standard carbon frame bike for the first time in India. It is designed and manufactured ingeniously and is a part of the flagship range of TI cycles under Track and Trail. Montra, meaning “My Track” is the bike that lets you ride our aspirations, that lets you choose your own path. Source: www.montra.in 2.7 BSA MOTORS (Birmingham Small Arms) BSA Motors is the youngest division of TII which made their venture into the Electric scooters segment in 2008. It provides the Indian customers convenient personal mobility options which are cost effective and environmentally responsible. BSA Motors has the widest product range in the electric scooter industry specially designed and developed to suit customer needs of the target segments like school / college girls & boys and working women. The models ranges from 250 Watts and lower end models do not require license or registration. The BSA Motors plant at Ambattur has the best R&D testing facilities for electric two wheelers in India. With its focus on customer understanding, Technology, product development, quality systems and after sales service capabilities, BSA Motors intends to provide superior experience to its customers.Tube Products of India Ltd was established in 1955, in collaboration with Tube Products (Old Bury) Limited-UK, as a measure of backward integration with the bicycles plant. In 1959, Tube Investments of India (TII) was formed by merging TI Cycles of India and Tube Products of India.
  • 37. Today, TPI is the preferred supplier of precision tubes, Electric Resistance Welded (ERW) and Cold Drawn Welded (CDW), to major automotive companies in India and abroad. TPI is India's undisputed market leader in CDW tubes to the automotive industry. It has also significant market presence in power plants, boiler, textile machinery, general engineering. It is the Market leader in Telescopic Front Fork Inner tubes and Cylinder bore tubes for shock absorber and gas spring applications, Propeller shaft tubes for Automotive segment. Other Specialty products include Rear Axle Tubes, Side Impact Beams, and Tie Rods, Drag links, Heavy thick steering shafts and Hydraulic Cylinder tubes. The International Business Division (IBD) was formed to focus on international markets, gearing TPI to compete with global tube manufacturers. The most recent addition to TPI is the Tubular Components Division (TCD), which manufactures high strength tubular auto components, providing the advantage of weight reduction, higher component efficiency and cost reduction. TPI produces a wide range of CRCA strips including special extra deep drawing, high tensile, medium carbon, high carbon finding application in industries such as Bearings, Automobile, Auto Ancillaries, white goods, fine blanking and General Engineering. TPI has been supplying to customers such as Bajaj Auto Ancillaries, TVS Motors Ancillaries, Hero Honda Ancillaries, Tata Motors, Toyota India, Delphi, Gabriel, Escorts, and Endurance. Its success stems from market driven, customer oriented approach coupled with superior process design, short product development cycle, delivering high quality products and efficient customer service ensuring total customer satisfaction.TPI has integrated manufacturing facilities at Chennai (Two tubes plants and one strips plant at Avadi and one at Ambattur), Shirwal & Mohali.These plants conform to international standards and achieve operational excellence through TPM. TPI has distribution centers across India, which ensures timely service to the customer’s daily requirements.
  • 38. TPI has received ISO-TS 16949 for all plants, ISO 9001: 2000 for all plants, ISO 14001:2004 for Avadi & IBD Plants, Self-certification for boiler tubes by the central boiler board. TPI is the Winner of the Sword of honor for outstanding safety performance from the British Safety council. Tubular Components Division (TCD), a plant of TPI, has won Supplier Performance Award 2007-2008. Timely delivery, top notch quality and excellent service have been key for the division for winning this award. Tube Investment Diamond: TIDC applies a collaborative approach with customers in developing new products that provide value to customers. For this, TIDC relies on extensive in-house R&D and advanced design software. In the domestic market the 'Diamond' brand chains cater to a range of two wheelers and industrial OEMs. TIDC also services the after-market with kits and chains through a well- established distribution network and warehouses in India and abroad. TIDC has plants at Chennai, Hyderabad and Uttaranchal. I Cycles was established by the Murugappa Group in the year 1949, in collaboration with Tube Investments of India ltd, UK. The first Hercules bicycle rolled out in 1951.Today, TI Cycles is the leader in the ‘specials’ segment. The energy of the company can be felt nationwide, thanks to a network of around 1,500 primary dealers and 10,000 secondary dealers. TI Cycles has the capacity to manufacture 4 million cycles a year at 3 plants across India - Chennai in the South, Nasik in the West and Noida in the North. This is supported by 4 zonal offices and 4 warehouses across the country. I Cycles offer consumers a range of bicycles, e- scooters, fitness equipment and infant mobility solutions
  • 39. Cholamandalam MS General Insurance Company Ltd Cholamandalam MS General Insurance Company Ltd. is a Joint Venture between the USD 3.03 billion Murugappa Group, one of India’s leading business conglomerates and Mitsui Sumitomo Insurance Company Limited, which is part of the Mitsui Sumitomo Insurance Group of Japan, the largest General Insurance Company in Japan and 5th largest insurance group globally. Chola MS offers a wide range of products that include Accident, Engineering, Health, Liability and Marine, Motor, Property, Travel and Rural insurance for individuals, SME’s and the corporate sector. The company has achieved Rs. 785 crores Gross Written Premium (GWP) mark for 2009-10. Having posted a remarkable growth of 15% year-on-year, the company has been one of the fastest growing General Insurance companies for the previous many quarters. The company has a network of 108 branches across the country. The company offer well-integrated operational capabilities to ensure the smooth performance of delivery like strong underwriting, tie-ups with global reinsurers, fast-track claims settlement and cash-free settlement for Health Insurance. With exposure to various industry sectors and services, Chola MS is fully equipped to provide world class customer service such as centralized policy issuance, renewal management through CRM Cell. A toll free helpline number accessible 24 X 7 and a completely interactive and user- friendly website which makes Chola accessible from anywhere in the world.
  • 40. Cholamandalam Investment & Finance Company Ltd Cholamandalam Investment & Finance Company Limited (CIFCL) was incorporated in 1978 as the financial services arm of the Murugappa Group. The Company that commenced business as an equipment financing company has now emerged as a comprehensive financial services solution provider that offers vehicle finance, business finance, home equity loans, stock broking and distribution of financial products to its customers. The Company operates from over 200 branches across India with an asset under management over Rs.9000 Crores. The subsidiaries of Cholamandalam include Cholamandalam Securities Limited (CSec) and Cholamandalam Distribution Limited (CDSL). CIFCL is a subsidiary of TII which holds 60.48% of CIFCL’s Share Capital. Sedis Sedis is a leading manufacturer of Industrial and Engineering Class Chains in France and possesses a product range covering the requirements of a whole range of industries including the high growth infrastructure sector. The brand “Sedis” has strong brand equity and the client list includes names such as:- Lafarge, Charles De Gaulle airport, BAA Heathrow, Metro net, Cairo Metro, Kone, Otis, Schindler etc. Sedis has a presence in almost 100 countries through its vast distribution and sales network. It has two plants in France and a marketing company in the United Kingdom. This Group is a subsidiary of TI, which holds 77.13%. Sedis possesses superior technology for manufacture of special and engineering class chains.
  • 41. 2.8 Company Products Fertilisers Pesticides Plantations Sugar and Bio-Products Nutraceuticals
  • 42. Tube - Automobile Bearings Stampings Auto & Auto Ancillaries Transmission Chain Fine Blanking Clutch
  • 43. Tube - Boiler 1. Self Certification for Boiler tubes 2. Well Known Tube Maker Certification 3. Direct for "U" Bend usage
  • 44. Bicycles Tube - General Metal forms 1. Bright Finished tubes for plating application 2. Full Flattening of tubes 3. High Strength tubes
  • 46. Chapter 3: Review of Literature
  • 47. 3.1 Review of Literature: Retention management V/S Traditional HR approach Traditional HR: Systems approach people development from the perspective of developing competencies in the organization. This can actually be a risk-prone approach, especially for companies operating in fast evolving industries, since competencies become redundant with time and new competencies need to be developed. Thus, over time, the entire approach to development of people might be rendered obsolete calling for rethinking the entire development initiative. Retention Management: on the other hand focuses on enhancing the potential of people by developing capacities. Capacities are the basic DNA of an organization and also of individual potential. D Point of Departure N Navigation A Point of Arrival
  • 48. 3.2 Role of Retention Management: 1. Translating organizational vision into goals and mapping the required level of capacities and competencies to achieve goals aligning individual values and vision with organizational values and vision. 2. Clear understanding of the varied roles within the organization and appreciation of the value-addition from self and others leading to building a culture of trust, sharing and team orientation. 3. Assessment of talent to profile the level of capacities and set of competencies possessed within the organization. Enhancing capacities to learn, think relate and act through development initiatives. Individual growth to meet and accept varied incremental and transformational roles in an overall scenario of acknowledged need for change. 4. Gap analysis and identification of development path helping individuals realize their full potential through learning & development. 3.3 Understanding Talent The idea of developing talent is not a new concept in any business. In fact every successful company that has 'stood the test of time' has done so, because of their ability to attract, retain and get the best out of their talent. This has emerged, not because companies have forgotten about talent, or allowed it drop off of the radar but, because in some fundamental ways, the talent has changed. We have a new kind of young person entering the business world, with a very different world view, set of values, priorities and goals.
  • 49. Focus 1: Attracting and recruiting Talent: In order to effectively attract and recruit talented employees. 1. We need to understand what talent is looking for in a career 2. How they will view your business in terms of fitting in with their needs By examining this through the perspectives of the different generations, we are able to look at their attitudes to work:  what kind of career, organization and benefits they are looking for  What kind of techniques will ensure that your recruitment process is successful in each generational context? This focus unit looks at the following:  Attitudes to work  Career goals  Views on organizations and how they are currently run  What benefits each generation is looking for  Techniques to attract the different generations: what will make your organization stand out?  Techniques to recruit the different generations: how should the job offer be presented?
  • 50. Focus 2: Retaining and developing Talent In order to retain and develop talent we need to understand what the generations are looking in a future career and in an organization. Our approach to each one of our employees needs to be altered to fit individual goals and personal needs. This focus unit looks at the following:  Work ethics and values  Career planning  Work environments and culture  Benefits and reward systems  Ways of motivating Focus 3: Managing Talent In depths look:  How the generations internalize authority will enable us to adjust our management style to fit in with what they are.  We are able to look at the attitudes of the different generations to the leadership and management;  What kind of management approaches will ensure that you gain maximum loyalty, productivity and job satisfaction from each of your employees?
  • 51. This focus unit looks at the following:  Attitudes to authority  Management styles for the different generations including conflict management  Leadership styles used by the different generations  Specific techniques to help you manage different generations including communication and feedback preferences  Coaching and mentoring preferences including  The role of coach  The coaching process  How to plan for and create conversations
  • 52. Chapter 4: Data Analysis and Interpretation
  • 53. 4.1 Introduction of Data Analysis. The word Analysis means the process of breaking down a Complex set of facts into simple element while Interpretation stands for the explanations which analyzed the statements and also make out or bring out the meaning of creative work. Analysis and Interpretation are done according to department wise and according to questionnaire. This analysis and Interpretation will definitely help to the company for the future strategies. Following are the analysis and Interpretation of the results. These all analysis is imagining for general company. It is very necessary to understand the psychological tendency of employee. Because it is a quietly subjective so it will slightly deviate the opinion of the employee. The researched has done his study in the following departments envisaged below. There are 100 employees in each department. Total employees are 500.  Supply chain and logistics support  Production/Operations  Packing and dispatch  Research and Development  Finance/Accounts
  • 54. Retention Questionnaires: TABLE 1: SHOWING GENDER Particulars Number of Respondents Total Male 78 78 Female 22 32 TOTAL 100 100 CHART SHOWING GENDER Inference From the above table it is inferred that 78% of the respondents are male, 22% of the respondents Female. 0 10 20 30 40 50 60 70 80 Male Female
  • 55. TABLE 2: SHOWING AGE Age Number of Respondents Total 20-30 year’s 23 23 31-40 year’s 56 56 41-50 years 15 15 Above 50 years 6 6 TOTAL 100 100 CHART SHOWING AGE Inference From the above table it is inferred that 23% of the respondents are 20-30 aged persons, 56% of the respondents are 31-40 aged persons, 15% of the respondents are 41-50 aged persons and 6% of the respondents are above 50 aged persons. 0 10 20 30 40 50 60
  • 56. TABLE 3: SHOWING DESIGNATION Particulars Number of Respondents Total Junior executive 48 48 Operator 21 21 Manager 31 31 TOTAL 100 100 CHART SHOWING DESIGNATION Inference From the above table it is inferred that 48% of the respondents are junior executive, 21% of the respondents are Operator, and 31% of the respondents are Manager. 0 10 20 30 40 50 60
  • 57. TABLE 4: SHOWING THE EDUCATIONAL QUALIFICATION OF THE EMPLOYEES Qualification Number of Employees Total UG 60 60 PG 20 20 Diploma 10 10 HSC 10 10 TOTAL 100 100 CHART SHOWING THE EDUCATIONAL QUALIFICATION OF THE EMPLOYEES Inference From the above table it is inferred that 60% of the respondents are UG, 20% of the respondents are PG, 10% of the respondents are diploma, and 10% of the respondents are HSC. 0 10 20 30 40 50 60 70
  • 58. TABLE 5: SHOWING THE EXPRIENCE OF THE EMPLOYEES Particulars Number of Employees Percentage Below 5Yrs 55 55 6-10 yrs 15 15 11-15 yrs 10 10 16-20yrs 15 15 Above 20 Yrs 5 5 TOTAL 100 100 CHART SHOWING THE EXPRIENCE OF THE EMPLOYEES Inference From the above table it is inferred that 55% of the respondents are below 5yrs, 15% of the respondents are 6-10yrs, 10% of the respondents are 11-15yrs, 15% of the respondents are 16-20yrs and 5% of the respondents are above 20yrs. 0 10 20 30 40 50 60 Below 5Yrs 6-10 yrs 11-15 yrs 16-20yrs
  • 59. TABLE 6: SHOWING THE MARITAL STATUS Particulars Number of Respondents Total Married 44 44 Single 56 56 TOTAL 100 100 CHART SHOWING MARITAL STATUS Inference From the above table it is inferred that 44% of the respondents Married and 56% of the respondents are Unmarried. 44 56 100 0 20 40 60 80 100 120 Married Single TOTAL Chart Title Number of Respondents Total
  • 60. TABLE 7: SHOWING THE MONTHLY INCOME Annual income Rs Number of Respondents Total Below 10000 54 54 10000-20000 15 15 20000-30000 16 16 Above 30000 15 15 TOTAL 100 100 CHART SHOWING MONTHLY INCOME Inference: From the above table it is inferred that 54% of the respondents are below 10000, 15% of the respondents are 10000-20000, 16% of the respondents are 20000-30000, and 15% of the respondents are above 30000. 0 10 20 30 40 50 60
  • 61. TABLE 8: SHOWING THE RECRUITMENTS Particulars Number of Respondents Total Campus Recruitment 54 54 Consultancy 15 15 Direct Recruitment 16 16 Reference 15 15 TOTAL 100 100 CHART SHOWING RECRUITMENTS Inference: From the above table it is inferred that 54% of the respondents are Campus Recruitment, 15% of the respondents are Consultancy, 16% of the respondents are Direct Recruitment, and 15% of the respondents are Reference. 0 10 20 30 40 50 60
  • 62. TABLE 9: BELOW SHOWS THE JOB SECURITY OF THE EMPLOYEES REWARDS ACHIEVEMENT NUMBER OF EMPLOYEES PERCENTAGE Yes 94 94 No 6 6 TOTAL 100 100 GRAPH BELOW SHOWS THE JOB SECURITY OF THE EMPLOYEES Inference From the above table it is inferred that 94% of the respondents are Yes, and 39% of the respondents are No. PERCENTAGE OF JOB SECURITY OF THE EMPLOYEES Yes No
  • 63. TABLE 10: SHOWING THE DIRECT BENEFITS Particulars Number of Respondents Total Leave Encashment 28 28 Holiday pay benefits 12 12 Vocation pay benefits 25 25 Worker’s compensation benefits 13 13 Life Insurance benefits 22 22 TOTAL 100 100 CHART SHOWING DIRECT BENEFITS Inference: From the above table it is inferred that 28% of the respondents are Leave Encashment, 12% of the respondents are Holiday pay benefits, 25% of the respondents are Vocation pay benefits, 13% of the respondents are Worker’s compensation benefits and 22% of the respondents are Life Insurance benefits. 0 5 10 15 20 25 30 35 40 45 50 Leave Encashment Holiday pay benefits Vocation pay benefits Worker’s compensation benefits Life Insurance benefits
  • 64. TABLE 11: SHOWING THE INDIRECT BENEFITS Particulars Number of Respondents Total Flexible timings 48 48 Holiday homes 12 12 Hospitalization 24 24 Workplace Flexibility 16 16 TOTAL 100 100 CHART SHOWING INDIRECT BENEFITS Inference From the above table it is inferred that 48% of the respondents are Flexible timings, 12% of the respondents are Holiday homes, 24% of the respondents are Hospitalization, and 16% of the respondents are Overtime. 48 12 24 16 100 48 12 24 16 100 Chart Title Number of Respondents Total
  • 65. TABLE 12: SHOWING THE REGULAR LEARNING PROGRAM OFFERED Particulars Number of Respondents Total Yes 68 68 No 32 32 TOTAL 100 100 CHART SHOWING REGULAR LEARNING PROGRAM OFFERED Inference From the above table it is inferred that 68% of the respondents are Yes, and 32% of the respondents are No. 0 10 20 30 40 50 60 70 80 Yes No
  • 66. TABLE 13: SHOWING THE TRAINING PROGRAM Particulars Number of Respondents Total Strongly Agree 42 42 Agree 11 11 Neutral 41 41 Disagree 4 4 Strongly disagree 2 2 TOTAL 100 100 CHART SHOWING TRAINING PROGRAM Inference From the above table it is inferred that 42% of the respondents are strongly agree, 11% of the respondents are Agree, 41% of the respondents are Neutral,4% of the respondents are disagree and 2% of the respondents are strongly disagree. 0 5 10 15 20 25 30 35 40 45 Strongly Agree Agree Neutral Disagree Strongly disagree
  • 67. TABLE 14: SHOWING THE REGULAR APPRAISALS Particulars Number of Respondents Total Yes 79 79 No 21 21 TOTAL 100 100 CHART SHOWING REGULAR APPRAISALS Inference From the above table it is inferred that 79% of the respondents are Yes, and 21% of the respondents are No. 0 10 20 30 40 50 60 70 80 90
  • 68. TABLE 15: SHOWING THE INTERNAL COMMUNICATION IN MURUGAPPA GROUP OF COMPANY Particulars Number of Respondents Total Good 64 64 Needs improvement 23 23 Not bad 13 13 TOTAL 100 100 CHART SHOWING INTERNAL COMMUNICATION IN MURUGAPPA GROUP OF COMPANY Inference From the above table it is inferred that 64% of the respondents are good, 23% of the respondents are Needs improvement and 13% of the respondents are not bad. 0 10 20 30 40 50 60 70
  • 69. TABLE 16: SHOWING THE GOOD RESPONSE FOR VOCATIONAL TALENT Particulars Number of Respondents Total Strongly agree 31 31 Agree 21 21 Neutral 40 40 Disagree 5 5 Strongly disagree 3 3 TOTAL 100 100 CHART SHOWING GOOD RESPONSE FOR VOCATIONAL TALENT Inference : From the above table it is inferred that 31% of the respondents are strongly agree, 21% of the respondents are Agree, 40% of the respondents are Neutral,5% of the respondents are disagree and 3% of the respondents are strongly disagree. 0 5 10 15 20 25 30 35 40 Strongly agree Agree Neutral Disagree Strongly disagree
  • 70. TABLE 17: SHOWING THE TALENT OF EMPLOYEE AFTER JOINED IN TO THE COMPANY Particulars Number of Respondents Total Good 41 41 Excellent 30 30 No improvement 25 25 Bad 4 4 TOTAL 100 100 CHART SHOWING TALENT OF EMPLOYEE AFTER JOINED IN TO THE COMPANY Inference: From the above table it is inferred that 41% of the respondents are good, 30% of the respondents are Excellent and 25% of the respondents are No improvement and 4% of the respondents are bad. 0 20 40 60 80 100 Chart Title Number of Respondents Total
  • 71. TABLE 18: SHOWING TALENT RETENTION WORKSHOP Particulars Number of Respondents Total Good 46 46 Need Improvement 54 54 Total 100 100 CHART SHOWING TALENT RETENTION WORKSHOP Inference From the above table it is inferred that 46% of the respondents are good, 54% of the respondents are Needs improvement. 0 20 40 60 80 100 120 Good Need Improvement Total Chart Title Number of Respondents Total
  • 72. TABLE 19: SHOWING FEEDBACK MECHANISM IN ORGANIZATION Particulars Number of Respondents Total Good 38 38 Indifferent 24 24 Needs Improvement 20 20 Needs a lot improvement 18 18 Total 100 100 CHART SHOWING FEEDBACK MECHANISM IN ORGANIZATION Inference From the above table it is inferred that 38% of the respondents are good, 24% of the respondents are indifferent, 20% of the respondents are Needs improvement, and 18% of the respondents are needs a lot improvement. 0 20 40 60 80 100 120 Number of Respondents Total
  • 73. TABLE 20: SHOWING SATISFIES AN EMPLOYEE IN AN ORGANIZATION Particulars Number of Respondents Total Salary 18 18 Designation 20 20 Benefits 12 12 Psychological need satisfaction 28 28 Training Given 10 10 Employer relation 12 12 Total 100 100 CHART SHOWING SATISFIES AN EMPLOYEE IN AN ORGANIZATION Inference : From the above table it is inferred that 18% of the respondents are Salary, 20% of the respondents are Designation, 12% of the respondents are Benefits, and 28% of the respondents are Psychological need satisfaction.10% of the respondents are Training Given and 12% of the respondents are Employer relation. 0 20 40 60 80 100 120 Number of Respondents Total
  • 74. TABLE 21: SHOWING NEEDS TO BE IMPROVED IN ORGANIZATION Particulars Number of Respondents Total Work Culture 23 23 Benefits 27 27 Communication 20 20 Feedback Mechanism 30 30 Total 100 100 CHART SHOWING NEEDS TO BE IMPROVED IN ORGANIZATION Inference From the above table it is inferred that 11% of the work culture and the 14% Benefits and the 10 % the respondents are Designation, 20% of the respondents are Benefits, and 30% of the respondents are Feedback Mechanism. 23 27 20 30 100 23 27 20 30 100 0 20 40 60 80 100 120 Number of Respondents Total
  • 75. TABLE 22: Employee’s performance after implementing Retention Management concept: Department Good Bad Purchase 75 25 Finance 90 10 Production 85 15 R & D 80 20 Dispatch 70 30 Total 400 100 Chart showing Employees performance after Implementing Talent Management Initiatives Inference: In above both diagram we can compare performance of all department, before implementing concept of Retention Management and after implementing concept of Retention Management. We can observe that, performance of all departments is increase after implementing Retention Management concept. 0 50 100 150 200 250 300 350 400 Chart Title Good Bad
  • 76. 4.2 Performance appraisals as a tool for Retention: I. Performance appraisal is a method of evaluating the behavior of employees in the work spot, normally including both the quantitative and qualitative aspects of job performance. Performance here refers to the degree of accomplishment of the tasks that make up an individual‘s job. It indicates how well an individual is fulfilling the job demands. Often the term is confused with effort, but performance is always measured in terms of results and not efforts. II. Need of Performance Appraisal: Performance appraisal is needed in order to:  Provides information about the performance ranks, basing on which decision regarding salary fixation, confirmation, promotion, transfer and demotion are taken.  Provide feedback information about the level of achievement and behavior of subordinate. This information helps to review the performance of the subordinate, rectifying performance deficiencies and to set new standards of work, if necessary.  Provide information, which helps to counsel the subordinate.  Provide information to diagnose deficiency in employee regarding skill, knowledge, determine training and developmental needs and to prescribe the means for employee growth provides information for correcting placement.  To prevent grievances and in disciplinary activities. Purpose Performance appraisal aims at attaining the different purpose. They are:  To create and maintain a satisfactory level of performance.  To contribute to the employee growth and development through training self and management development programs.  To help the superiors to have a proper understanding about their subordinates.  To guide the job changes with the help to continuous ranking.  To facilitate fair and equitable compensation based on performance.
  • 77. Methods of Performance Appraisal: The methods of performance Appraisal are basically classified as Traditional Methods, Modern Methods and result – Oriented Appraisal: - The Traditional Methods consists of ‘Graphic Rating Scales, Ranking Method, Paired comparison Method, Forced Distribution Method, Checklist method, APPRAISAL, Group Appraisal and confidential Report. Modern Methods of evaluating performance appraisal are ‘Behaviorally Anchored Rating Scales (BARS)’, BOS, Assessment Center’, Human Resource Accounting’, Management by objectives’, Psychology Appraisal’. Uses of Performance Appraisals:- Performance Improvement: Performance feedback allows the employee, manager, and personnel specialists to intervene with appropriate actions to improve performance. Placement Decisions: Promotions, transfers, and demotions are usually based on past or anticipated performance. Often promotions are a reward for past performance. Training and Development; Poor performance may indicate the need for retraining. Likewise, good performance may indicate untapped potential that should be developed. Career Planning and Development: Performance feedback guides career decisions about specific career paths one should investigate. Staffing Process Deficiencies: Good and Bad performance implies strength or weakness in the personnel department‘s staffing procedures.
  • 78. Traditional and modern Methods of Performance Appraisal METHODS OF PERFORMANCE APPRAISAL Traditional methods Modern Methods 1) Graphic rating scales 1) Behaviorally anchored rating scales 2) Ranking Method 2) Assessment centers/Development centers 3) Paired comparison method 3) Human Asset accounting method 4) Forced distribution method 4) Management by Objectives method 5) Checklist methods 5) 360° Feedback 6) Essay from appraisal 7) Group appraisal 8) Confidential reports.
  • 79. 4.3 Learning and Development - What it means to Retention Introduction After an employee selected, placed and introduced her or she must be provided with training facilities. Training is the act of increasing the knowledge and skills of an employee for doing a particular job. Training is a short-term educational process and utilizing a systematic and organized procedure by which employees learn technical knowledge and skills for a definite purpose. Dale S. Beach Define training, “The organized procedure by which people learn knowledge and/or skill for a definite purpose.” In other words training improves, changes, moulds the employee’s knowledge, skill, behavior, aptitude, and attitude towards the requirements of the job and organization. Training refers to the teaching and learning activity carried on for the primary purpose of helping members on an organization, to acquire and apply the knowledge, skills, abilities and attitudes needed by a particular job and organization. Benefits of training for organization  Lead to prove profitability and/or more positive attitudes towards profit orientation  Improves the job knowledge and skills at all level of the organization  Improves the morale of workforce  Helps people identify with organizational goal  Helps create a better corporate image  Aids in organizational development  Learns from the trainee  Helps to prepare guideline for work  Organization gets more effective decision making and problem solving  It helps to improve labor-management relations.
  • 80. Benefits to the individual which in turn ultimately should benefit the organization  Helps the individual in making better decisions and effective problem solving  Through training and development, motivational variables of achievement, growth, responsibilities and advancement are internalized and operationised  It helps to an individual to handle stress tension or conflicts.  It provides information to improve leadership knowledge.  Develops a séance of growth in learning  Improves morale  Improves impersonal skills Technological advances: Every organization in order to survive and to be effective should adopt the latest technology, i.e. mechanization, computerization, automation. Adoption of the latest technology means and methods will not be complete until they are manned by employees possessing skill to operate them. So, organization should train the employee to enrich them in the areas of changing technical skills and knowledge from time to time. Human relations: Trends in approach towards personel management have change from the commodity approach to partnership approach, crossing the human relations approach. So, today, management of most of the organization has to maintain human relations besides maintaining sound industrial relations although hitherto the managers are not accustomed to deal with workers accordingly. So, training in human relations is necessary to deal with human problems and to maintain human relations.
  • 81. Methods of Training The most widely used methods of training used by organizations are classified into two categories: On- the-Job Training & Off-the-Job Training. ON-THE-JOB TRAINING It’s given at the work place by superior in relatively short period of time. This type of training is cheaper & less time-consuming. This training can be impacted by basically four methods: - Job Rotation: - In this method, the trainees move from one job to another, so that he/she should be able to perform all types of jobs. E.g. In banking industry, employees are trained for both back-end & front-end jobs. In case of emergency, (absenteeism or resignation), any employee would be able to perform any type of job. OFF THE JOB TRAINING: - Lectures/Conferences:- This approach is well adapted to convey specific information, rules, procedures or methods. This method is useful, where the information is to be shared among a large number of trainees. The cost per trainee is low in this method. Films: It can provide information & explicitly demonstrate skills that are not easily presented by other techniques. Motion pictures are often used in conjunction with Conference, discussions to clarify & amplify those points that the film emphasized. Simulation Exercise: - Any training activity that explicitly places the trainee in an artificial environment that closely mirrors actual working conditions can be considered a Simulation. Simulation activities include case experiences, experiential exercises, vestibule training, management games & role-play.
  • 82. Cases: - Present an in depth description of a particular problem an employee might encounter on the job. The employee attempts to find and analyze the problem, evaluate alternative courses of action & decide what course of action would be most satisfactory. Vestibule Training: - Employees learn their jobs on the equipment they will be using, but the training is conducted away from the actual work floor. While expensive, Vestibule training allows employees to get a full feel for doing task without real world pressures. Additionally, it minimizes the problem of transferring learning to the job. .Search for Internal or External trainer: Internal Trainer: - After assessment of need of training, they search for a trainer in theirs company who can train there employee. They search trainer among their employees. External trainer: - If they didn’t find internal trainer then they go for External trainer. They try to find external professional trainer from their personnel contact, by giving advertisement in news paper etc. Design program for training: - HR manager or head of the department present there need to trainer. They assess type of training and design training program by the help of trainer within the budget.
  • 83. Chapter 5: Findings, Suggestion and Conclusions
  • 84. FINDINGS  From the above survey conducted it is inferred that 78% of the respondents are male, 22% of the respondents Female.  23% of the respondents are 20-30 aged persons, 56% of the respondents are 31-40 aged persons, 15% of the respondents are 41-50 aged persons and 6% of the respondents are above 50 aged persons.  48% of the respondents are junior executive, 21% of the respondents are Operator, and 31% of the respondents are Manager.  60% of the respondents are UG, 20% of the respondents are PG, 10% of the respondents are diploma, and 10% of the respondents are HSC.  55% of the respondents are below 5yrs, 15% of the respondents are 6-10yrs, 10% of the respondents are 11-15yrs, 15% of the respondents are 16-20yrs and 5% of the respondents are above 20yrs.  44% of the respondents Married and 56% of the respondents are Unmarried.  54% of the respondents are below 10000, 15% of the respondents are 10000-20000, 16% of the respondents are 20000-30000, and 15% of the respondents are above 30000.  54% of the respondents are Campus Recruitment, 15% of the respondents are Consultancy, 16% of the respondents are Direct Recruitment, and 15% of the respondents are Reference.  94% of the respondents are Yes, and 39% of the respondents are No.  28% of the respondents are Leave Encashment, 12% of the respondents are Holiday pay benefits, 25% of the respondents are Vocation pay benefits, 13% of the respondents are Worker’s compensation benefits and 22% of the respondents are Life Insurance benefits.  48% of the respondents are Flexible timings, 12% of the respondents are Holiday homes, 24% of the respondents are Hospitalization, and 16% of the respondents are Overtime.  42% of the respondents are strongly agree, 11% of the respondents are Agree, 41% of the respondents are Neutral,4% of the respondents are disagree and 2% of the respondents are strongly disagree.
  • 85.  31% of the respondents are strongly agree, 21% of the respondents are Agree, 40% of the respondents are Neutral,5% of the respondents are disagree and 3% of the respondents are strongly disagree.  18% of the respondents are Salary, 20% of the respondents are Benefits, 24% of the respondents are Needs Incentives, and 38% of the respondents are Position.  18% of the respondents are Salary, 20% of the respondents are Designation, 12% of the respondents are Benefits, and 28% of the respondents are Psychological need satisfaction.10% of the respondents are Training Given and 12% of the respondents are Employer relation.  23% of the respondents are Salary, 27% of the respondents are Designation, 20% of the respondents are Benefits, and 30% of the respondents are Feedback Mechanism.
  • 86. Suggestion and Recommendation:  HR Department should interact and expose inbound employee  Perform various task to motivate employee for work, because various employee cannot work with motivation they just do it, because organization pay for them.  Most of respondent feel that they are well taken care by their employer but still should have regular meeting with employees and ask about their feedback.  New training session should be there to update employee’s skills.  Equal promotion opportunity should be given at correct interval.
  • 87. Conclusion: Retaining Retention Management for the HR Community is an opportunity for HR professionals to develop in their areas of expertise and in their careers. A strong HR Community helps create a strong public service. The goal of Retention Management is to better understand our people in the HR Community so we can support professional and career development and align individual needs and goals with the business focus of HR. We also want to ensure that we as a Community have the ability to develop people so that we are meeting the future needs of the community and government and our clients. This first broad sweep of the Community provides a foundation on which to ensure leadership continuity, knowledge transfer and service continuity. The initial implementation resulted in a number of important human resource priorities and strategies, such as performance management, leadership and management development, attraction and retention, employee learning and development and culture, all of which are supported by the HR Strategy for the HR Community. The critical next step in the process is the implementation of the Retaining Retention Management. Plan for the HR Community. Individually, members of the community and their managers should work together to move forward individual career development plans. The HR Community must work together to promote a Retention Management mindset, Commit to supporting development as a professional group, and integrate Retention Management into the daily fabric of doing business. Retention: We understand it help to developing and implementing practices that reward and support employees. Employee development: Retention Management ensuring continuous informal and formal learning and development. Performance management: Retention Management is specific processes that nurture and support performance, including feedback/measurement.
  • 88. Testing of Hypothesis Retention Management has been developed as a platform for corporate world to manage talents of employee, for company benefits. From above surveys and changes in performance report getting follows information: For company Retention Management is effective process. Retention Management is effective for Company if: Remark from “ Data of Analysis” = Yes OR X = No Quality of the Product increase. Ratio of employees to left job is decrease, and new candidate are increase in organization. Employee getting satisfaction from the job Complaints of employee reduced. Above table show that all the criteria set for Company, to show effective Retention Management process, which is helpful to employee as well as organization. Therefore project is proved the Null hypothesis & disprove the alternative hypothesis. Null Hypothesis:  Employee taking benefits from Retention Management System  Employee can retain successfully for the benefit of organization  Employee’s performance increased by Retention Management  Employee turnover of organization affected by Retention Management Procedure
  • 90. Company Workshop Name of Employee: Roll No. Department: Designation: Joining Date: Qualification:
  • 92. Bibliography I am overwhelmed in presenting my MBA project report in Murugappa Group of Company works for this I wish to express my deep sense of gratitude for following web sources and authors to take their references for these projects. Books: 1) Human Resource Management ---- Margam Publications 2) Human Resource Management System ----- Prof. Mr. Subbarao 3) Human Resource Management ---------- Jyotsna Bhatnagar 4) Retention Management ---- Zarmilaemba Web Sources: 1) Oneclickhr.com 2) Weckipedia.com 3) Google.com 4) Amanet.org 5) Cityhr.com
  • 94. Questionnaires 1. Name : 2. Gender : □ Male □ Female 3. Age : □ 20-30 year’s □ 31-40 year’s □ 41-50 years □ above 50 years 4. Designation : □ junior executive □ Operator □ Manager and above 5. Qualification : □ UG □ PG □ Diploma □ HSC. 6. Work Experience : □ below 5Yrs □ 6-10 yrs □ 11-15 yrs. □16-20yrs 7. How did you get placed in your organization? a) Campus Recruitment b) Consultancy c) Direct Recruitment d) Reference 8. Are you offered any variable benefits for your deliverables? a) Yes b) No
  • 95. 9. What Direct benefits do you get from your company? a) Leave Encashment b) Holiday pay benefits c) Vocation pay benefits d) Worker’s compensation benefits 10. What indirect benefits do you get from your company? a) Flexible timings b) Holiday homes c) Hospitalization d) Overtime 11. Are you being given ongoing or continuous training program in your organization? a) Yes b) No 12. Do the performance appraisal system is done in organization. a) Annually b) Half yearly c) Quarterly d) Monthly 13. How do you feel is the Internal communication of your organization? a) Good b) Needs improvement c) Not bad
  • 96. 14. Are you satisfied with the performance appraisal mechanism? a) Yes b) No 15. What do you think about your talent after joined in to the company? a) Good b) Excellent c) No improvement d) Bad 16. What do you feel about your talent retention workshop? a) Good b) Need improvement c) Satisfactory d) Unsatisfied 17. How effective do you feel is the feedback mechanism in your organization? a) Good b) Indifferent c) Needs improvement d) Needs a lot of improvement 18. What in your opinion satisfies an employee the most in an organization? a) Salary b) Designation c) Benefits
  • 97. 19. What according to you needs to be improved in your organization? a) Work Culture b) Benefits c) Communication 20. Do you feel satisfaction while you complete your work? a) Yes b) No