Berhampur 70918*19311 CALL GIRLS IN ESCORT SERVICE WE ARE PROVIDING
The mem-edge 11-06-16-
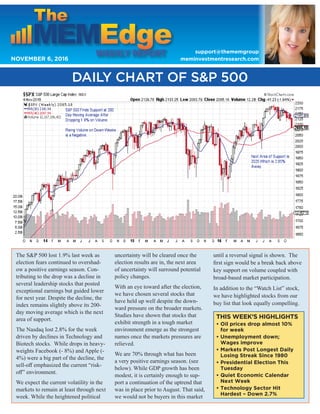
1. DAILY CHART OF S&P 500
The S&P 500 lost 1.9% last week as
election fears continued to overshad-
ow a positive earnings season. Con-
tributing to the drop was a decline in
several leadership stocks that posted
exceptional earnings but guided lower
for next year. Despite the decline, the
index remains slightly above its 200-
day moving average which is the next
area of support.
The Nasdaq lost 2.8% for the week
driven by declines in Technology and
Biotech stocks. While drops in heavy-
weights Facebook (- 8%) and Apple (-
4%) were a big part of the decline, the
sell-off emphasized the current “risk-
off” environment.
We expect the current volatility in the
markets to remain at least through next
week. While the heightened political
uncertainty will be cleared once the
election results are in, the next area
of uncertainty will surround potential
policy changes.
With an eye toward after the election,
we have chosen several stocks that
have held up well despite the down-
ward pressure on the broader markets.
Studies have shown that stocks that
exhibit strength in a tough market
environment emerge as the strongest
names once the markets pressures are
relieved.
We are 70% through what has been
a very positive earnings season. (see
below). While GDP growth has been
modest, it is certainly enough to sup-
port a continuation of the uptrend that
was in place prior to August. That said,
we would not be buyers in this market
until a reversal signal is shown. The
first sign would be a break back above
key support on volume coupled with
broad-based market participation.
In addition to the “Watch List” stock,
we have highlighted stocks from our
buy list that look equally compelling.
THIS WEEK’S HIGHLIGHTS
• Oil prices drop almost 10%
for week
• Unemployment down;
Wages improve
• Markets Post Longest Daily
Losing Streak Since 1980
• Presidential Election This
Tuesday
• Quiet Economic Calendar
Next Week
• Technology Sector Hit
Hardest – Down 2.7%
support@thememgroup
meminvestmentresearch.comNOVEMBER 6, 2016
6. WATCH LIST: NETFLIX, INC.
SYMBOL COMPANY PRICE MARKET CAP INDUSTRY
NFLX Netflix, Inc. $122.03 $51 Billion Entertainment
Netflix, Inc. (NFLX) is a provider
of an Internet television network.
The Company's subscribers can
watch original series, documentaries
and feature films on an internet-
connected screen. The Company has
three operating segments: Domestic
streaming, International streaming
and Domestic DVD. The Domestic
and International streaming
segments derive revenues from
monthlymembershipfeesforservices
consisting of streaming content..
The Company's members can watch
television shows and movies directly
on their televisions, computers and
mobile devices. The Company offers
streaming service both domestically
and internationally. The company
recently reported earnings that
widely exceeded analyst’s estimates.
Mostoftheincreasecamefromalarge
pickupinInternationalsubscriptions
as Netflix continues to target growth
in that area. Management expects
international growth to continue
into next year with original content
geared to those markets. Next year,
they will be almost doubling the
number of hours of original content
which has been a main attraction for
new growth.
7. WATCH LIST: CORELOGIC, INC.
SYMBOL COMPANY PRICE MARKET CAP INDUSTRY
CLGX Corelogic, Inc. $41.32 $3.5 Billion Property Management
CoreLogic, Inc. (CLGX) is a
provider of property information,
analytics and data-enabled
services. It operates through two
segments: Property Intelligence
and Risk Management and Work
Flow. Its Property Intelligence
segment and Risk Management
and Work Flow segment owns or
licenses real property, mortgage
and consumer information. Its
valuation solutions provide a
range of real estate valuation
services. Its credit and screening
solution has access to consumer
and business databases, which
enables them to provide credit
and income verification services
The company recently reported
earnings that were above estimates
while also reporting their
strongest quarter of operating
margins to date. Management
attributes these strong numbers to
a continued move away from their
core mortgage related markets and
into insurance and geospacial as
well as improving growth outside
of the U.S.
8. WATCH LIST: EAGLE MATERIALS, INC.
SYMBOL COMPANY PRICE MARKET CAP INDUSTRY
EXP Eagle Materials, Inc. $82.07 $4 Billion Construction
Eagle Materials Inc. (EXP)
is a supplier of construction
products, building materials and
materials used for oil and natural
gas extraction. The Company's
construction products are used in
residential, industrial, commercial
and infrastructure construction,
and include cement, slag, concrete
and aggregates. Its building
materials include gypsum wall
board.Itsbasicmaterialusedforoil
and natural gas extraction include
frac sand and oil well cement. It
sells cement in over six regional
markets, including northern
Nevada and California, the greater
Chicago area, the Rocky Mountain
region, the Central Plains region
and Texas. The company just
report earnings that were double
the same quarter last year. Con
struction spending is driving
results at the moment, enabling
the company to raise prices
which should improve revenues.
Construction related sales are
more than offsetting weaker sales
to oil-related customers. However,
with oil prices improving this year,
it is setting the oil market share of
their business up for a recovery,
9. Disclaimer: This publication “MEM Edge Report” is published by MEM Investment Research, LLC, and is both proprietary and intended for the sole use of subscribers. No license is granted to any subscriber, except for
the subscriber’s personal use. No part of this publication or its contents may be copied, downloaded, stored in a retrieval system, further transmitted, or otherwise reproduced, stored, disseminated, transferred, or used,
in any form or by any means, except as permitted under the subscription agreement or with the prior written permission of MEM Investment Research, LLC. Any further disclosure or use, distribution, dissemination or
copying of this publication, message or any attachment is strictly prohibited. MEM Investment Research, LLC is a financial publisher who publishes information about markets, stocks, industries, sectors and investments
in which it believes sub-scribers may be interested. The information in this letter is not intended to be personalized recommendations to buy, hold or sell investments. MEM Investment Research, LLC is not permitted to
offer personalized trading or investment advice to subscribers. Employees of MEM Investment Research, LLC may own positions in stocks mentioned or highlighted in THE MEM Edge Report. The information, statements,
views and opinions included in this publication are based on sources (both internal and external sources) considered to be reliable, but no representation or warranty, express or implied, is made as to their accuracy,
completeness or correctness. Such information, statements, views and opinions are expressed as of the date of publication, are subject to change without further notice and do not constitute a solicitation for the
purchase or sale of any investment referenced in this publication. By using the information in THE MEM Edge Report, or from MEM Investment Research, LLC, or www.meminvestmentresearch.com, you assume full
responsibility for any and all gains and losses, financial, emotional or otherwise, experienced, suffered or incurred by you. SUBSCRIBERS SHOULD VERIFY ALL CLAIMS AND DO THEIR OWN RESEARCH BEFORE INVESTING
IN ANY INVESTMENTS REFERENCED IN THIS PUBLICATION. INVESTING IN SECURITIES AND OTHER INVESTMENTS, SUCH AS STOCKS, OPTIONS AND FUTURES, IS SPECULATIVE AND CARRIES A HIGH DEGREE OF RISK.
SUBSCRIBERS MAY LOSE MONEY TRADING AND INVESTING IN SUCH INVESTMENTS.
* = Earnings Due
Bold Italics Are In Buy Zones
Buy on Pullback Only
Being Removed From The List.
SYMB COMPANY PRICE MKT CAP DATE ADDED PERFORMANCE INDUSTRY GROUP
ADBE Adobe Systems Incorporated 106.2 92.40 B 03/27/2016 22.00% Software
AMZN Amazon.com, Inc. 755.05 683.38 B 05/08/2016 15.00% E-Commerce
FB* Facebook, Inc. 120.75 105.13 B 03/20/2015 46.00% Technology-Social Media
HAL Haliburton Company 46.38 41.00 B 10/23/2016 -3.00% Oil and Natural Gas
ISBC Investors Bancorp, Inc. 12.15 10/30/2016 -1.00% Banking
LFL Latam Airlines Group 9.14 2.8 B 10/16/2016 3.00% Air Transportation
LRCX Lam Research Corporation 95 93.05 B 08/07/2016 4.50% Semiconductor
MS Morgan Stanley 32.78 61.00 B 10/04/2016 2.50% Investment Management Group
NTES NetEase, Inc. 243.43 153.40 B 05/15/2016 65.00% E-Commerce/Web Services
PYPL PayPal Holdigs, Inc. 40.9 3.00 B 10/30/2016 -2.00% Payment Solutions
RF Regions Financial Corporation 10.52 13.00 B 10/23/2016 -1.00% Finance
RTN Raytheon Company 132.97 133.61 B 06/05/2016 2.00% Defense
MEM Edge Report Suggested Holdings
Stocks With Emerging Leadership Characteristics