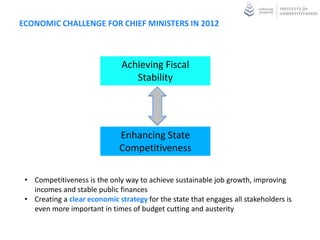
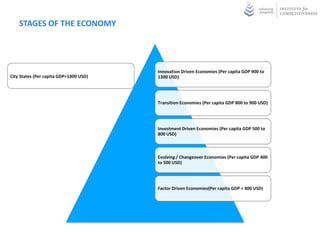
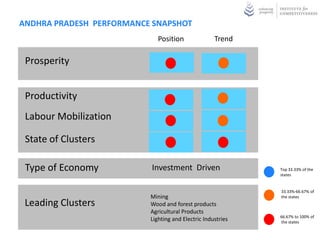
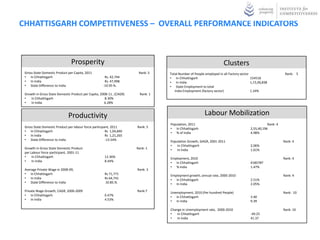
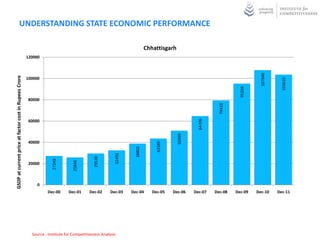
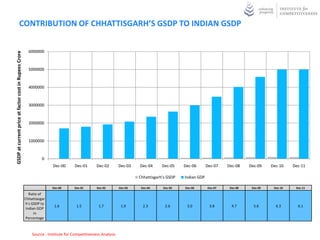
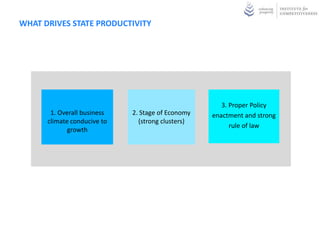
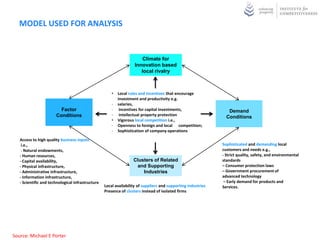
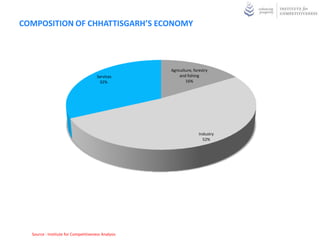
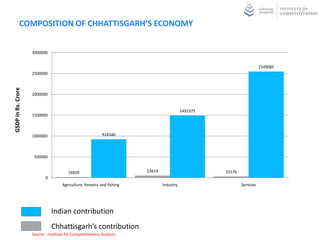
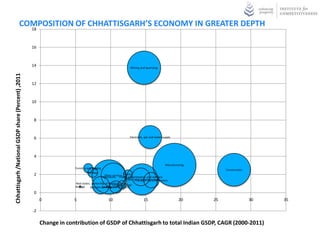
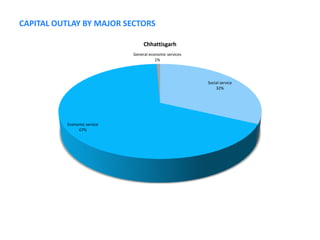
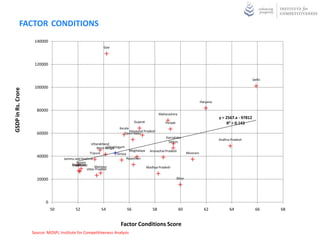
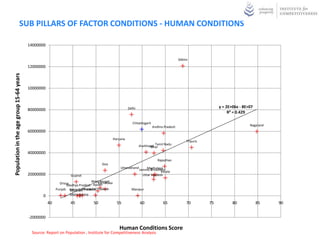
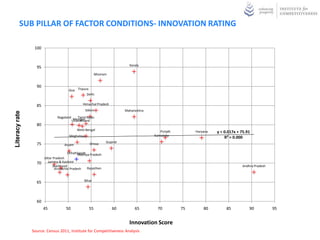
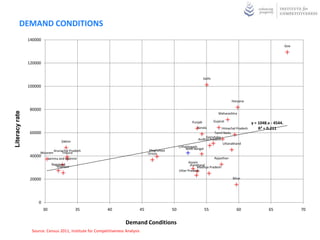
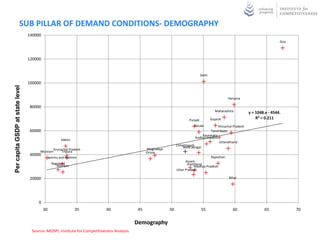
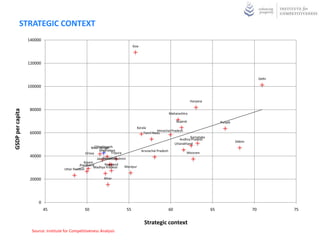
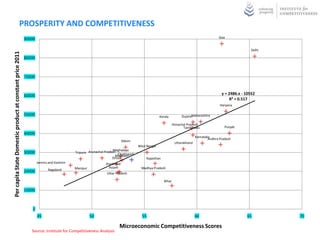
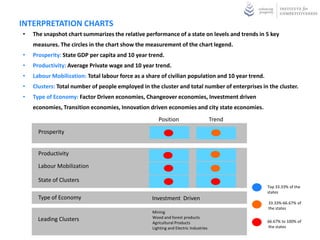
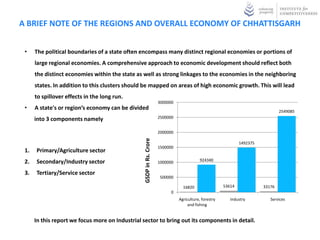
STATE PROFILES – CHHATTISGARH
ECONOMIC CHALLENGE FOR CHIEF MINISTERS IN 2012


                               Achieving Fiscal
                                  Stability


                              Enhancing State
                              Competitiveness

 • Competitiveness is the only way to achieve sustainable job growth, improving
   incomes and stable public finances
 • Creating a clear economic strategy for the state that engages all stakeholders is
   even more important in times of budget cutting and austerity
HIERARCHY OF MEASUREMENT OF STATE COMPETITIVENESS INDEX


                                  4 Major
                                   Pillars


                               12 Sub Indices


                               350* Indicators


* Approximate figure
STAGES OF THE ECONOMY


                                        Innovation Driven Economies (Per capita GDP 900 to
City States (Per capita GDP>1300 USD)   1300 USD)


                                        Transition Economies (Per capita GDP 800 to 900 USD)


                                        Investment Driven Economies (Per capita GDP 500 to
                                        800 USD)


                                        Evolving / Changeover Economies (Per capita GDP 400
                                        to 500 USD)


                                        Factor Driven Economies(Per capita GDP < 400 USD)
STATES ACCORDING TO CATEGORIZATION
                                                                           Microeconomic Competitiveness
      Categorization
                                                                           Ranks
      City States (Per capita Incomes >1300 USD)
      Delhi                                                                                 1
      Goa                                                                                   2
      Innovation Driven Economies (Per capita Incomes 900 to1300 USD)
      Haryana                                                                               1
      Maharashtra                                                                           2
      Gujarat                                                                               3
      Kerala                                                                                4
      Transition Economies (Per capita Incomes 800 to 900 USD)
      Punjab                                                                                1
      Tamil Nadu                                                                            2
      Himachal Pradesh                                                                      3
      Investment Driven Economies (Per capita Incomes 500 to 800 USD)
      Andhra Pradesh                                                                        1
      Karnataka                                                                             2
      Uttarakhand                                                                           3
      West Bengal                                                                           4
      Chhattisgarh                                                                          5
      Sikkim                                                                                6
      Mizoram                                                                               7
      Meghalaya                                                                             8
      Arunachal Pradesh                                                                     9
      Tripura                                                                              10
      Evolving/ Changeover Economies (Per capita Incomes 400 to 500 USD)
      Rajasthan                                                                             1
      Jharkhand                                                                             2
      Orissa                                                                                3
      Jammu and Kashmir                                                                     4
      Factor Driven Economies(Per capita Incomes < 500 USD)
      Bihar                                                                                 1
      Madhya Pradesh                                                                        2
      Assam                                                                                 3
      Uttar Pradesh                                                                         4
      Manipur                                                                               5
      Nagaland                                                                              6

  Source: Institute for Competitiveness Analysis
NEAR TERM STATE PROSPERITY PERFORMANCE
                                                                9
Gross Domestic Product per Capita real growth rate, 2000-2011


                                                                                                                                                                     Haryana
                                                                        Low but rising versus India           Chhattisgarh
                                                                                                                                                                                  Highly Productive and Prosperity
                                                                                Bihar                                                                                             Rising versus India
                                                                                                                                                   Maharashtra
                                                                8
                                                                                                                                Himachal Pradesh
                                                                                        Uttar Pradesh
                                                                                                                    Andhra Pradesh

                                                                                                          Orissa
                                                                7                                                       Karnataka         Punjab
                                                                                                                       Sikkim
                                                                                                                  Uttarakhand
                                                                                                     Arunachal Pradesh               Kerala
                                                                                                  Assam                                    Gujarat
                                                                                                    Rajasthan
                                                                                                          Tripura
                                                                6                                                            Tamil Nadu
                                                                                                            West Bengal                                                                                    Goa


                                                                                                                                              Points
                                                                                                                                              Index
                                                                                                                                              57.28
                                                                                                                                              Average
                                                                                                                                              All India
                                                                                                                                                                                 Delhi
                                                                                                          Meghalaya                           All India GSDP
                                                                                             Jharkhand                                        /Capita rate
                                                                                                          Mizoram                             (CAGR) of 6.27 %
                                                                5
                                                                                           Manipur
                                                                                        Madhya Jammu & Kashmir
                                                                                               Pradesh


                                                                                                                                 All India Average
                                                                4
                                                                                              Nagaland                           of 47,998
                                                                        Low and declining versus India                           Rupees/capita
                                                                                                                                                                                    High but declining versus India

                                                                3
                                                                    0               20000                    40000                    60000                      80000         100000           120000                140000

                                                                                                                     Gross Domestic Product per Capita, 2011
COMPETITIVENESS: UNDERLYING CONCEPTS


 • Competitiveness is the productivity with which a state utilizes its
    human, capital, and natural resources
 • Productivity determines wages and the standard of living – Productivity
    growth determines sustainable economic growth
 • Productivity depends on how a state competes, not what industries it
    competes in
 • Innovation in products and processes is necessary to drive productivity
    growth
 • Only productive businesses can create wealth and jobs. States compete to
    offer the most productive environment for business
 • The public and private sectors play different but interrelated roles in creating
    a productive economy
CHHATTISGARH PERFORMANCE SNAPSHOT
                              Position               Trend

 Prosperity


 Productivity
 Labour Mobilization

 State of Clusters

 Type of Economy           Investment Driven                  Top 33.33% of the
                                                              states


                                                              33.33%-66.67% of
                           Mining                             the states
 Leading Clusters          Wood and forest products
                           Agricultural Products
                                                              66.67% to 100% of
                           Lighting and Electric Industries   the states
CHHATTISGARH COMPETITIVENESS – OVERALL PERFORMANCE INDICATORS


                                Prosperity                                                                            Clusters
 Gross State Domestic Product per Capita, 2011                          Rank: 5    Total Number of People employed in all Factory sector                      Rank: 5
 • In Chhattisgarh                                     Rs. 42,744                  • In Chhattisgarh                                     154518
 • In India                                            Rs. 47,998                  • In India                                            1,15,06,838
 • State Difference to India                          -10.95 %.                    • State Employment to total
                                                                                      India Employment (factory sector)                  1.34%
 Growth in Gross State Domestic Product per Capita, 2008-11 , (CAGR)     Rank: 1
 •   In Chhattisgarh                                   8.30%
 •   In India                                         6.28%


                              Productivity                                                                Labour Mobilization
                                                                                   Population, 2011                                                Rank: 4
 Gross State Domestic Product per labour force participant, 2011       Rank: 5     • In Chhattisgarh                                    2,55,40,196
 • In Chhattisgarh                                      Rs 1,04,840                • % of India                                         4.98%
 • In India                                             Rs 1,21,265
 • State Difference to India                            -13.54%                    Population Growth, GAGR, 2001-2011                                        Rank: 4
                                                                                   •   In Chhattisgarh                                  2.06%
 Growth in Gross State Domestic Product                                Rank: 1     •   In India                                         1.61%
 per Labour force participant, 2001-11
 •    In Chhattisgarh                                  12.36%                      Employment, 2010                                                          Rank: 4
 •    In India                                         8.44%                       • In Chhattisgarh                                    4185787
                                                                                   • % India                                            1.47%
 Average Private Wage in 2008-09,                                      Rank: 3
 • In Chhattisgarh                                     Rs 71,771                   Employment growth, annual rate, 2000-2010                                 Rank: 4
 • In India                                            Rs 64,741                   • In Chhattisgarh                                    2.51%
 • State Difference to India                           10.85.%                     • In India                                           2.05%
 Private Wage Growth, CAGR, 2000-2009                                  Rank:7      Unemployment, 2010 (Per hundred People)                                   Rank: 10
 • In Chhattisgarh                                     0.47%                       • In Chhattisgarh                                    3.40
 • In India                                            4.53%                       • In India                                           9.39

                                                                                   Change in Unemployment rate, 2000-2010                                    Rank: 10
                                                                                   •   In Chhattisgarh                                  -49.25
                                                                                   •   In India                                         41.37
UNDERSTANDING STATE ECONOMIC PERFORMANCE

                                                                                                                         Chhattisgarh
                                                       120000


                                                                                                                                                                                107848
GSDP at current price at factor cost in Rupees Crore


                                                       100000


                                                                                                                                                                                           103610
                                                                                                                                                                      95204
                                                       80000


                                                                                                                                                            79419
                                                                                                                                                  64706
                                                       60000


                                                                                                                                        50999
                                                       40000


                                                                                                                              43589
                                                                                                                 38802
                                                                                                       32493
                                                                                           29539
                                                                    27249


                                                                                25846


                                                       20000


                                                            0
                                                                 Dec-00      Dec-01      Dec-02      Dec-03    Dec-04       Dec-05    Dec-06    Dec-07    Dec-08    Dec-09    Dec-10     Dec-11


                                                         Source : Institute for Competitiveness Analysis
CONTRIBUTION OF CHHATTISGARH’S GSDP TO INDIAN GSDP
GSDP at current price at factor cost in Rupees Crore


                                                       6000000


                                                       5000000


                                                       4000000


                                                       3000000


                                                       2000000


                                                       1000000


                                                                0
                                                                       Dec-00     Dec-01     Dec-02        Dec-03    Dec-04    Dec-05    Dec-06       Dec-07   Dec-08   Dec-09   Dec-10   Dec-11

                                                                                                                    Chhattisgarh's GDP   Indian GDP


                                                                    Dec-00      Dec-01     Dec-02         Dec-03    Dec-04     Dec-05    Dec-06       Dec-07   Dec-08   Dec-09   Dec-10    Dec-11

                                                  Ratio of
                                               Chhattisgarh's
                                               GSDP to Indian
                                                                    1.60        1.44       1.53           1.56      1.65       1.65      1.71         1.86     1.97     2.08      2.16     2.07
                                                  GDP in
                                                Percentage
                                                   Terms


                                                        Source : Institute for Competitiveness Analysis
WHAT DRIVES STATE PRODUCTIVITY


                                                      3. Proper Policy
       1. Overall business   2. Stage of Economy   enactment and strong
      climate conducive to     (strong clusters)
                                                         rule of law
             growth
MODEL USED FOR ANALYSIS


                                                                        Climate for
                                                                    Innovation based
                                                                       local rivalry


                                                       •   Local rules and incentives that encourage
                                                           investment and productivity e.g.
                                                       -   salaries,
                         Factor                        -    incentives for capital investments,                   Demand
                       Conditions                      -    intellectual property protection
                                                                                                                 Conditions
                                                       •   Vigorous local competition i.e.,
                                                       -   Openness to foreign and local competition;
                                                       -   Sophistication of company operations

   Access to high quality business inputs
    i.e.,                                                                                                      Sophisticated and demanding local
    - Natural endowments,                                                                                      customers and needs e.g.,
   - Human resources,                                                                                          - Strict quality, safety, and environmental
   - Capital availability,                                         Clusters of Related                         standards
   - Physical infrastructure,                                       and Supporting                             – Consumer protection laws
   - Administrative infrastructure,                                    Industries                              – Government procurement of
   - Information infrastructure,                                                                               advanced technology
   - Scientific and technological infrastructure                                                                – Early demand for products and
                                                   Local availability of suppliers and supporting industries   Services.
                                                   Presence of clusters instead of isolated firms


Source: Michael E Porter
IMPROVING PRODUCTIVITY IN BUSINESS ENVIRONMENT


 Key Issues for States
 •    More power in terms of tax sharing with center
 •    Reduce costs of doing business
 •    Developing training programs which meet the specific needs of the state
      industrial clusters
 •    Focus on infrastructure investments on the most leveraged areas for
      productivity and economic growth
 •    Implementing policies to support small growth businesses


 • Enhancing the state’s skill development and training institutions for the same
 •    Relentlessly improve of the public education system, the essential foundation
GEOGRAPHIC INFLUENCES ON COMPETITIVENESS


                                   • Influence and access federal
               Nation                policies and programs


                                   • Integrate policies and
         Neighboring states          infrastructure with
                                     neighbors

               States

                                   • Assist each city area in
            City Regions             developing its own strategy


                                   • Connect rural regions with
           Rural Regions             urban areas
CONTRIBUTION OF AGRICULTURE SECTOR TO GSDP

                                                       120000
GSDP at current price at factor cost in Rupees Crore


                                                       100000


                                                         80000


                                                         60000


                                                         40000


                                                         20000


                                                              0
                                                                      Dec-00      Dec-01     Dec-02      Dec-03    Dec-04   Dec-05   Dec-06   Dec-07   Dec-08    Dec-09    Dec-10     Dec-11


                                                                  Dec-00       Dec-01      Dec-02     Dec-03      Dec-04    Dec-05   Dec-06   Dec-07    Dec-08    Dec-09     Dec-10     Dec-11

     Ratio of
   Agricultural
     GSDP in
 Chhattisgarh to
                                                                  24.61        19.89       25.79      20.05       23.94     18.11    20.98    18.20     19.27     15.81      14.92      16.23
 the total GSDP
 in Chhattisgarh
  in Percentage
      terms


                                                       Source : Institute for Competitiveness Analysis
CONTRIBUTION OF MANUFACTURING SECTOR TO GSDP

                                                        120000
 GSDP at current price at factor cost in Rupees Crore


                                                        100000


                                                         80000


                                                         60000


                                                         40000


                                                         20000


                                                             0
                                                                    Dec-00       Dec-01     Dec-02    Dec-03   Dec-04   Dec-05   Dec-06    Dec-07     Dec-08      Dec-09      Dec-10       Dec-11


                                                                 Dec-00      Dec-01       Dec-02     Dec-03    Dec-04   Dec-05    Dec-06     Dec-07      Dec-08      Dec-09       Dec-10        Dec-11


    Ratio of
Manufacturing
    GSDP in
Chhattisgarh to
                                                                 14.00       14.72        12.64      15.23     17.98    24.08     18.03      23.16       22.74        22.06        21.16            22.58
the total GSDP
in Chhattisgarh
 in Percentage
     terms


                                                         Source : Institute for Competitiveness Analysis
CONTRIBUTION OF SERVICE SECTOR TO GSDP

                                                         120000
GSDP at current price at factor cost in Rupees Crore


                                                         100000


                                                          80000


                                                          60000


                                                          40000


                                                          20000


                                                               0
                                                                       Dec-00       Dec-01        Dec-02        Dec-03      Dec-04     Dec-05    Dec-06   Dec-07   Dec-08   Dec-09    Dec-10     Dec-11


                                                              Dec-00       Dec-01        Dec-02            Dec-03        Dec-04      Dec-05     Dec-06    Dec-07   Dec-08    Dec-09     Dec-10     Dec-11


     Ratio of
     Services
    GSDP in
  Chhattisgarh
   to the total
                                                              39.59        42.87         41.96             40.24         37.43       37.19      35.66     33.20    32.10     31.89      32.82       32.02
     GSDP in
  Chhattisgarh
        in
   Percentage
      terms


                                                       Source : Institute for Competitiveness Analysis
COMPOSITION OF CHHATTISGARH’S ECONOMY


                                                    Agriculture, forestry
                                      Services           and fishing
                                       32%                  16%


                                                                    Industry
                                                                      52%


  Source : Institute for Competitiveness Analysis
COMPOSITION OF CHHATTISGARH’S ECONOMY


                    3000000


                                                                                                                         2549085
                    2500000
GSDP in Rs. Crore


                    2000000


                                                                                            1492375
                    1500000


                    1000000                                 924340


                     500000


                                        16820                            53614                        33176
                           0
                                     Agriculture, forestry and fishing           Industry                     Services


                               Indian contribution
                               Chhattisgarh’s contribution
                    Source : Institute for Competitiveness Analysis
COMPOSITION OF CHHATTISGARH’S ECONOMY IN GREATER DEPTH
                                18


                                                    16


                                                    14                                                           Mining and quarrying
Chhattisgarh /National GSDP share (Percent) ,2011


                                                    12


                                                    10


                                                    8


                                                    6                                                           Electricity, gas and water supply


                                                    4
                                                                                                                                            Manufacturing
                                                                      Forestry and logging
                                                                                                                                                                 Construction
                                                                                Railways
                                                    2                                        Other services Fishing
                                                                                            Agricuture Public administration and defence
                                                                                                             Trade, hotel and restaurant means
                                                                                                                     Transport by other
                                                                      Real states, ownership of dwellings and
                                                                                                    Communication
                                                                      Storage     business services and insurance
                                                                                           Banking
                                                    0
                                                         0            5                        10                          15                        20     25                  30   35

                                                    -2

                                                         Change in contribution of GSDP of Chhattisgarh to total Indian GSDP, CAGR (2000-2011)
STATE PRIVATE WAGE PERFORMANCE


                                160000


                                140000
                                                                       Jharkhand                       Wage Growth
                                                                                                       rate 4.53%
Average Wages in Rupees ,2009


                                120000

                                                          Uttaranchal
                                                                                                                        Orissa
                                100000                                         Maharashtra
                                                                                                       Goa
                                                                                                                                                    Average Wage :
                                                                                                                                                    Rupees 64,741
                                80000 Chhattisgarh               West Bengal           Madhya Pradesh
                                                                                                  Haryana Karnataka
                                                                                            Gujarat                                                                       Meghalaya
                                                                               Delhi                          Himachal Pradesh
                                                                                              Uttar Pradesh
                                60000                                                                                            Andhra Pradesh
                                                                                              Punjab      Tamil Nadu
                                                                       Kerala Rajasthan
                                                     Jammu & Kashmir
                                                                            Bihar                 Assam

                                40000
                                                                                                                                                  Manipur

                                                Tripura                        Nagaland
                                20000           Low and declining versus India                                                                                Low but rising versus India


                                     0
                                         0                   2                            4                        6                       8                 10                12           14
                                                                                           Wage Growth (CAGR), 2001 to 2008
                                   Source : Institute for Competitiveness Analysis, Data as of 2010
LABOUR PRODUCTIVITY

                                                            400000
GSDP at Current Prices per labour force participant, 2011


                                                                                                                                                                             Goa

                                                            350000             High but declining versus India                                                                     Highly productive and Productivity
                                                                                                                                                                                   rising versus India

                                                            300000


                                                                                                                                               Points
                                                                                                                                               Index
                                                                                                                                               57.28
                                                                                                                                               e
                                                                                                                                               Averag
                                                                                                                                               India
                                                                                                                                               All
                                                                                                                                      Delhi
                                                                                                                                               All India Average of
                                                            250000                                                                             8.44%

                                                                                                                                                                                      Haryana
                                                            200000
                                                                              All India Average of of Punjab                                                      Maharashtra
                                                                                                                                                                  Kerala    Gujarat
                                                                              1,21,265 Rupees/Labour                               Himachal Pradesh
                                                            150000            force participant       Tamil Nadu
                                                                                                                                      Karnataka       Andhra Pradesh
                                                                                                                                                      Sikkim
                                                                                                                            West Bengal                    Uttarakhand                                      Chhattisgarh
                                                                                           Mizoram                                  Nagaland
                                                            100000                                    MeghalayaTripura Pradesh
                                                                                                             Arunachal                                                                          Orissa
                                                                                                                      Rajasthan
                                                                             Jammu & Kashmir                 Assam
                                                                                    Madhya Pradesh             Jharkhand
                                                                            Manipur
                                                                                                          Uttar Pradesh
                                                             50000                                          Bihar


                                                                                Low and declining versus India                                                             Low but rising versus India
                                                                 0
                                                                     5.00              6.00             7.00               8.00                9.00               10.00                11.00             12.00             13.00


                                                                                                     GSDP /Labor force participant growth rate(CAGR)
                                                              Source : Institute for Competitiveness Analysis
LONG TERM JOB GROWTH


                       90000000

                                                                                                                                             Uttar Pradesh
                       80000000


                       70000000


                                                                                                                                                             All India Average of
                       60000000
                                                                                                                                                             2.05%
Number of Jobs, 2011


                       50000000
                                                                                                                             Maharashtra

                                                                                                                                                                                 Bihar

                       40000000
                                                                                                        West Bengal
                                                                                 Andhra Pradesh
                                                 All India average of
                                                                                                                                             Madhya Pradesh
                       30000000                  1,62,99,464 Jobs                                                     Tamil Nadu

                                                                                                                                                                     Rajasthan
                                                 /State                                                      Karnataka
                                                                                                                                               Gujarat

                       20000000                                                                         Orissa

                                                                                                                                                                Jharkhand
                                                                Kerala                                                    Assam
                                                                                                                 Punjab
                                                                                                                                               Haryana
                                                                                                                                                               Chhattisgarh
                       10000000                                                                                                                                                          Delhi
                                                                                                                                           Uttarakhand       Jammu & Kashmir
                                                                                        Himachal Pradesh
                                      Nagaland                                  Goa                         Tripura                                                            Mizoram Manipur
                                                                                                                                                                              Arunachal Pradesh   Meghalaya

                              0                                                                    Sikkim


                                  0                      0.5                1                     1.5                              2                                2.5                           3           3.5

                                                  Losing Jobs                   Job growth rate CAGR, 2001-2010                                                             Gaining Jobs
                          Source : Institute for Competitiveness Analysis
LONG TERM UNEMPLOYMENT RATE
                                                                                                                           30
                               Goa
                                     jharkhand


                                                                                                                           25


                                                                                                                                 s
                                                                                                                                 Point
                                                                                                                                 Index
                                                                                                                                 57.28
                                                                                                                                 ge
                                                                                                                                 Avera
                                                                                                                                 India
                                                                                                                                 All
                                          Below average Unemployment                                                                   All India Average of -
                                                                                                                           20          2.12%
                                                             Rajasthan
Unemployment rate 2010


                                                                                        Bihar


                                                                                                                                             Unemployment Rising
                                                                                                                           15
                                     Unemployment rate
                                     All India Average of                                               Meghalaya

                                     9.39%                                                               West Bengal                                                  kerala
                                                                                          Gujarat
                                                                                          Punjab                       MizoramOrissa
                                                                                                                Uttar Pradesh
                                                                                                                            10
                                                                                                      Haryana                 Nagaland
                                                                                                                     Manipur
                                                                                                         Tripura           Andhra Pradesh
                                                                                                    Madhya Pradesh
                                                                                                         Arunachal Pradesh                 Above Average
                                                                                                                               Himachal Pradesh     Assam          Unemployment
                                                                                                                           Sikkim Maharashtra
                                                                                                                                   Jammu Tamil Nadu
                                                                                                                             5               Uttarakhand

                                                                                                                                                   Chhattisgarh


                                                                                                                                     Karnataka             Delhi


                                                                                                                             0
                         -25                -20                -15                -10                   -5                       0                     5               10         15
                                                                           Change in Employment rate 1999-2010
                           Source : Institute for Competitiveness Analysis, Data as of 2010
NEAR TERM UNEMPLOYMENT RATE

                                                                                                                                                   30
                                       Goa
                                               jharkhand


                                                                              Points
                                                                              Avera

                                                                              57.28
                                                                              Index
                                                                               All India Average of -


                                                                              India
                                                                                                                                                   25
                                                                               6.55%


                                                                              All


                                                                              ge
                                                                                                                                                   20
Unemployment rate 2010


                                                                              Rajasthan

                                                                                                  Bihar


                                                                                                                                                   15

                                        All India Average of                                      Meghalaya
                                                                                                                                     West Bengal
                                        9.39%                                                                       Punjab
                                                                                                                  Gujarat                             kerala
                                                                                                                          Orissa
                                                                                                                        Haryana                     10
                                                                                                                          Uttar Pradesh
                                                                                                                     Manipur
                                                                                                                Mizoram Nagaland Madhya Pradesh
                                                                                                                                         Tripura Andhra Pradesh
                                                                                                     Arunachal Pradesh
                                                                                                                             Sikkim Assam
                                                                                                             Himachal Pradesh                    Maharashtra             Tamil Nadu
                                                                                                                                        Jammu      Uttarakhand
                                                                                                                                                     5
                                                                                                                                              Chattisgarh
                                                                                                                                                             Karnataka

                                                                                                                                                    Delhi

                                                                                                                                                     0
                         -30                   -25                -20                 -15                     -10                 -5                     0                5           10

                                                                                 Change in Employment rate 2008 to 2010
                               Source : Institute for Competitiveness Analysis, Data as of 2010
GROSS AREA SOWN VERSUS IRRIGATED AREA

                                    100000


                                                                                                                                          Madhya Pradesh
                                                                                                                                                   Maharashtra
                                                                                                                                                                      Uttar Pradesh
                                                                                                                                                           Rajasthan
                                                                                                                                       Tamil Nadu        Andhra Pradesh
                                     10000                                                                                                                Gujarat
                                                                                                                                                        West Bengal
                                                                                                                                                            Punjab Karnataka
                                                                                                                        Chhattisgarh         BiharOrissaHaryana
Log of area sown in ‘000 hectares


                                                                                                       Assam
                                                                                                                         Kerala
                                                 All India Average                                                Jharkhand
                                                 67,41,000                                                                   Uttarakhand
                                      1000                                                                      Himachal Pradesh & Kashmir
                                                                                                                           Jammu
                                                 hectares


                                                                                                                                                             India
                                                                                                                                                             All
                                                                                                                                                   All India Average
                                                                                      Meghalaya            Nagaland
                                                                               Arunachal Pradesh          Tripura                                  30,03,000 hectares
                                                                                            Goa
                                       100                                   Sikkim
                                                                             Mizoram

                                                                                          Delhi


                                        10


                                         1
                                             1                          10                          100                       1000                      10000                         100000

                                                                                          Log of Irrigated Area in ‘000 hectares

                                       Source: MOA, Institute for Competitiveness Analysis, Data as of 2010
HEALTHCARE
Percentage of Total government Expenditure on Medical, Health


                                                                    10
                                                                                                                                    Delhi

                                                                     9


                                                                     8


                                                                     7
                        and Sanitation


                                                                     6           Goa
                                                                                                 Jammu & Kashmir

                                                                                    Uttarakhand
                                                                                                                                                                             All India Average
                                                                     5       Manipur
                                                                                  Himachal Pradesh                                                                           4.02%
                                                                                                              AssamKerala

                                                                         Meghalaya                                                              West Bengal     Tamil Nadu
                                                                             Tripura
                                                                           Nagaland                                                                                                               Uttar Pradesh
                                                                         Mizoram                                        Rajasthan
                                                                     4                                                                Gujarat
                                                                          Sikkim           Chhattisgarh                        Karnataka
                                                                                          Jharkhand Haryana                                               Andhra Pradesh
                                                                                                                   Madhya Pradesh                                            Maharashtra
                                                                                                    Orissa
                                                                                                     Punjab      Bihar

                                                                     3

                                                                    Arunachal Pradesh
                                                                                                                                 India
                                                                                                                                 All


                                                                     2
                                                                                                                   All India Average 1633
                                                                                                                            Crores
                                                                     1
                                                                         0                    1000                   2000                       3000                 4000                  5000               6000


                                                                                       Total Government Expenditure on Medical, Health and Sanitation in Crores
                                                                Source: Institute for Competitiveness Analysis
PERCENTAGE OF VILLAGES ELECTRIFIED

             120


                   100                        100.0
                                                  100.099.7100.098.2 98.2          99.9100.0                                           100.0         100.0
All India    100                          96.9                                              96.4                                                                       96.9 97.3
                                                                                                                                                  94.4
Average of                                                                                         88.3
                                                                                                          85.8
                                                                                                                                                                88.3
84.96 %                     80.8                                                                                        80.6
              80
                                                                                                                                           69.2
                                                                                                                               64.4 62.6
                                   61.3
                                                                                                                 59.3
              60         56.8                                                                                                                            57.2


              40
                                                                            31.1


              20


               0


        Source: Institute for Competitiveness Analysis
TELEDENSITY
                  140000
                                                 Goa


                  120000
                                                                                                                             y = 429.3x + 12630
                                                                                                                                  R² = 0.388
                                                                                                                                                  Delhi

                  100000


                                                       Haryana

                   80000
GSDP per Capita


                                                           Maharashtra

                                                         Gujarat               Punjab
                                                                           Kerala
                                                                               Himachal Pradesh
                   60000                                                        Tamil Nadu
                                                               Karnataka
                                              Andhra Pradesh
                                    Sikkim
                             Arunachal Pradesh Bengal
                                            West
                                 MeghalayaChhattisgarh
                                  Mizoram
                                  Tripura
                                   Orissa           Uttarakhand
                   40000
                      Jammu & Kashmir  Rajasthan
                                  Nagaland Jharkhand
                                   Manipur
                       Madhya Pradesh
                            Uttar Pradesh

                   20000


                        0
                            50           70                90                110             130       150       170   190   210           230            250


                                                                                                   Teledensity
                     Source: Ministry of telecom, Institute for Competitiveness Analysis
DEBT TO GDP RATIO
     West Bengal                                                             42.8                      Prescribed limit according to the
      Uttaranchal                                                          41.1                         growth and stability Pact of EU
    Uttar Pradesh                                                             43.5
           Tripura                                                          42.2
      Tamil Nadu                                     25.5
            Sikkim                                                                                               80.6
        Rajasthan                                                          41.1
           Punjab                                                  35.2
            Orissa                                          30.6
        Nagaland                                                                           59.4
         Mizoram                                                                                                                           109.1
        Meghalya                                                     37.3
         Manipur                                                                                            77.4
     Maharashtra                                     25.1
  Madhya Pradesh                                                   34.4
            Kerala                                                 34.3
       Karnataka                                 24.3
       Jharkhand                                               33.6
 Jammu & Kashmir                                                                                     70.1
        Himachal                                                                     55.7
          Haryana                          19
           Gujarat                                           32.1
               Goa                                              35.5
             Delhi                    13.8                                                  Prescribed limit according
      Chattisgarh                      15.2                                                  to WTO for developing
             Bihar                                                        39.7                      economies
            Assam                                      28
       Arunachal                                                                                                                                   115.9
           Andhra                                           30.1

                     0                   20                          40               60                    80               100                   120


    Source: Institute for Competitiveness Analysis
RURAL POPULATION VERSUS RURAL POPULATION GROWTH RATES

                                4.000

                                                                                                           Meghalaya
                                                                                           Arunachal Pradesh                                                           Bihar
                                                                                     Mizoram             Manipur              Jammu & Kashmir Jharkhand Rajasthan
                                                                                                                                           Chhattisgarh Madhya Pradesh      Uttar Pradesh
                                2.000                                                                                                              Assam
                                                                                                                         Himachal Pradesh
                                                                                                                             Uttarakhand               Orissa Maharashtra
                                                                                                                                          Haryana        Gujarat
                                                                                                                                           Punjab         KarnatakaBengal
                                                                                                                                                              West
                                                                                                                                                           Tamil Nadu
                                                                                                               Tripura
                                                                                                                                                           Andhra Pradesh
                                0.000                                              Sikkim

                                         10                      100                             1,000                              10,000                            100,000                    1,000,000
Growth rate (CAGR 2001-2011)


                                                                                                    Nagaland
                                                                                           Goa                                                                                              Thousands
                                -2.000
                                                                                                                                              Kerala


                                -4.000


                                -6.000


                                                                                   Delhi

                                -8.000


                               -10.000


                                                                Population in Rural areas as per census (provisional Data) in Thousands


                                 Source: Census 2011, Institute for Competitiveness Analysis
URBAN POPULATION VERSUS URBAN POPULATION GROWTH RATES

                               12


                                     Sikkim
                               10
Growth rate (CAGR 2001-2011)


                                 8

                                                                           Kerala


                                      Tripura
                                 6
                                  Nagaland


                                                          Haryana
                                 4 Manipur
                                       Uttarakhand
                                               Chhattisgarh
                     Arunachal Pradesh                                                                   Andhra Pradesh
                             Goa                        Bihar                                        Gujarat
                         Meghalaya & KashmirJharkhand
                             Jammu                                                            Karnataka
                                      Assam Orissa                           Rajasthan                                                            Uttar Pradesh
                          Mizoram                                            Delhi Madhya Pradesh                            Tamil Nadu
                                                    Punjab                                                     West Bengal
                                                                                                                                                                  Maharashtra

                                 2
                               Himachal Pradesh


                                 0
                                      0                      10000                   20000                      30000                     40000                   50000                60000
                                                                                                                                                                                Thousands
                                                            Population in Urban areas as per census (provisional Data) in Thousands
                                       Source: Census 2011, Institute for Competitiveness Analysis
100,000,000
                                                                                                                                                                          120,000,000
                                                                                                                                                                                        140,000,000
                                                                                                                                                                                                             160,000,000


                                                                                                    20,000,000
                                                                                                                 40,000,000
                                                                                                                                  60,000,000
                                                                                                                                               80,000,000


                                                                                         0
                                                                                             151,726
                                                                                             455,962
                                                                                             561,977
                                                                                             529037
                                                                                             313,446
                                                                                             1069165
                                                                                             906,309
                                                                                             551414
                                                                                             573,741
                                                                                              1406861
                                                                                             822,132
                                                                                              1899624
                                                                                             595,036
                                                                                              2368971
                                                                                             960,981
                                                                                               2,710,051
                                                                                             688,704
                                                                                                 6167805
                                                                                               3,091,169
                                                                                                  7,025,583
                                                                                               3,414,106


Source: Census 2011, Institute for Competitiveness Analysis
                                                                                                   9134820
                                                                                                       16,333,916
                                                                                             419319
                                                                                                   8,821,588


                                                              Urban Population in 2011
                                                                                                       16531493
                                                                                                 5,936,538
                                                                                                         19603658
                                                                                                    10,387,436
                                                                                                                                                                                                                           RURAL AND URBAN POPULATION IN INDIA


                                                                                                        17,316,800
                                                                                                4,388,756
                                                                                                              26780516
                                                                                                  7,929,292
                                                                                                             25,036,946
                                                                                                       15,932,171
                                                                                                        17455506
                                                                                                 6,996,124

                                                              Rural Population in 2011
                                                                                                                   34,951,234
                                                                                                             25,712,811
                                                                                                                  34670817
                                                                                                            23,578,175
                                                                                                                    37552529
                                                                                                        17,080,776
                                                                                                                            51,540,236
                                                                                                                   34,949,729
                                                                                                                    37,189,229
                                                                                                         20,059,666
                                                                                                                            52537899
                                                                                                               28,353,745
                                                                                                                              56311788
                                                                                                               29,134,060
                                                                                                                                 62,213,676
                                                                                                     11,729,609
                                                                                                                                                            92075028
                                                                                                                                 50,827,531
                                                                                                                                       61545441
                                                                                                                              44,470,455
                                                                                                                                                                                                      155,111,022
DEMOGRAPHIC PROFILE IN CHHATTISGARH

                         3000000


                                                         2567000
                                    2526000


                                                                   2521000
                                               2497000


                                                                             2365000
                         2500000


                                                                                       1958000
 Population in Numbers


                                                                                                 1666000
                         2000000


                                                                                                           1563000


                                                                                                                     1476000


                                                                                                                               1308000
                         1500000


                                                                                                                                         1066000


                                                                                                                                                   838000
                         1000000


                                                                                                                                                            646000


                                                                                                                                                                     497000


                                                                                                                                                                              374000


                                                                                                                                                                                       242000
                         500000


                                                                                                                                                                                                148000
                               0
                                    0-4        5-9 10-14 15-19 20-24 25-29 30-34 35-39 40-44 45-49 50-54 55-59 60-64 65-69 70-74 75-79 80+
                                   years      years years years years years years years years years years year years years years years years


                 Source: Institute for Competitiveness Analysis
RURAL URBAN AND TOTAL POPULATION

                                                                          120


                                                                                Delhi
Urban Population as a percentage of total Population


                                                                          100                                                           All India Average


                                                                                                                                                India
                                                                                                                                              67.02%


                                                                                                                                                All
                                                                           80


                                                                                                                 Goa
                                                                                                                              Tamil Nadu
                                                                                                                                 Maharashtra
                                                                           60                                                    Kerala
                                                                                                                            Mizoram Gujarat
                                                                                                                                         Karnataka
                                                                                    All India Average                                       Punjab Pradesh
                                                                                                                                             Andhra Bengal
                                                                                                                                                West
                                                                                                                                               Haryana
                                                                                    32.98%                                                         MadhyaUttar Pradesh
                                                                                                                                                            Pradesh
                                                                           40                                                                             Rajasthan
                                                                                                                                                  Uttarakhand
                                                                                                                                                    Manipur
                                                                                                                                                   Jammu & Kashmir
                                                                                                                                                           Jharkhand
                                                                                                                                                     Nagaland
                                                                                                                                                          Chhattisgarh
                                                                                                                                                         Tripura
                                                                                                                                                            Sikkim
                                                                                                                                                                     Orissa
                                                                                                                                                        Arunachal Pradesh Bihar
                                                                                                                                                                Meghalaya
                                                                                                                                                                        Assam
                                                                           20
                                                                                                                                                                      Himachal Pradesh


                                                                            0
                                                          -20                   0                 20                   40                  60                    80                      100   120


                                                                          -20
                                                                                         Rural Population as a percentage of total Population
                                                       Source: Census 2011, Institute for Competitiveness Analysis
SEX RATIO VERSUS SEX RATIO GROWTH RATES
                            0.8
                                                                                                                              Delhi

                            0.7


                            0.6                                                                           All India Average 940


                                                                                                                 India
                                                                                                          females/1000 males                           Mizoram


                                                                                                                 All
                            0.5
                                                                                                                                            Nagaland

                            0.4                                                                                                       Arunachal Pradesh
                                                                                                                                                          Goa
CAGR growth rate 2001-11


                                                           All India Average                                                       Punjab
                                                                                                                                                                       Kerela


                            0.3
                                                            0.169% CAGR                                                        Haryana

                                                                                                                                                   Assam


                            0.2                                                                                                   Sikkim               Meghalaya
                                                                                                                                                  Tripura
                                                                                                                                       Madhya Pradesh
                                                                                                                                            WestAndhra Pradesh
                                                                                                                                                  Bengal
                                                                                                                                Uttar Pradesh
                                                                                                                                                        Manipur
                                                                                                                                                 Himachal Pradesh
                                                                                                                                         Rajasthan       Tamil Nadu
                                                                                                                                              Jharkhand
                            0.1                                                                                                         Maharashtra
                                                                                                                                                       Orissa

                                                                                                                                                    Karnataka
                                                                                                                                                         Chattisgarh
                                                                                                                                                  Uttarakhand
                                                                                                                                        Gujarat

                              0
                                   0                      200                     400               600               800                Bihar
                                                                                                                                                                1000            1200
                            -0.1
                                                                                                                            Jammu and Kashmir


                            -0.2


                            -0.3


                                                                                                 Sex ratio
                                   Source: Census 2011, Institute for Competitiveness Analysis
LITERACY RATES VERSUS GDP

                                           140000
                                                                                                                                                             Goa


                                           120000


                                                                                                                                                         Delhi
GSDP per capita at current prices 2011


                                           100000

                                                                                                                     Haryana                                            y = 1576.x - 73239
                                                                                                                                                                            R² = 0.254
                                            80000
                                                                                                                                      Maharashtra
                                                                                                          Gujarat    Punjab
                                                                                                                                         Himachal Pradesh                             Kerala
                                            60000                                                                              Tamil Nadu
                                                                                                               Karnataka
                                                                           Andhra Pradesh
                                                                                                                                          Sikkim
                                                                                                                            Uttarakhand
                                                                                          Chhattisgarh             West Bengal
                                                                      Arunachal Pradesh                        Meghalaya
                                                                                                         Orissa                                              Tripura        Mizoram
                                            40000                          Rajasthan & Kashmir
                                                                              Jammu
                                                                                                  Assam
                                                                             Jharkhand                                         Nagaland
                                                                                     Madhya Pradesh                            Manipur
                                                                                   Uttar Pradesh

                                            20000             Bihar


                                                0
                                                    60                65                    70                  75               80                 85                 90                  95   100

                                                                                                         Literacy rate 2011

                                            Source: RBI , Census 2011, Institute for Competitiveness Analysis
REVENUE EXPENDITURE VERSUS REVENUE RECEIPTS

                                       120000
                                                                                                                                                                Maharashtra
                                                                                                                                                                     Uttar Pradesh


                                       100000


                                                                                                           India
                                                                                                           All
                                                                                                All India Average 34190
Revenue Expenditure in Rs. Crores


                                                                                                                                           Andhra Pradesh
                                                                                                        Rs. Crores
                                        80000                                                                              Tamil Nadu


                                                                                                        West Bengal


                                                                                                          Gujarat
                                        60000                                                                  Karnataka


                                                                                                         Madhya Pradesh
                                                                                                  Rajasthan
                                                                                                    Bihar                                        All India Average 34757
                                        40000                                        Kerala
                                                                                   Punjab
                                                                                                                                                 Rs. Crores
                                                                               Assam Orissa
                                                                               Haryana


                                                                        Chhattisgarh
                                                                      Jharkhand
                                        20000                             Delhi
                                                           Uttarakhand
                                                        Himachal Pradesh
                                                                     Jammu & Kashmir
                                                      Goa
                                                       Tripura
                                                     Nagaland
                                                      Manipur
                                                   Meghalaya
                                                   Mizoram
                                                  Sikkim
                                                  Arunachal Pradesh
                                              0
                                                  0                    20000                  40000               60000                 80000               100000             120000


                                                                                       Revenue Receipts in Rs. Crores
                                    Source: RBI , Institute for Competitiveness Analysis
LITERACY RATES VERSUS POPULATION

 25000000


                                                                                                  Uttar Pradesh
 20000000                                                                                                                      All India Average


                                                                                                                                           India
                                                                                                                                           All
                                                                                                                               Literacy level of
                                                                                                                                     77.12%

 15000000


                                                                                                                                   Maharashtra

                                                                                       Bihar

 10000000
                    All India Average                                                                                West Bengal
                    67232968 People/state                                                 Andhra Pradesh

                                                                                                    Madhya Pradesh          Tamil Nadu
                                                                                               Rajasthan
                                                                                                                  Karnataka
                                                                                                                          Gujarat


 50000000                                                                                                    Orissa

                                                                                               Jharkhand                                                  Kerela
                                                                                                             Assam
                                                                                                                   Punjab
                                                                                                     Chhattisgarh Haryana

                                                                                                                                             Delhi
                                                                                          Jammu and Kashmir
                                                                                                                         Uttarakhand
                                                                                                                               Himachal Pradesh
                                                                                                                  Meghalaya Manipur
                                                                                                                            Nagaland        Tripura
                                                                                       Arunachal Pradesh                          Sikkim     Goa Mizoram

        0
            0           10            20            30             40    50       60                   70                     80                     90            100

                                                         Literacy rates in Percentage terms

    Source: Census 2011 , Institute for Competitiveness Analysis
GROWTH RATE IN AGRICULTURE VERSUS BANK CREDIT TO AGRICULTURE

                                          20


                                                                                                                                   Gujarat
                                                              Chhattisgarh
                                                                                                                         Punjab

                                                                                                        Haryana

                                          15                                                                                                                                                    Andhra Pradesh

                                                                                                                                                                                  Tamil Nadu
CAGR growth rate in Agriculture 2005-10


                                          Arunachal Pradesh
                                              Meghalaya                         Orissa
                                                                                                                                                                                     Uttar Pradesh
                                                                                                                                                                   Maharashtra
                                                                                                                  Madhya Pradesh
                                                           Assam

                                                                                                        Kerala
                                                                                         Bihar Bengal
                                                                                            West
                                          10
                                                                                                                                                       Karnataka
                                                                                                                              Rajasthan
                                                Sikkim

                                                                                                                                                                           All India Average of
                                                 Tripura
                                                  Goa
                                                     Himachal Pradesh                                                                                                      9.30 % CAGR growth
                                                         Uttarakhand                                                         Delhi

                                            5
                                                Mizoram
                                                 Jammu & Kashmir                                                                                                           rate
                                                Manipur
                                              Nagaland                                                       All India Average of
                                                                                                                   India
                                                                                                                   All

                                                                                                             12,157 Crores/state

                                            0
                                                  0                      5000            10000           15000            20000              25000   30000                35000                40000             45000
                                                         Jharkhand


                                           -5
                                                                                 Outstanding commercial scheduled bank credit to Agriculture in Rs. Crores

                                              Source: MOA , Institute for Competitiveness Analysis
PERCENTAGE OF FACTORIES IN OPERATION VERSUS TOTAL NUMBER OF
               FACTORIES
                                           16
                                                                 Bihar
                                                Nagaland


                                                Tripura       Jharkhand
                                           14 Manipur
Percentage of factories not in operation


                                           12


                                                                                                                                  India
                                                                                                                                  All
                                                                                                                       All India Average of 6198
                                                                                                                             Factories/state
                                           10
                                                                                                    Kerala
                                                                                                                                                                Andhra Pradesh


                                            8                                   Delhi
                                                                  Orissa
                                                                                                                                                                                                       Tamil Nadu
                                                                  Assam

                                                            Chhattisgarh
                                                                                                                                                              All India Average of 4.1%
                                                                                                                                                              factories not in
                                            6
                                                                                                                                                              operation/state average
                                                                                                                    Karnataka
                                                  Himachal Pradesh
                                                                                                                                                                                 Maharashtra
                                            4         Uttarakhand
                                                                         Madhya Pradesh               Rajasthan
                                                                                                                                    Uttar Pradesh
                                              Jammu & Kashmir                                         West Bengal
                                                                                                                                                    Gujarat
                                                                                                                         Punjab
                                                                                          Haryana

                                            2
                                            Meghalaya

                                                      Goa


                                            0
                                                  0                                            5000                                10000                      15000                            20000                25000

                                                                                                                                   Total number of factories

                                                Source: ASI , Institute for Competitiveness Analysis, Data as of 2010
SLUM POPULATION GROWTH RATE (2001-2011)

                                 30
                                                                                  Meghalya


                                                                                                                                                                                                     Arunachal
Population Decadal Growth Rate


                                                                                  Bihar

                                 25                                                            Jammu & Kashmir
                                                                                          Mizoram
                                                                                            Jharkhand
                                                                                                                               Chattisgarh                           India’s decadal population
                                                                                             Rajasthan
                                                                                                                                         Delhi
                                                                                                                                                                     growth rate is 17%.
                                                                                                Madhya Uttar Pradesh
                                                                                                       Pradesh
                                                                                                                                                   Haryana
                                                                                                                 Uttaranchal
                                 20                 Manipur
                                                                                               Gujarat


                                                                                                                               Assam
                                                                                                       Maharashtra
                                                                              Tamil Nadu      Karnataka
                                                                                                       Tripura
                                 15                             West Bengal                       Orissa
                                                                                                                    Punjab
                                                                                                         Himachal
                                                                                                                                                 Sikkim

                                                                Andhra


                                 10
                                                                                                                                                                      Goa


                                                                                                                             Average change in
                                               Kerala                                                                        slum population is
                                  5                                                                                          26%.


                                                                Nagaland
                                  0
                                       0.00             10.00                       20.00                           30.00                          40.00     50.00            60.00          70.00               80.00


                                  -5

                                                                                                 Percentage Change in the Slum Population

                                 Source: MOUA, Data as of 2010
AIR POLLUTION

                           500
                                                                                                                                                                                                  Delhi
                                                                                                                                                                                  Uttar Pradesh

                           450                                                                                                                                                         Rajasthan

                                                                                    SPM Level above 400 is
                                                                                    considered dangerous for
                           400                                                      industrial areas                                                                             Madhya Pradesh

                                                                                                                                                        Punjab
                                                                                                                                                Bihar             Haryana

                           350                                                                                                  Maharashtra
 SPM Level (Residential)


                           300                                                                                  Andhra                                                       West Bengal
                                                                                                 Orissa                                       Gujarat
                                                                                                          Uttaranchal
                                                                                                                        Chhattisgarh

                           250                                                                                                                                                              Himachal
                                                                                               Assam
                                     SPM Level above 140 is                                                                                                      Karnataka

                                     considered dangerous for
                           200
                                     residential areas                                    Tamil Nadu
                                                                                                               Jharkhand


                                                                 Nagaland
                           150                             Mizoram
                                                      Meghalya
                                                                            Goa Kerala
                           100


                            50


                             0
                                 0                   100                                 200                               300                                   400                                      500   600

                                                                    SPM Level (Industrial Area)
                             SPM is Suspended Particulate matter. The above mentioned limits are are prescribed by Central
                             Pollution Control Board (CPCB), India.
CAPITAL OUTLAY BY MAJOR SECTORS

                                  Chhattisgarh
                             General economic services
                                        1%


                                                         Social service
                                                             32%


          Economic service
               67%
POPULATION PERCENTAGES IN VARIOUS DISTRISTCS OF CHHATTISGARH


                                              2.58
                                                               9.25


                                                                      3.34

                                    10.42
                                                        4.72   5.85
                                                 6.35
                      3.22


                                     15.90
                                                 4.04

               6.02        13.09
                                    3.13

                             2.93


                        Narayanpur
                                    0.55                                     Note: The are 18 districts in Chhattisgarh
                                                                             out of which Bijapur and Narayanpur are
            Bijapur                    5.53                                  newly created districts.
             1.00


                    2.09
POPULATION PERCENTAGES IN VARIOUS DISTRISTCS OF CHHATTISGARH


                                                           Capital City

                                                           Major Cities


                    Bhilai
FACTOR CONDITIONS
                     140000
                                                               Goa


                     120000


                                                                                                                                                                   Delhi

                     100000
GSDP in Rs. Crore


                                                                                                                                    Haryana

                      80000
                                                                                                      Maharashtra
                                                                                                                                              y = 2567.x - 97812
                                                                                    Gujarat              Punjab                                    R² = 0.143
                                                                       Kerala
                                                                              Himachal Pradesh
                      60000                                               Tamil Nadu
                                                                                                          Karnataka
                                                                                                                                              Andhra Pradesh
                                                                                                           Sikkim
                                                     Uttarakhand
                                                               Chhattisgarh
                                                         West Bengal
                                                                                Meghalaya       Arunachal Pradesh
                                                    Tripura           Orissa                                              Mizoram
                      40000                                                    Rajasthan
                                     Jammu and Kashmir
                                            Assam
                                         Nagaland
                                         Jharkhand     Manipur                                Madhya Pradesh
                                                  Uttar Pradesh

                      20000                                                                                       Bihar


                           0
                               50           52                54               56                58                 60                62            64              66     68


                                                                        Factor Conditions Score
                    Source: MOSPI, Institute for Competitiveness Analysis
SUB PILLARS OF FACTOR CONDITIONS - FINANCIAL CONDITIONS

                    140000
                                                                                                                     Goa


                    120000
                                                                                                                     y = 5200.x - 24915
                                                                                                                          R² = 0.750
                                                                                                                                          Delhi

                    100000
GSDP in Rs. Crore


                                                                              Haryana

                     80000
                                                                                        Maharashtra

                                                                        Gujarat
                                                                          Punjab
                                                                                       Kerala
                                                                               Himachal Pradesh
                     60000                                                      Tamil Nadu
                                                                      Karnataka
                                                                        Andhra Pradesh
                                                                                                       Sikkim
                                                                             Uttarakhand
                                                                Chhattisgarh
                                                           West Bengal
                                                       Meghalaya                        Arunachal Pradesh
                                                            Tripura
                                                         Orissa
                     40000                                               Mizoram
                                                     Rajasthan
                                                 Jammu & Kashmir
                                               Assam
                                               Nagaland
                                          JharkhandManipur Pradesh
                                                    Madhya
                                  Uttar Pradesh

                     20000                 Bihar


                         0
                             50                            55                              60                   65                        70      75


                                                                             Financial Conditions Score
                     Source: MOSPI, Institute for Competitiveness Analysis
SUB PILLARS OF FACTOR CONDITIONS - PHYSICAL CONDITIONS
                                           2500
Road length per one lakh of Population


                                                                                                                                                                          Delhi
                                           2000


                                           1500                                                              Arunachal Pradesh


                                                                                                                                                     y = 35.81x - 1554.
                                                                                                                                                         R² = 0.254
                                                                                  Nagaland

                                           1000                                          Tripura

                                                                                Assam
                                                                                                       Manipur
                                                                                             Goa                                 Mizoram
                                                                                         Kerala
                                                                                    Orissa              Himachal Pradesh
                                                                                                             Karnataka
                                                                                                                 Uttarakhand
                                            500                                                     Meghalaya
                                                                                                   Chhattisgarh              Sikkim
                                                                      West Bengal           RajasthanAndhra Pradesh         GujaratNadu
                                                                                                                               Tamil
                                                                                         Jammu & Kashmir         Maharashtra
                                                        Uttar Pradesh
                                                                   Bihar                            Madhya Pradesh
                                                                            Jharkhand            Punjab
                                                                                                             Haryana

                                               0
                                                   45                      50                  55                  60                      65   70          75                    80


                                                                                                    Physical Conditions Score
                                         Source: MORTH, Institute for Competitiveness Analysis
SUB PILLARS OF FACTOR CONDITIONS - COMMUNICATION CONDITIONS
               250
                                                                                                                       Chhattisgarh


               200
Teledensity


               150

                                                              Himachal Pradesh
                          Punjab     Tamil Nadu
                              Kerala                                                                    y = 0.878x + 32.19
                          Karnataka Maharashtra
                                                                                                            R² = 0.115
               100      Haryana
              Andhra Pradesh Gujarat
                West Bengal      Bihar                                 Goa
                       Jharkhand Uttarakhand
                          Rajasthan
                           Orissa                                    Manipur
                      Uttar Pradesh                Tripura     Meghalaya                    Arunachal Pradesh     Mizoram
                                                              Nagaland                    Sikkim
                       Jammu & Kashmir
                             Madhya Pradesh
                          Delhi
                50          Assam


                 0
                     45                       55                     65              75                 85                     95     105


                                                             Communication Conditions Score
              Source: Ministry of Telecom , Institute for Competitiveness Analysis
SUB PILLARS OF FACTOR CONDITIONS – ADMINSTRATION
                                       2000


                                       1800                                                                                    Orissa                                                     Delhi
Total Number of Government Hospitals


                                       1600


                                       1400


                                       1200


                                       1000                                                                               Uttar Pradesh                   Karnataka


                                                                                                                                                       Maharashtra
                                        800                                                Uttarakhand
                                                                                                                                                                     y = 28.91x - 1185.
                                                                                                                                                                         R² = 0.148
                                                                                                                  Tamil Nadu
                                        600                                                                       Jharkhand
                                                                                                                                           Rajasthan

                                                                                       Gujarat                                          Kerala   Madhya Pradesh                 Andhra Pradesh
                                        400                                                                                             West Bengal
                                                                                                          Bihar                              Punjab
                                                                              Assam                                     Arunachal Pradesh
                                                                                                                     Himachal Pradesh                                 Haryana
                                        200                                                                                   Chhattisgarh
                                                                                                                     Jammu & Kashmir
                                                                                                              Nagaland
                                                            Goa                                                    Manipur
                                                                                                               Meghalaya Sikkim
                                                                                                                    Tripura    Mizoram
                                           0
                                               35                 40              45                     50                      55                      60                     65                70
                                        -200


                                                                                  Administration Conditions Score
                                       Source: CBHI, Institute for Competitiveness Analysis
SUB PILLARS OF FACTOR CONDITIONS - HUMAN CONDITIONS

                                          14000000


                                                                                                                                             Sikkim

                                          12000000
Population in the age group 15-64 years


                                          10000000


                                                                                                          Delhi                                                  y = 2E+06x - 8E+07
                                          80000000
                                                                                                                                                                      R² = 0.429

                                                                                                             Chhattisgarh
                                                                                                                            Andhra Pradesh                                       Nagaland
                                          60000000
                                                                                                Haryana
                                                                                                                                                  Tripura
                                                                                                                  Jharkhand Tamil Nadu
                                                                                                                         Bihar
                                          40000000
                                                                                                                               Rajasthan
                                                                                      Goa
                                                                                                    Uttarakhand        Meghalaya
                                                                                                                  Jammu & Kashmir
                                                                                                                                Kerala
                                          20000000                 Gujarat                                          Uttar Pradesh
                                                                               West Bengal
                                                                                    Karnataka
                                                            Orissa
                                                                 Madhya Pradesh Assam
                                                                   MizoramArunachal Pradesh
                                                          Punjab Himachal Pradesh                           Manipur
                                                 0                 Maharashtra

                                                     40            45            50               55              60              65              70        75          80            85    90


                                          -2000000

                                                                                                   Human Conditions Score
                                           Source: Report on Population , Institute for Competitiveness Analysis
SUB PILLAR OF FACTOR CONDITIONS- INNOVATION RATING

                 100


                                                                            Kerala
                  95
                                                          Mizoram


                  90
                                      Goa Tripura
                                                Delhi


                  85                             Himachal Pradesh
                                                   Sikkim                 Maharashtra
Literacy rate


                               Nagaland       Tamil Nadu
                                           Manipur
                                          Uttarakhand
                  80
                                             West Bengal                                    Punjab        Haryana   y = 0.017x + 75.91
                                       Meghalaya                                        Karnataka
                                                                                                                        R² = 0.000
                                                                Gujarat
                  75                Assam            Orissa

                                       Chhattisgarh Pradesh
                                             Madhya
                       Uttar Pradesh
                  70     Jammu & Kashmir
                             Jharkhand                                                                                           Andhra Pradesh
                              Arunachal Pradesh    Rajasthan


                  65                             Bihar


                  60
                       45            50              55             60         65         70         75       80         85          90           95


                                                                            Innovation Score
                Source: Census 2011, Institute for Competitiveness Analysis
DEMAND CONDITIONS
                140000
                                                                                                                                                                         Goa


                120000


                                                                                                                      Delhi

                100000


                                                                                                                                        Haryana

                 80000
Literacy rate


                                                                                                                                 Maharashtra

                                                                                                             Punjab           Gujarat
                                                                                                                                                    y = 1048.x - 4544.
                                                                                                                Kerala           Himachal Pradesh       R² = 0.211
                 60000                                                                                                      Tamil Nadu
                                                                                                                      Karnataka
                                                                                                                  Andhra Pradesh
                                     Sikkim
                                                                                                                                 Uttarakhand
                                                                                                     Chhattisgarh
                                                                                    Meghalaya            West Bengal
                                 Arunachal Pradesh
                     Mizoram          Tripura                                       Orissa
                 40000                                                                                                      Rajasthan
                              Jammu and Kashmir
                                                                                                            Assam
                                Nagaland                                                                     Jharkhand
                                   Manipur                                                                        Madhya Pradesh
                                                                                                     Uttar Pradesh

                 20000                                                                                                                   Bihar


                     0
                         30                   35          40                   45               50                    55                   60                65                70


                                                                    Demand Conditions
                 Source: Census 2011, Institute for Competitiveness Analysis
SUB PILLAR OF DEMAND CONDITIONS- DEMOGRAPHY
                                 140000
                                                                                                                                                                                 Goa


                                 120000


                                                                                                                                  Delhi

                                 100000
Per capita GSDP at state level


                                                                                                                                                    Haryana

                                  80000
                                                                                                                                             Maharashtra        y = 1048.x - 4544.
                                                                                                                         Punjab           Gujarat                   R² = 0.211
                                                                                                                            Kerala           Himachal Pradesh
                                  60000                                                                                                 Tamil Nadu
                                                                                                                                  Karnataka
                                                                                                                              Andhra Pradesh
                                                      Sikkim
                                                                                                                                             Uttarakhand
                                                                                                                 Chhattisgarh
                                                                                                                     West Bengal
                                             Arunachal Pradesh                                  Meghalaya
                                      Mizoram     Tripura                                       Orissa
                                  40000
                                               Jammu and Kashmir                                                                       Rajasthan
                                                                                                                       Assam
                                                 Nagaland                                                               Jharkhand
                                                    Manipur                                                                  Madhya Pradesh
                                                                                                                 Uttar Pradesh

                                  20000                                                                                                              Bihar


                                      0
                                          30                   35         40               45               50                    55                   60               65             70


                                                                                          Demography
                                  Source: MOSPI, Institute for Competitiveness Analysis
SUB PILLAR OF DEMAND CONDITIONS- INCOME AND CONSUMPTION
                             35,000,000
                                                                                                           Uttar Pradesh


                             30,000,000


                             25,000,000                                                                                                Maharashtra
Total number of households


                                                                                                                           Andhra
                                                                                                           West Bengal
                             20,000,000                                                                                    Bihar
                                                                                                                                      Tamil Nadu


                                                                                                                    Madhya Pradesh
                             15,000,000                                                                                       Karnataka              y = 26229x - 5E+06
                                                                                                                                Rajasthan                 R² = 0.143
                                                                                                                                 Gujarat


                                                                                                  Orissa
                             10,000,000
                                                                                                                               Kerala
                                                                                                                      Assam
                                                                                                                           Jharkhand
                                                                                                                 Chhattisgarh
                                                                                                                  Punjab          Haryana
                              5,000,000                                                                                               Delhi
                                                              J&K                                                                            Uttarakhand
                                                                                                                                                  Himachal
                                                                  Tripura
                                                             Manipur                                       Meghalaya
                                                     MizoramNagaland
                                                              Arunachal
                                                                   Sikkim                                                                                                 Goa

                                      0
                                          20                   30                    40                     50                          60                       70             80


                                                                                             Income Distribution
                               Source: Census 2011, Institute for Competitiveness Analysis
SUPPORTING CONDITIONS
               140000
                                                                                                                                                                 Goa


               120000


                                                                                                                                              Delhi

               100000
                                                                                                                                                      y = 2607.x - 10984
                                                                                                                                                           R² = 0.654
                                                                                                                   Haryana

               80000
GSDP/ Capita


                                                                                                Maharashtra

                                                                                                             Gujarat                                                   Punjab
                                                                                      Kerala
                                                                               Himachal Pradesh
               60000                                                                                                             Tamil Nadu
                                                                                                    Karnataka
                                                                                                                Andhra Pradesh
                                   Sikkim
                                                                                               Uttarakhand
                                                  Chhattisgarh                   West Bengal
                                     Meghalaya
                             Arunachal Pradesh Orissa Tripura
               40000                                            Mizoram
                                                           Rajasthan
                                            Jammu and Kashmir
                                                Assam
                                    Nagaland Jharkhand
                                 Manipur          Madhya Pradesh
                                    Uttar Pradesh

               20000                                   Bihar


                    0
                        50                        55                      60                          65                            70                   75                     80

                                                                                 Supporting Conditions
                 Source: MOSPI, Institute for Competitiveness Analysis
SUB PILLAR OF SUPPORTING CONDITIONS- DIVERSITY OF FIRMS
                            25000


                                                                                                                                   Tamil Nadu


                            20000
                                                                                                          Maharashtra


                                                                                                     Andhra Pradesh
Total number of factories


                            15000                                                                                       Gujarat


                                                                                                                                  y = 402.4x - 18291
                                               Uttar Pradesh                                                                          R² = 0.299

                            10000
                                                                                                                                                   Punjab
                                                                                            Karnataka

                                                               West Bengal
                                                                     Rajasthan
                                                                                            Kerala

                            5000                                                                          Haryana
                                                                                                                                           Delhi
                                                               Madhya Pradesh
                                                                   Jharkhand
                                                              Assam Bihar
                                                         Orissa
                                                                   Chhattisgarh                       Uttarakhand
                                            Manipur        Jammu and Kashmir                     Himachal Pradesh Goa
                                                                  Tripura
                                           Arunachal Pradesh
                                                     Meghalaya         Mizoram
                                         Sikkim  Nagaland
                                0
                                    45                   50                       55        60                   65               70                   75   80


                                                                                       Diversity of Firms Index
                             Source: ASI, Institute for Competitiveness Analysis
SUB PILLAR OF SUPPORTING CONDITIONS - BUSINESS INCENTIVES
                                               1200000


                                                                                         Maharashtra

                                               1000000
Outstanding Scheduled commercial bank credit


                                                800000


                                                600000


                                                                                                                 Chhattisgarh


                                                400000                                             Tamil Nadu

                                                                                                                     Andhra Pradesh
                                                                                                                 Karnataka
                                                                                                                                                                 y = 5370x - 22486
                                                                                                                                                                     R² = 0.046
                                                                                             Gujarat                            West Bengal
                                                200000               Uttar Pradesh
                                                                                   Rajasthan   Kerala                                              Punjab
                                                                         Madhya Pradesh                               Haryana
                                                              Jharkhand        Orissa
                                                              Meghalaya
                                                                        Bihar Delhi
                                                                         Assam Himachal Pradesh
                                                                    Jammu & Kashmir
                                                                ArunachalSikkim Tripura Uttarakhand
                                                                          Pradesh
                                                                      Manipur                                                                                                        Goa
                                                                 Nagaland        Mizoram
                                                     0
                                                         55                60               65              70                  75            80            85         90                  95   100


                                                                                                                       Business Incentives
                                                Source : RBI, Institute for Competitiveness Analysis
STRATEGIC CONTEXT
                  140000
                                                                                   Goa


                  120000


                                                                                                                                                                    Delhi

                  100000


                                                                                                                             Haryana

                   80000
GSDP per capita


                                                                                                             Maharashtra

                                                                                                                   Gujarat                   Punjab
                                                                                     Kerala
                                                                                                  Himachal Pradesh
                   60000                                                                 Tamil Nadu
                                                                                                                            Karnataka
                                                                                                                     Andhra Pradesh
                                                                                                                                                      Sikkim
                                                                                                                  Uttarakhand
                                                        Chhattisgarh
                                                     West Bengal
                                                           Meghalaya                     Arunachal Pradesh
                                                 Orissa            Tripura                                               Mizoram
                   40000                                    Rajasthan
                                                         Jammu and Kashmir
                                                  Assam
                                               Jharkhand      Nagaland
                                                        Madhya Pradesh       Manipur
                                     Uttar Pradesh

                   20000                                      Bihar


                       0
                           45                    50                           55                             60                         65                     70           75


                                                                                          Strategic context
                   Source: Institute for Competitiveness Analysis
SUB PILLARS OF STRATEGIC CONTEXT – SUPPLIER SOPHISTICATION

                                  1600000


                                                                                                                     Tamil Nadu
                                  1400000

                                                                                                                                        Maharashtra
Total Number of Factory Workers


                                  1200000


                                                                                                                  Andhra Pradesh
                                  1000000
                                                                                                                                                       Gujarat


                                   800000
                                                                                                                                                                 y = 20093x - 80534
                                                     Uttar Pradesh                                                                              Karnataka             R² = 0.206

                                   600000                               West Bengal

                                                                                                                                                                                    Punjab
                                                                                                                                             Haryana
                                   400000        Arunachal Pradesh
                                                      Sikkim
                                                                     Mizoram                      Kerala
                                                                               Rajasthan

                                                                     Madhya Pradesh

                                   200000                      Jharkhand
                                                                   Orissa
                                                                   Assam Bihar                                                                                       Chhattisgarh
                                                                               Delhi              Himachal PradeshUttarakhand
                                                      Nagaland Jammu & Kashmir
                                                                       Tripura
                                                                                            Goa
                                                     Manipur Meghalaya
                                        0
                                            45                 50                      55                  60                      65                       70             75                80


                                                                                                    Supplier sophistication
                                   Source: ASI, Institute for Competitiveness Analysis
SUB PILLAR OF STRATEGIC CONTEXT- INSTITUTIONAL SUPPORT
                                                                  60
Educational Institutions – Universities per crore of population


                                                                                                                                                                                                            Sikkim
                                                                  50


                                                                  40


                                                                                                                                                                                         y = 0.980x - 49.26
                                                                  30                                                                                                                         R² = 0.650


                                                                  20
                                                                                                                                                      Arunachal Pradesh
                                                                                                                                            Uttarakhand

                                                                                                                                    Himachal Pradesh
                                                                                                                  Tamil Nadu                                        Chhattisgarh
                                                                                                         Jammu & Kashmir    Goa                                               Mizoram
                                                                  10                                                                        Manipur
                                                                                                                                             Karnataka
                                                                                                              Rajasthan Tripura
                                                                                                                             Nagaland       Haryana
                                                                                                               Bihar MeghalayaGujarat
                                                                                                                  Orissa      Kerala
                                                                                                                               Maharashtra
                                                                                                                                           Punjab Andhra Pradesh
                                                                                                Jharkhand
                                                                                                       Assam Delhi
                                                                                    Uttar Pradesh        West Bengal
                                                                                                                    Madhya Pradesh
                                                                   0
                                                                        40             45                50                55                60                65              70       75             80            85


                                                                  -10


                                                                                                                                Institutional Support Index
                                                                        Source: UGC, Institute for Competitiveness Analysis
PROSPERITY AND COMPETITIVENESS
                                                           90000                                                                                                                     Goa


                                                                                                                                                                                                      Delhi
Per capita State Domestic product at constant price 2011


                                                           80000


                                                           70000


                                                           60000                                                                                                                       y = 2486.x - 10552
                                                                                                                                                                                           R² = 0.517
                                                                                                                                                                                      Haryana

                                                           50000                                                                             Kerala                Maharashtra
                                                                                                                                                             Gujarat

                                                                                                                                                        Himachal Pradesh
                                                                                                                                                              Tamil Nadu                 Punjab
                                                           40000
                                                                                                                                                                       Karnataka
                                                                                                                                                                               Andhra Pradesh
                                                                                                                      Sikkim
                                                                                                                                                         Uttarakhand
                                                                                                                               West Bengal
                                                                                                              Meghalaya
                                                           30000                       Tripura Arunachal Pradesh Chattisgarh
                                                                                                                Mizoram
                                                                                                              Orissa                Rajasthan
                                                                   Jammu and Kashmir                      Jharkhand
                                                                                       Manipur              Assam                Madhya Pradesh
                                                           20000         Nagaland
                                                                                                          Uttar Pradesh

                                                                                                                                                Bihar

                                                           10000


                                                               0
                                                                   45                            50                              55                                    60                           65        70

                                                                                                                  Microeconomic Competitiveness Scores
                                                              Source: Institute for Competitiveness Analysis
POLICE OFFICIALS VERSUS COMPETITIVENESS
                             180000
                                                                                                                                                                  Maharashtra


                             160000


                             140000
Number of Police Officials


                             120000                                                     Uttar Pradesh


                             100000                                                                                                                                              Andhra Pradesh


                                                                                                                                                           Tamil Nadu
                              80000
                                                                                                                                                                     Karnataka
                                                  Jammu and Kashmir                                              West Bengal
                                                                                                                       Rajasthan                                         y = 2830x - 11635
                              60000                                                                                                                                          R² = 0.122
                                                                                                                 Madhya Pradesh             Bihar              Gujarat
                                                                                                                                                                                                  Punjab

                                                                                                                                   Kerala                                               Haryana
                              40000                                                      Jharkhand
                                                                                       Orissa
                                                                                   Assam                Chhattisgarh

                              20000                                                                                                                 Uttarakhand
                                                                Tripura
                                                             Manipur
                                                  Nagaland                                  Meghalaya                                                  Himachal Pradesh                Goa
                                                                    Arunachal Pradesh        Mizoram
                                                                                                   Sikkim
                                  0
                                      45          47               49             51              53               55                57                   59                61               63            65

                                                                                    Microeconomic Competitiveness Scores
                                 Source: Institute for Competitiveness Analysis
PORT INFRASTRUCTURE VERSUS COMPETITIVENESS
                  60


                                                                                                Maharashtra


                  50


                                                                                                          Gujarat
                  40
Number of Ports


                  30


                                                                                                                                            y = 0.225x + 2.814
                  20
                                                                                                                                                R² = 0.005
                                                                                                                               Tamil Nadu
                                                                                       Kerala
                                                                                                              Andhra Pradesh


                  10
                                                                                                                                                                 Goa

                                               Orissa
                                                                                  West Bengal

                   0
                       50                         55                         60                      65                           70                  75               80

                                                                             Microeconomic Competitiveness Score
                            Source: Institute for Competitiveness Analysis
NATIONAL HIGHWAY INFRASTRUCTURE VERSUS COMPETITIVENESS
                                           7000


                                                                                               Uttar Pradesh
                                           6000
                                                                                                                               Rajasthan
Length of Total National Highways, In Km


                                           5000                                                                           Madhya Pradesh              Tamil Nadu
                                                                                                                                                                       Andhra Pradesh
                                                                                                                                                           Karnataka
                                                                                                                                                                   Maharashtra
                                           4000                                                   Orissa                                   Bihar

                                                                                                                                                         Gujarat

                                                                                                   Assam
                                           3000                                                                                                                               y = 65.13x - 1354.
                                                                                                                     West Bengal                                                  R² = 0.035
                                                                                                           Chhattisgarh                    Uttarakhand
                                                                                           Jharkhand

                                           2000                                                                                                                               Punjab
                                                                                                                                      Kerala                                Haryana
                                                             Jammu and Kashmir                                                                     Himachal Pradesh
                                                                     Manipur                         Mizoram
                                                                                                  Meghalaya
                                           1000           Nagaland
                                                                           Arunachal Pradesh
                                                                        Tripura
                                                                                                                                                                              Goa
                                                                                                                                                                                                   Delhi
                                                                                                            Sikkim
                                              0
                                                  45                             50                                       55                                 60                               65           70

                                                                                                           Microeconomic Competitiveness Score
                                                  Source: Institute for Competitiveness Analysis
AIRPORT INFRASTRUCTURE VERSUS COMPETITIVENESS
                               9

                                                                                                          West Bengal
                               8

                                                                                                                                           Gujarat
                               7
Numbers of Domestic Airports


                               6


                               5

                                                                                                                                           Karnataka
                                                                                                             Madhya Pradesh                            Maharashtra
                                                                                                                                                             Andhra Pradesh
                               4
                                                                                                                                                                     y = 0.116x - 4.225
                                                                                                                                                                         R² = 0.098
                                                                                         Assam                          Kerala Himachal Pradesh Nadu
                                                                                                                                           Tamil                          Punjab
                               3
                                                                         Uttar Pradesh

                                               Jammu and Kashmir                          Mizoram         Rajasthan
                                                                                                                                       Uttarakhand
                               2
                                                                                       Meghalaya
                                               Nagaland        Tripura        Orissa                  Chhattisgarh            Bihar                           Goa   Haryana               Delhi
                                                     Manipur                      Jharkhand
                               1

                                                                    Arunachal Pradesh        Sikkim
                               0
                                   45                               50                                      55                                  60                                  65

                                                                                         Microeconomic Competitiveness Scores
                                   Source: Institute for Competitiveness Analysis
TELEDENSITY VERSUS COMPETITIVENESS
                                                                                                                                                                                                      Delhi

                                                        200
Teledensity , Phones per 100 people in the population


                                                        150


                                                                                                                                                                                y = 4.650x - 210.8
                                                                                                                                                                                    R² = 0.340
                                                                                                                                                    Himachal Pradesh

                                                        100                                                                                                                                 Punjab


                                                                                                                                                                                 Haryana
                                                                                                                                                          Gujarat
                                                                                                                                                                           Andhra Pradesh
                                                                                                                                    Rajasthan                   Maharashtra
                                                                                                                                 Madhya Pradesh
                                                                                                                                                                                 Goa
                                                                     Nagaland                         Uttar Pradesh                               Bihar
                                                         50                     Manipur
                                                                                   Tripura
                                                                                           Arunachal Pradesh Mizoram
                                                                                                       Meghalaya
                                                                                                          Assam                            Kerala

                                                                                                         Orissa                                                     Karnataka
                                                                                                                            West Bengal
                                                                                                                  Sikkim                                   Tamil Nadu
                                                                                                                                                          Uttarakhand
                                                                      Jammu and Kashmir
                                                                                                    Jharkhand     Chhattisgarh


                                                          0
                                                              45                           50                                    55                                 60                               65       70

                                                                                                                Microeconomic Competitiveness Scores
                                                          Source: Institute for Competitiveness Analysis
LITERACY RATES VERSUS COMPETITIVENESS
                 100


                  95                                                                                              Kerala

                                                                              Mizoram


                  90
                                                Tripura                                                                                                             Goa
                                                                                                                                                                                          Delhi


                  85                                                                                                                  Himachal Pradesh
Literacy Rates


                                                                                   Sikkim                                                      Maharashtra

                                    Nagaland Manipur                                                                                       Tamil Nadu
                                                                                                                                   Uttarakhand                       y = 0.237x + 63.62
                  80                                                                                                                                                     R² = 0.023
                                                                                                   West Bengal                                                          Punjab
                                                                                                                                                                     Haryana
                                                                            Meghalaya                                                             Karnataka

                  75                                              Orissa                                                                    Gujarat
                                                                           Assam

                                                                                    Chhattisgarh     Madhya Pradesh
                                                                        Uttar Pradesh
                  70               Jammu and Kashmir
                                                                           Jharkhand                                                                          Andhra Pradesh
                                                          Arunachal Pradesh                               Rajasthan


                  65                                                                                                       Bihar


                  60
                       45                                 50                                         55                                          60                                  65

                                                                           Microeconomic Competitiveness Score
                       Source: Institute for Competitiveness Analysis
EDUCATION VERSUS COMPETITIVENESS
                                                20
 Millions


                                                                                                        Uttar Pradesh


                                                18


                                                16
Students enrolled in higher secondary classes


                                                14


                                                12


                                                10                                                                                                                                       Andhra Pradesh


                                                 8


                                                 6                                                                                                                             Maharashtra

                                                                                                                                      Madhya Pradesh                      Tamil Nadu
                                                 4                                                                                  West Bengal                                                             y = 89218x - 3E+06
                                                                                                                                            Rajasthan                             Karnataka
                                                                                                                                                           Bihar                                                 R² = 0.014
                                                                                                                                                                            Gujarat
                                                 2                                                      Orissa                                    Kerala                                                  Haryana
                                                                                                             Jharkhand
                                                                                                                     Chhattisgarh                                                                            Punjab              Delhi
                                                                   Jammu and Kashmir                          Assam                                                Uttarakhand Pradesh
                                                                                                                                                                       Himachal
                                                                                Tripura
                                                                   Nagaland Manipur                             Mizoram
                                                                                                              Meghalaya                                                                              Goa
                                                                                    Arunachal Pradesh               Sikkim
                                                 0
                                                     45                                    50                                         55                                         60                                        65

                                                                                                         Microeconomic Competitiveness Score
                                                     Source: Institute for Competitiveness Analysis
RURAL TO URBAN LITERACY RATIO VERSUS COMPETITIVENESS
                                                             100.00
                                                                                                                                                 Kerala
Ratio of Urban to rural literacy rates in percentage terms


                                                                                                                                                                                                      Delhi

                                                                                                                                                                                      Goa
                                                              95.00


                                                                                         Tripura
                                                                                                                                                             Himachal Pradesh
                                                                                                                                                  Uttarakhand
                                                                                      Manipur                             Sikkim
                                                              90.00
                                                                                                              Uttar Pradesh                                                                    y = 0.305x + 67.33
                                                                                                                                                                                      Haryana
                                                                                                                                                                                        Punjab
                                                                                                                                                                                                   R² = 0.056
                                                                                                                       Mizoram                                      Maharashtra
                                                                                                                                   West Bengal
                                                                                                                                                                Tamil Nadu
                                                              85.00           Nagaland
                                                                              Jammu and Kashmir                                                                   Gujarat

                                                                                                                 Orissa


                                                                                                                                                                       Karnataka
                                                                                                                  Assam
                                                              80.00                                                    Chhattisgarh                Bihar
                                                                                                                  Meghalaya         Madhya Pradesh
                                                                                                                                       Rajasthan

                                                                                                                                                                                Andhra Pradesh
                                                                                                                 Jharkhand
                                                              75.00
                                                                                                   Arunachal Pradesh


                                                              70.00
                                                                      45                           50                                55                               60                            65              70

                                                                                                                          Microeconomic Competitiveness Score
                                                                 Source: Institute for Competitiveness Analysis
GENDER DISPARITY (LITERACY) VERSUS COMPETITIVENESS
                                                       100.00

                                                                                                                  Meghalaya                         Kerala
                                                                                                        Mizoram
Ratio of Female Literacy Rate to male Literacy rates


                                                        95.00
                                                                             Nagaland

                                                                                         Tripura
                                                        90.00                                                                                                                                                 Delhi
                                                                                                                                                                                         Goa
                                                                                                                           Sikkim                                                           Punjab

                                                                                                                  Assam                                              Tamil Nadu
                                                                                    Manipur                                                                       Himachal Pradesh
                                                                                                                                                                         Maharashtra
                                                        85.00
                                                                                                                                                                            Karnataka
                                                                                                                                                                       Gujarat
                                                                                                                                                                                         y = 0.007x + 81.97
                                                                                                   Arunachal Pradesh
                                                                                                                                                                                             R² = 3E-05
                                                                                                                                                             Uttarakhand
                                                                                                                                                                                    Andhra Pradesh
                                                        80.00                                                     Orissa                                                                   Haryana
                                                                                                                                    West Bengal

                                                                                                              Uttar Pradesh
                                                                     Jammu and Kashmir                                   Chhattisgarh
                                                                                                                             Madhya Pradesh
                                                        75.00
                                                                                                                                                  Bihar
                                                                                                                       Jharkhand


                                                        70.00


                                                                                                                                     Rajasthan
                                                        65.00


                                                        60.00
                                                                45                                 50                                 55                                   60                            65           70

                                                                                                                           Microeconomic Competitiveness Score
                                                          Source: Institute for Competitiveness Analysis
DEMOGRAPHICS OF INDIA 2011
                                                                      Age Pyramid for India in 2011

                                                               80+      4469        5163

                                                              75-79     6075        7017

                                                              70-74     8910        10034

                                                              65-69     11991       12406

                                                              60-64     16693       15712

                                                              55-59     22391       20447

                                                              50-54     28157       26038

                                                              45-49     33218       31993

                                                              40-44     36773       36691
                                                                                                                              Males
                                                              35-39     40596       40164
                                                                                                                              Female
                                                              30-34     46050       42855

                                                              25-29     54078       47877

                                                              20-24     62281       55757

                                                              15-19     63479       58248

                                                              10-14     61318       57259

                                                                5-9     60092       53394

                                                                0-4     60746       54133


80000             60000             40000             20000                     0           20000     40000   60000   80000
                                                Population of males / females in Thousands in 2011


        Source: Census of India, Institute for Competitiveness Analysis
DEMOGRAPHICS OF INDIA 2026
                                                         Age Pyramid for India in 2026

                                                            80+    8412       11465

                                                           75-79   9937       10644

                                                           70-74 15820        15819

                                                           65-69 22185        21982

                                                           60-64 28268        28651

                                                           55-59 32968        34124

                                                           50-54 37704        38267

                                                           45-49 43702        41361

                                                           40-44 51965        46466
                                                                                                                           Male
                                                           35-39 60313        54219
                                                                                                                           Female
                                                           30-34 61859        56739

                                                           25-29 60113        55998

                                                           20-24 59176        52410

                                                           15-19 59529        52739

                                                           10-14 59500        52734

                                                             5-9 58396        51790

                                                             0-4 55328        49256


 80000          60000             40000            20000                  0           20000        40000   60000   80000
                                            Projected Population of males / females in Thousands

    Source: Census of India, Institute for Competitiveness Analysis
OVERALL DEPENDENCE RATIO OF STATES

                                  Dependence Ratios 2011                            Dependence ratio 2026

                                                     West Bengal 44.58      42.35
                                                     Uttarakhand 56.39      47.88
                                                    Uttar Pradesh 66.11     55.02
                                                      Tamil Nadu 43.07      43.78
                                                        Rajasthan 60.51     46.67
                                                           Punjab 46.62     41.77
                                                           Orissa 48.47     43.43
                                       NE States Excluding Assam 44.57      42.23
                                                   Maharashtra 48.85        42.72
                                                 Madhya Pradesh 60.18       48.37
                                                          Kerala 45.23      45.96
                                                       Karnataka 45.97      43.46
                                                       Jharkhand 55.35      47.13
                                                Jammu & Kashmir 50.27       43.11
                                                Himachal Pradesh 46.91      42.87
                                                         Haryana 51.12      41.24
                                                          Gujarat 48.40     43.16
                                                            Delhi 39.96     34.81
                                                      Chattisgarh 57.45     48.40
                                                            Bihar 49.71     47.67
                                                          Assam 51.97       45.14
                                                  Andhra Pradesh 45.05      42.49

80.0              60.0              40.0              20.0                0.0             20.0          40.0   60.0   80.0

                                                  Dependence ratio 2011         Dependence ratio 2026

       Source: Census of India, Institute for Competitiveness Analysis
GOVERNMENT HOSPITALS VERSUS COMPETITIVENESS
                                  1800                                            Orissa
                                                                                                                                    Bihar


                                  1600


                                  1400
Number of government Hoispitals


                                  1200


                                  1000                                                 Uttar Pradesh                                                   Karnataka


                                                                                                                                                     Maharashtra
                                  800
                                                                                                                                       Uttarakhand


                                                                                                                                              Tamil Nadu
                                  600
                                                                                           Jharkhand
                                                                                                                    Rajasthan                                               y = 11.66x - 253.3
                                                                                                                           Kerala                                               R² = 0.016
                                                                                                       Madhya Pradesh                          Gujarat             Andhra Pradesh
                                  400
                                                                                                             West Bengal
                                                                                                                                                                        Punjab
                                                                                             Chhattisgarh
                                                                          Arunachal Pradesh                                                                             Haryana
                                  200                                                   Assam                              Himachal Pradesh                                                Delhi
                                                   Jammu and Kashmir
                                                   Nagaland                               Meghalaya
                                                            Manipur
                                                                Tripura                       Sikkim                                                                     Goa
                                                                                   Mizoram
                                     0
                                         45                               50                                   55                                     60                                   65

                                                                                           Microeconomic Competitiveness Score
                                     Source: Institute for Competitiveness Analysis
REGISTERED DOCTORS VERSUS COMPETITIVENESS
                                                10000


                                                                                                                        West Bengal
                                                9000
Total number of registered Allopathic doctors


                                                8000
                                                                                                                                                         Tamil Nadu
                                                                                                   Uttar Pradesh
                                                7000
                                                                                                                                   Rajasthan


                                                6000

                                                                                                      Orissa                                                   Karnataka
                                                                                                                                                        Andhra Pradesh
                                                5000                                                                                                                                   y = 158.8x - 5888.
                                                                                                                                                                       Maharashtra         R² = 0.114
                                                                                                                                          Bihar
                                                                                                                                    Kerala
                                                4000                                                                      Madhya Pradesh
                                                                                                                                                                                     Punjab          Delhi


                                                3000
                                                                   Jammu and Kashmir                                                                         Gujarat
                                                                                                       Assam
                                                                                                                                                                              Haryana
                                                2000                                               Jharkhand
                                                                                                               Chhattisgarh                    Uttarakhand
                                                                                                                                                                                 Goa
                                                1000                          Tripura               Meghalaya
                                                                           Manipur
                                                                    Nagaland   Arunachal Pradesh        Mizoram
                                                                                                              Sikkim

                                                    0
                                                         45                            50                                     55                                 60                                65        70

                                                                                                          Microeconomic Competitiveness Scores
                                                        Source: Institute for Competitiveness Analysis
PER CAPITA REVENUUE EXPENDITURE ON MEDICAL, HEALTH AND EXPENDITURE
                                              AND COMPETITIVENESS
                                                       2500.00
                                                                                                                                                                                   Goa
Per capita revenue expeniture on medical, health and


                                                       2000.00


                                                                                                                      Sikkim


                                                       1500.00
                                                                                                                   Mizoram
                     sanitation


                                                                                                                                                                                                       Delhi

                                                                                               Arunachal Pradesh


                                                       1000.00                                                                                            Himachal Pradesh
                                                                         Jammu and Kashmir
                                                                                  Manipur
                                                                                                                                                                                  y = 6.696x + 281.1
                                                                                                                                                    Uttarakhand                       R² = 0.004
                                                                          Nagaland                             Meghalaya
                                                                                     Tripura
                                                                                                      Assam                              Kerala              Tamil Nadu
                                                                                                                                                                                    Haryana
                                                                                                                                                                             Andhra Pradesh
                                                                                                                                                                                       Punjab
                                                        500.00                                                               Madhya Pradesh
                                                                                                                  Chhattisgarh                                   Maharashtra
                                                                                                                                                               Gujarat
                                                                                                                                                                    Karnataka
                                                                                                               Orissa West Bengal Rajasthan
                                                                                                           Uttar Pradesh                          Bihar
                                                                                               Jharkhand


                                                          0.00
                                                                 45                            50                              55                                  60                             65           70

                                                                                                                     Microeconomic Competitiveness Scores
                                                          Source: Institute for Competitiveness Analysis
HOUSEHOLDS AND COMPETITIVENESS
                                   35
                                                                                                                                     Uttar Pradesh


                                   30
Number of Households in Millions


                                   25                                                                                Maharashtra


                                                                                                                                                                        Andhra Pradesh
                                                                                                                 West Bengal
                                   20                                                     Bihar
                                                                                                                                                                                Tamil Nadu


                                                                                                                            Madhya Pradesh
                                   15
                                                                                         Karnataka
                                                                                                                         Rajasthan
                                                                                                                                                                                                  Gujarat
                                                                                                                                                                           y = 37114x - 1E+07
                                                                                                                                                                                R² = 0.045
                                                                                         Odisha
                                   10
                                                                                                                                                               Kerala

                                                      Jharkhand                           Assam
                                                                                                  Chhattisgarh                                       Punjab
                                                                                                                                                     Haryana
                                    5               Delhi

                                                                                      Nagaland                                       Uttarakhand Jammu & Kashmir
                                                              Tripura                                                                                    Himachal Pradesh
                                              Meghalaya                                                                                                                        Manipur
                                                                                           Mizoram                                                                    Goa
                                                                  Arunachal Pradesh            Sikkim
                                    0
                                    45.00                               50.00                                    55.00                                  60.00                                   65.00

                                                                                         Microeconomic Competitiveness Score
                                        Source: Institute for Competitiveness Analysis
AGRICULTURAL GSDP PER CAPITA AND COMPETITIVENESS
Agricultural GSDP per capita in Rupees /Annum


                                                25000.00


                                                                                                                                                                                                   Punjab


                                                20000.00


                                                                                                                                                                                              Haryana


                                                15000.00
                                                                      Nagaland
                                                                                                                                                                Himachal Pradesh        Andhra Pradesh

                                                                                                                                                                                                      y = 199.8x - 2794.
                                                                                                                                                                                             Goa          R² = 0.060
                                                                                                                                                                      Gujarat
                                                10000.00                                                   Orissa
                                                                                                                                West Bengal    Kerala
                                                                                             Arunachal Pradesh       Sikkim
                                                                                   Tripura                     Assam                   Rajasthan                          Maharashtra
                                                                  Jammu and Kashmir
                                                                                                                                                             Uttarakhand    Karnataka
                                                                                 Manipur                  Uttar Pradesh ChhattisgarhMadhya Pradesh
                                                                                                              Meghalaya
                                                                                                                                                                     Tamil Nadu

                                                                                                                Mizoram

                                                 5000.00
                                                                                                                                                     Bihar

                                                                                                             Jharkhand

                                                                                                                                                                                                                      Delhi

                                                    0.00
                                                           45                                50                                   55                                       60                                    65

                                                                                                             Microeconomic Competitiveness Score
                                                    Source: Institute for Competitiveness Analysis
PER CAPITA FERTILIZER CONSUMPTION AND COMPETITIVENESS
                                                                     60


                                                                                                                                                                                                                         Punjab
Per caipita consumption of Nitrogenous fertilizers in Kg per annum


                                                                     50


                                                                     40                                                                                                                                             Haryana


                                                                     30

                                                                                                                                                                                                             Andhra Pradesh

                                                                                                                                                                                         Gujarat                                  y = 1.047x - 48.11
                                                                                                                                                                                                                                      R² = 0.212
                                                                     20
                                                                                                Uttar Pradesh                                                                                   Karnataka
                                                                                                                                                                                               Maharashtra
                                                                                                                                        Chhattisgarh   Madhya Pradesh
                                                                                                                                                          Rajasthan
                                                                                                                             Uttarakhand
                                                                                                                                    Tamil Nadu                             Bihar West Bengal
                                                                     10                                                        Orissa
                                                                                     Jammu & Kashmir
                                                                                                                                Assam                                              Himachal Pradesh
                                                                                                                                                                  Kerala                Tripura
                                                                                                Manipur                             Mizoram                                                                        Goa
                                                                                     Nagaland                   Arunachal PradeshJharkhand                                                                                                    Delhi
                                                                                                                                  Meghalaya
                                                                     0
                                                                          45                                    50                                     55                                       60                                       65
                                                                                                                                        Microeconomic Competitiveness Score
                                                                      Source: Institute for Competitiveness Analysis
MANUFACTURING AND COMPETITIVENESS
                                                 50000
                                                                                                                                                                                          Goa


                                                 45000


                                                 40000
Manufacturing GSDP per capita in Rupees /Annum


                                                 35000


                                                 30000


                                                 25000

                                                                                                                                                                     Gujarat
                                                 20000
                                                                                                                                                                                           y = 966.5x - 47032
                                                                                                                                                                                                R² = 0.295
                                                                                                                                                                         Maharashtra       Haryana
                                                 15000

                                                                                                                                                                    Tamil Nadu
                                                                                                                     Chhattisgarh                                          Karnataka                            Delhi
                                                 10000                                                       Jharkhand                                                                    Punjab

                                                                                                                                                           Himachal Pradesh      Andhra Pradesh
                                                                                                             Orissa                                   Uttarakhand
                                                                                                                                                 Kerala
                                                                                                                           West Bengal   Rajasthan
                                                  5000         Jammu and Kashmir                             Assam
                                                                                                          Uttar Pradesh
                                                                                                              Meghalaya
                                                                            Manipur                                            Madhya Pradesh
                                                                   Nagaland Tripura                                 Sikkim                             Bihar
                                                                                      Arunachal Pradesh            Mizoram
                                                     0
                                                         45                                50                                       55                                    60                               65

                                                                                                            Microeconomic Competitiveness Score
                                                     Source: Institute for Competitiveness Analysis
SERVICES AND COMPETITIVENESS
                                            90000
                                                                                                                                                                                      Delhi


                                            80000


                                            70000
Services GSDP per capita in Rupees /Annum


                                            60000                                                                                                                  Goa


                                            50000                                                                                                                     y = 2177.x - 97702
                                                                                                                                                  Maharashtra              R² = 0.463
                                                                                                                                                                      Haryana
                                            40000                                                                              Kerala


                                                                                                                                                                        Punjab
                                                                                                                                              Tamil Nadu
                                            30000                                                                                                    Karnataka
                                                                                                 Mizoram                                        Gujarat
                                                                                                                                                              Andhra Pradesh
                                                                                                    Sikkim      West Bengal
                                                            Nagaland                                                                Uttarakhand
                                                                       Tripura                                                                     Himachal Pradesh
                                            20000                          Arunachal Pradesh   Meghalaya
                                                                                               Orissa
                                                                                               Assam
                                                           Jammu and Kashmir                        Chhattisgarh   Rajasthan

                                                                Manipur                                         Madhya Pradesh
                                                                                                Uttar Pradesh
                                            10000                                          Jharkhand
                                                                                                                           Bihar


                                                0
                                                    45                          50                                 55                               60                              65        70

                                                                                                    Microeconomic Competitiveness Score
                                               Source: Institute for Competitiveness Analysis
HOUSEHOLDS IN INDIA

                                       Households in India (in Millions) 2001 and 2011


                                                                                                                                                                                  32.92


                                                                                                  23.83
     21.02                                                                                                                                                                                        20.07
                        18.94                                                                                                                                    18.49
                                                                                                                                                                                  25.76
                                                                             13.18        14.97
                                             12.18                                                19.06                                           12.58
     16.85                                                                                                                          9.66                                                          15.72
                                                                      7.72                                                                                       14.17
                  6.37 13.98 5.62                          6.18            10.92                           0.51 0.54 0.22 0.40      5.41
             0.26                 0.32 9.64 4.72 1.48 2.02      10.23                                                                    9.34             0.13             0.84            2.00
                              4.15 0.28                               6.60                                                     7.87
              0.21 4.94                    3.53 1.24 1.55 4.86                                             0.40 0.42 0.16 0.33      4.27                  0.10           0.66             1.59


                                            Percentage of Households in India 2001 and 2011 having electricity


                                     96.9               96.8                                                                               96.6
                                            90.4 90.5          85.1          90.6 94.4            83.9                                                    92.5 93.4
   92.2                                                                                                                 84.2 81.6
                                                                                          67.1                                                                                              87
          65.7                75.3                                                                        68.4                                     67
                                     93.6               94.8                                                     60.9                      91.9                           68.4
                                            80.4 82.9          80.7          78.6                                                                         77.8 78.2                               54.5
   67.2                                                               45.8           70.2 70.0 77.5                     69.6 63.6   43                                            36.8 60.3
          54.7 37.1           53.1                                                                        60.0                                    54.7
                       16.4                                                                                      42.7                                                     41.8                    37.5
                 24.9 10.3                                                                                                          26.9                                          31.9
                                                                      24.3


    Percentage of Households having electricity in India 2001                               Percentage of Households having electricity in India 2011

  Source: Census of India,2011 Institute for Competitiveness Analysis
ACCESS TO WATER

                                     100            3.4                             0.9                                                                                                                                  3.2
                                                           2          3.1                  1.7                                                            1.8    3.4           2.3     2     2.6    2.2    3.2    3.5                  2.4
                                                                6.7                         3                                        5.1                                5.2                                               0.1   4.4
                                                    0.7                                           14.1                                                                                              5.7
                                                    3.6                      11.1   2.9                                                            11.3          3.5           7.2    7.6                                 0.3   3.7
                                                                2                                                                                                                            9.6           6.9                         8.2
                                             16.7   2.9                                                  15.8                                                                                                            11.1   0.5
                                      90                              12.9                        0             20.6                                      16.7                                                    16
                                                    89.5 21.9                                                                        16.3                                                           9.9                                4.6
                                                                                                   0.6                                      29.9                        20
                                                                                                         2.4                                       9.2                                                     13.7
                                              1.5                            12.2                 85.3
                                                                                                  0                           34.8                                                           11.6                        85.4          5.1
                                      80                        22
                                                                      12                                 10.7   4.5    47.2                                                                                       5.5                  79.8
                                             11.4                                                                                                                                                   14.4
                                                                                                                2.2
Percentage by source of households


                                                                                                                                                                                             7.1           6.4
                                                                                                                                                                 43.8                                              9
                                      70                        1.1
                                                                     3
                                                                                                         5.7                         18.1    2.6
                                              6.5                                                                             0.9            2.8                                      47.1   69            69.9
                                                                    68.8
                                                          24.7 68.2      25.3 64.9                                            0.8                                                                   67.9
                                                                                                                                                                                                                  66.1
                                                                                                         65.5                 4.7                                              58.4
                                      60     63.9                                                               25.7                                                                                                            62
                                                                                                                              58.7                        50.1
                                                                                                                                                   50.2                 41.5
                                                                                           86.6                         0.4                 25.4
                                      50                  0.5
                                                                                                                        6.5
                                                          51                                                                         27.4
                                                                             10.8
                                                                                                                47.2
                                                                                                                        7.5
                                      40
                                                                             40.6                                                           39.3
                                                                                                                       38.6
                                                                                                                                                                                      20
                                      30                                                                                             33.2                        36.5
                                                                                     4                                                                     6
                                                                                                                                                                               11.4                                             29.3
                                                                                    27.3                                                                                19.5
                                                                                                                                                          25.4
                                      20                                                                                                           18.9                               23.4
                                                                                                                                                                               20.7

                                      10                                                                                                                         12.9 13.8
                                                                                           4.3                                                     10.5

                                       0                                                   4.4


                                                    Tap water               Well           Handpump                   Tubewell              Tank, Pond, Lake, River, Spring, Canal and any other source


                                           Source: Census of India,2011 Institute for Competitiveness Analysis
EXPORT COMPETITIVENESS

                                                                                                                      160,000
     Madhya Share of Exports from various states in 2010-11                                                                                Value of Exports from various states
     Pradesh
        1%     Goa                                                                                                    140,000
               1%
     Punjab
       2%
                        Rest of the                                                                                   120,000
  Rajasthan               states                                                                                                        53788
     2%                    11%                                                                                                  61694
         Delhi


                                                                                     Exports in Millions of Dollars
           2%                                             Gujarat                                                     100,000
         Kerala                                            25%
          3%
Odisha
 3%                                                                                                                    80,000
West Bengal
    3%                                                                                                                                  43356
                                                                                                                       60,000   38775
Uttar Pradesh                                             Maharashtra
     3%                                                      21%
       Haryana                                                                                                                                  23378
          3%                            Tamil Nadu                                                                     40,000           44667
                                           9%                                                                                   40272
     Andhra Pradesh
                                                                                                                                                16085 13603 12567
          5%
                                                                                                                       20,000
                  Karnataka                                                                                                                             9093             8208
                                                                                                                                                18540         8559 8584       7111 6990 6547
                     5%                                                                                                                                                  5524
                                                                                                                                                        12296 9897 5679       4197      5843
                                                                                                                                                                                   3230
                                                                                                                                                                    4792 7571 5583 3351 4753
                                                                                                                           0


                                                                                                                                           2008-09        2009-10   2010-11
                  Source: Economic Survey of India 2011, Institute for Competitiveness Analysis
COUNTRY EQUIVALENTS


             BAHA                                            CUBA
             MAS


  Source: EIU 2011, Institute for Competitiveness Analysis
EXPORTS FROM THE TOP 15 STATES PERCENTAGE OF THE TOTAL


                                                   Jammu and Kashmir


                                                          Himachal Pradesh
                                   Pakistan                                         China
                                                     Punjab     Uttarakhand
                                                     1.6
                                                      Haryana
                                                        3.4 Delhi                                             Arunachal Pradesh
                                                                            Nepal
                                                            2.4
                                                              Uttar Pradesh                  Sikkim
                                              Rajasthan            3.3
                                                2.1                                                       Assam Nagaland
                                                                                     Bihar            Meghalaya
                                                                                                               Manipur
                                                                                                          Tripura
                                     Gujarat                                    Jharkhand                     Mizoram
                                      24.6              Madhya Pradesh                West Bengal
                                                           1.2                            2.8
                                                                     Chhattisgarh

                                                                               Odisha
                                                                                2.8
                                                  Maharashtra
                                                   21.4                                      Bay of Bengal
                            Arabian Sea

                                                              Andhra Pradesh
                                                                 5.0
                                               Goa
                                              0.7
                                                  Karnataka
                                                    5.4


                                                          Tamil Nadu
                                                     Kerala 9.3
                                                       2.6


                                                                   Sri Lanka
                                                Indian Ocean


  Source: Institute for Competitiveness Analysis
NUMBER OF PPP PROJECTS IN INDIA


                                                    Jammu and Kashmir
                                                         3


                                                       Himachal Pradesh
                                   Pakistan                 1                           China
                                                     Punjab Uttarakhand
                                                     35
                                                                 21
                                                      Haryana
                                                       40
                                                          15 Delhi              Nepal                            Arunachal Pradesh
                                                                                                 Sikkim           7
                                                                Uttar Pradesh                    31
                                              Rajasthan             22
                                                                                                      Assam Nagaland
                                                                                                               0
                                                67                                                       7
                                                                                         Bihar    Meghalaya
                                                                                                    2
                                                                                         18                  Manipur
                                                                                                             0
                                                                                                     Tripura
                                     Gujarat                                      Jharkhand           0 Mizoram
                                      74                  Madhya Pradesh            11 West Bengal         0
                                                             88                             36
                                                                       Chhattisgarh
                                                                          4
                                                                                 Odisha
                                                                                   33
                                                  Maharashtra
                                                    88
                                                                                                 Bay of Bengal
                            Arabian Sea

                                                              Andhra Pradesh
                                               Goa               100
                                                2
                                                  Karnataka
                                                    108


                                                          Tamil Nadu
                                                     Kerala 52
                                                       33


                                                                   Sri Lanka
                                                Indian Ocean


  Source: Institute for Competitiveness Analysis
POPULATION PERCENTAGES IN STATES


                                                    Jammu and Kashmir
                                                        1.04


                                                        Himachal Pradesh
                                   Pakistan                  0.57                   China
                                                      Punjab Uttarakhand
                                                      2.29
                                                                   0.84
                                                       Haryana
                                                        2.09
                                                               Delhi          Nepal                            Arunachal Pradesh
                                                              1.38                           Sikkim          0.11
                                                                Uttar Pradesh
                                              Rajasthan              16.49                                     Nagaland
                                               5.67                                                    Assam 0.16
                                                                                                          2.58
                                                                                     Bihar        Meghalaya
                                                                                                   0.24
                                                                                     8.58                    Manipur
                                                                                                            0.22
                                                                                                      Tripura
                                     Gujarat                                     Jharkhand          0.30 Mizoram
                                     4.99                Madhya Pradesh           2.72 West Bengal        0.09
                                                            6.00                         7.55
                                                                      Chhattisgarh
                                                                        2.11
                                                                               Odisha
                                                                                3.47
                                                  Maharashtra
                                                   9.29                                      Bay of Bengal
                            Arabian Sea

                                                              Andhra Pradesh
                                               Goa              7.00
                                              0.12
                                                  Karnataka
                                                   5.05


                                                          Tamil Nadu
                                                     Kerala 5.96
                                                      2.76


                                                                   Sri Lanka
                                                Indian Ocean


  Source: Institute for Competitiveness Analysis
PROSPERITY IN INDIA


                                                         Jammu and Kashmir
                                                             474

                                                                Himachal Pradesh
                                        Pakistan                  872                         China
                                                           Punjab Uttarakhand
                                                           821
                                                                      650
                                                             1056
                                                            Haryana
                                                             1652 Delhi                                                  Arunachal Pradesh
                                                                                      Nepal            669               553
                                                                     Uttar Pradesh                     Sikkim
                                                   Rajasthan             320
                                                    494                                                    Assam Nagaland
                                                                                                             396
                                                                                               Bihar   Meghalaya 378
                                                                                                        571
                                                                                               254               Manipur
                                                                                                                 394
                                           Gujarat                                     Jharkhand         Tripura
                                                                                                               Mizoram
                                           941                 Madhya Pradesh           404 West Bengal 544 529
                                                                   377                           615
                                                                            Chhattisgarh
                                                                             534
                                                                                        Odisha
                                                        Maharashtra                      487
                                                         945
                                                                                                       Bay of Bengal
                                Arabian Sea

                                                                  Andhra Pradesh
                                                    Goa              698
                                                   1788
                                                      Karnataka
                                                        713


                                                               Tamil Nadu
                                                           Kerala 801
                                                            933


                                                                         Sri Lanka
                                                     Indian Ocean

                   All the figures are in dollars, The exchange rate taken for arriving at the figures was 1 US$ = 49 Rupees


   Source: Institute for Competitiveness Analysis
STATE OF INDUSTRIES

10000000
                                                 Andhra Pradesh               West Bengal                                                            Uttar Pradesh
                                                                                            Gujarat      Karnataka                                                            Maharashtra
                                   Delhi                          Kerala
                                                                                                      Rajasthan                       Tamil Nadu
                                                 Orissa                                                                      Punjab
                             Bihar
                               Assam                                       Madhya Pradesh                  Haryana
1000000                   Jharkhand
                                                  Jammu & Kashmir
                Chhattisgarh

               Tripura                 Uttarakhand
                Meghalaya
                                Goa
                                                                                                                                                         All India Average of


                                                                                    India
                                                                                    All
               Manipur
  100000         Sikkim                    Himachal Pradesh                All India Average                                                             18,54,826 people
               Nagaland
               Arunachal Pradesh                                           23816.62 Crores                                                               employed/ state
                  Mizoram

   10000


    1000


     100


      10


       1
           0                                      20000                               40000                          60000                   80000                   100000                 120000

                                                                                                      Contribution in Rs Crores

    Source: MSME , Institute for Competitiveness Analysis
CONTRIBUTION PER PERSON IN INDUSTRIES


                                  7.00


                                  6.00                                                                                                                                                       5.75
Contribution in Lakhs of Rupees


                                  5.00


                                  4.00   3.79 3.88
                                                     3.56
                                                            3.34
                                                                                        2.96                               Average
                                  3.00                                                                                  Contribution of                                                                                                2.76
                                                                                                                             1.57                                                                   2.27
                                                                                                                         Lakhs/Person              1.98
                                  2.00                                    1.77                                                                                                        1.72
                                                                   1.41                                                              1.37                                      1.26                                      1.20
                                  1.00                                                                0.76                                                                                                 0.76                 0.81
                                                                                                             0.51 0.55 0.43                               0.62          0.62
                                                                                 0.30          0.36                           0.35                                                                                0.25
                                                                                                                                            0.14                 0.20
                                  0.00


                                  Source: MSME 4th round , Institute for Competitiveness Analysis
PER UNIT EMPLOYMENT VERSUS PER UNIT GROSS OUTPUT


               45.00
               40.00
               35.00
                                                                            Per unit employment (Person)
                30.00
                25.00
                                                                            Per unit Gross Output (in Lakhs of
                20.00                                                       Rupees)
                15.00
                10.00
                  5.00
                  0.00

                                  Manufacturing
                                                              Services


                                                                         Manufacturing       Services

Per unit employment (Person)                                             4.57                1.54

Per unit Gross Output (in Lakhs of Rupees)                               41.19               1.94

Per unit revenues/ per unit employment                                   9.01                1.26
       Source: MSME, Institute for Competitiveness Analysis
MARKET VALUE VERSUS ORIGINAL VALUE OF PLANT AND EQUIPMENT


           1800.00
           1600.00
           1400.00                                                      Market value of Fixed Investments in Crores of
           1200.00                                                      Rupees

            1000.00
             800.00
             600.00                                                     Original value of Plant and Machinery/ Equipment
             400.00                                                     in Crores of Rupees

              200.00
                0.00

                            Manufacturing
                                                             Services


                                                                                 Manufacturing        Services

Market value of Fixed Investments in Crores of Rupees                            1778.91              153.58

Original value of Plant and Machinery/ Equipment in Crores of Rupees             508.10               49.92

No of times valued by the market                                                 3.50                 3.08

      Source: MSME, Institute for Competitiveness Analysis
STATE OF CLUSTER DEVELOPMENT: TOTAL NUMBER OF FACTORIES


                     Agricultural                                                                                                       Glass and
                                                                                                       Furniture                          related
                      services
                                                                                                                                        industries
  Wood and
                                           Agricultural                              Domestic
   Forest
                                            Products                                and electric                     Television
  Products
                                                                                     Industries                      and allied
                                                                                                                     electronic
                                                                  Other                                              industries                           Other
                   Processed                                     Service                            Lighting                                           transportat
                     food                                      Industries                           Electric                                               ion
                                          Publishing                                               equipment
                                             and
                                           Printing                              Medical                                          Machinery
                                                                                equipment                                            and
                                                                                                                                  Equipment
                                                                                                                                                     Automotiv
                                                                                                                                                         e
                                                   Pulp and
      Apparels           Textiles                   Paper
    and related
     industries                                                         Chemicals                                                      Production
                                                                                                    Tobacco

                                                                                                                                                                 Minerals

                               Footwear                                        Rubber and
       Leather                                            Oil and Gas             Plastic                               Metals
      industries                                                                Industries                                                            Mining


             Top 7 types of Industries in the state                                                                15-21 types of Industries in the state
             7-14 types of Industries in the state                                                                 21-28 types of Industries in state
   Source: ASI 2008-09, Institute for Competitiveness Analysis
STATE OF CLUSTER DEVELOPMENT: TOTAL NUMBER OF EMPLOYEES


                   Agricultural                                                                                                  Glass and
                                                                                                     Furniture                     related
                    services
                                                                                                                                 industries
Wood and
                                         Agricultural                              Domestic
 Forest
                                          Products                                and electric                   Television
Products
                                                                                   Industries                    and allied
                                                                                                                 electronic
                                                                Other                                            industries                        Other
                 Processed                                     Service                            Lighting                                      transportat
                   food                                      Industries                           Electric                                          ion
                                        Publishing                                               equipment
                                           and
                                         Printing                              Medical                                    Machinery
                                                                              equipment                                      and
                                                                                                                          Equipment
                                                                                                                                              Automotiv
                                                                                                                                                  e
                                                 Pulp and
    Apparels           Textiles                   Paper
  and related
   industries
                                                                      Chemicals                                                 Production
                                                                                                  Tobacco

                                                                                                                                                          Minerals

                             Footwear                                        Rubber and
     Leather                                            Oil and Gas             Plastic                             Metals
    industries                                                                Industries                                                       Mining


                 Top 7 types of Industries in the state                                                            15-21 types of Industries in the state
                  7-14 types of Industries in the state                                                            21-28 types of Industries in state
       Source: ASI 2008-09, Institute for Competitiveness Analysis
STATE OF CLUSTER DEVELOPMENT: TOTAL NUMBER OF PEOPLE

                                       0
                Glass Industries       0
                                       0
                       Minerals        0
                                       0
Domestic and electric industries       0
                                       0
                      Furniture        0.019
                                       0.078
             Leather Industries        0.094
                                       0.214
                      Chemical         0.215
                                       0.277
                       Tobacco         0.32
                                        0.64
                Pulp and Paper          0.726
                                        0.756
                      Footwear          0.833
                                         0.956
           Agriculture Products          1.208
                                           2.161
                        Textiles             3.314
                                               4.878
            Agriculture services                          14.661
                                                           15.361
        Other service industries                           15.469
                                                            16.51
               Food Processing                                                                    75.265

                                   0              10         20     30   40   50   60   70           80

                                                                                             Thousands
    Source: ASI, Institute for Competitiveness Analysis
CREATING A STATE ECONOMIC STRATEGY


                               State Value Proposition

               What are the main strengths, positive attributes, location
               advantage etc of the particular state in question.


     Developing Unique Strengths                   Achieving and Maintaining parity
                                                              with peers
• How can the state leverage on its              • What are the key weaknesses
  unique capabilities and create new               which need to be taken care of
  ones?                                            while forming maintaining parity
• Which businesses/ clusters can be                with peers?
  made stronger?


State economic strategy requires setting clear priorities and measuring against
predefined criteria.
COMPETITION AMONG STATES


               Tactical (Zero Sum                          Strategic (Positive
                 Competition)                              Sum Competition)

     • Focus on FDI investments               • Focus on domestic and existing
     • Compete in every domain                  companies
                                              • Compete in specialized cluster domains
     • Offer tax benefits across the
                                              • Government incentives and support for
         spectrum                               training, infrastructure, and institutions
     • Provide subsidies to lower / offset    • Improve the efficiency of doing
         business costs                         business
                                              • Economies of scale to help benefit from
     • Every city and sub-region for itself
                                                multiple geographies
     • Government is responsible for          • Government and the private sector
       development of cluster.                  collaborate to build cluster strength


Source: Michael E Porter
HOW SHOULD STATES COMPETE WITH EACH OTHER


                     Old Model                             New Model

                                                 • Economic development is a
     • Government drives economic                  collaborative process involving
       development through policy                  government at multiple
       decisions and incentives                    levels, companies, teaching and
                                                   research institutions, and private
                                                   sector organizations


     Competitiveness is the result of both top-down and bottom-up processes in
     which many companies and institutions take responsibility


Source: Michael E Porter
COMPETITION AMONG STATES


• The purpose of a sound economic policy is to increase the overall prosperity in
   the state and for that the states should focus on increasing their competitiveness.
• Improvements and productivity and technological advancement are the guiding
   principles in this regard.
• Competitiveness requires a fundamental rethinking of usage of your existing
   resources.
• For government has to fundamentally rethink its role, it should try to foster a spirit
   of entrepreneurship in the private sector.
• The criteria for judging the merits and demerits of an economic policy should be
   by outcomes and not political philosophy.
• The prosperity of India will depend largely on the states and not just the (Center)
   Delhi.
INTERPRETATION CHARTS
•   The snapshot chart summarizes the relative performance of a state on levels and trends in 5 key
    measures. The circles in the chart show the measurement of the chart legend.
•   Prosperity: State GDP per capita and 10 year trend.
•   Productivity: Average Private wage and 10 year trend.
•   Labour Mobilization: Total labour force as a share of civilian population and 10 year trend.
•   Clusters: Total number of people employed in the cluster and total number of enterprises in the cluster.
•   Type of Economy: Factor Driven economies, Changeover economies, Investment driven
    economies, Transition economies, Innovation driven economies and city state economies.
                                                      Position                        Trend
      Prosperity


      Productivity

      Labour Mobilization

      State of Clusters
                                                                                                   Top 33.33% of the
                                                                                                   states
      Type of Economy                              Investment Driven
                                                                                                   33.33%-66.67% of
                                                                                                   the states
                                                   Mining
      Leading Clusters                             Wood and forest products
                                                   Agricultural Products                           66.67% to 100% of
                                                   Lighting and Electric Industries                the states
STATE OF CLUSTER DEVELOPMENT : FACTORIES


                                                              Agricultur
                                                                                                                                                                            Glass and
                                                                  al                                                                         Furniture
                                                                                                                                                                              related
                                                               services
                                                                                                                                                                            industries


                                           Wood
                                            and                                    Agricultur                               Domestic
                                           Forest                                      al                                       and
                                          Products                                 Products                                   electric
                                                                                                                                                         Television
The Chart represents the number                                                                                             Industries
                                                                                                                                                         and allied
                                                                                                                                                         electronic
of factories in various types of                                                                                                                         industries
                                                                                                                                                                                             Other
                                                                                                           Other
Industries in state.                                       Processe                                       Service                         Lighting
                                                                                                                                                                                           transport
                                                                                                                                                                                             ation
                                                            d food                                      Industries                        Electric
                                                                                                                                         equipmen
                                                                                                                                              t
The position of the various types                                                Publishin
                                                                                  g and

of factories shows relative                                                      Printing
                                                                                                                         Medical                                      Machiner
                                                                                                                                                                        y and
                                                                                                                        equipmen
proximity in terms of type of                                                                                               t                                         Equipmen
                                                                                                                                                                           t

Industry. Thus, Chemical is placed                                                                                                                                                       Automoti
                                                                                                                                                                                            ve
next to Oil and gas, etc.                                                                    Pulp and
                                                                                              Paper
                                             Apparels           Textiles
                                                and
The colour coding is done to                  related
                                            industries
                                                                                                                Chemicals                                                  Productio
show the importance of factory                                                                                                           Tobacco                               n

sector in terms of number of                                                                                                                                                                        Minerals
enterprises in the state. Thus
yellow shows the maximum                       Leather
                                                                      Footwear                      Oil and
                                                                                                     Gas
                                                                                                                          Rubber
                                                                                                                           and                              Metals
                                              industries                                                                  Plastic
number of industries in the state.                                                                                      Industries                                                       Mining


                             Top 7 types of Industries in the state                                                              15-21 types of Industries in the state
                              7-14 types of Industries in the state                                                               21-28 types of Industries in the state
STATE OF CLUSTER DEVELOPMENT : EMPLOYEES


                                                            Agricultu                                                                                                    Glass and
                                                               ral                                                                        Furniture                       related
                                                            services                                                                                                     industrie
                                                                                                                                                                             s


                                          Wood                                                                            Domestic
                                           and                                   Agricultu                                   and
                                          Forest                                    ral                                                               Televisio
                                                                                                                           electric
                                         Products                                Products                                                               n and
                                                                                                                          Industrie
The Chart represents the number of                                                                                            s
                                                                                                                                                        allied
                                                                                                                                                      electroni
                                                                                                                                                           c
Employees in various types of                                                                                                                         industrie
                                                                                                        Other                                              s                             Other
Industries in state.                                     Processe
                                                                                                       Service
                                                                                                      Industrie                       Lighting
                                                                                                                                                                                       transport
                                                                                                                                                                                         ation
                                                          d food                                          s                            Electric
                                                                                                                                      equipme
                                                                                                                                          nt
The position of the various types of                                           Publishin
                                                                                g and
industries shows relative proximity                                            Printing
                                                                                                                        Medical                                   Machiner
                                                                                                                        equipme                                    y and
in terms of type of Industry.                                                                                              nt                                     Equipme
                                                                                                                                                                     nt
Thus, Chemical is placed next to Oil                                                                                                                                                 Automoti

and gas. etc.                                                                                                                                                                           ve

                                                                                           Pulp and
                                                                                            Paper
                                            Apparels          Textiles
                                               and
The colour coding is done to show            related
                                            industrie
the importance of Industries in                 s                                                            Chemical
                                                                                                                s
                                                                                                                                                                        Productio
                                                                                                                                                                            n
                                                                                                                                      Tobacco
terms of number of employees in
the state. Thus yellow shows the                                                                                                                                                                Minerals


bracket of maximum number of                  Leather               Footwear                      Oil and
                                                                                                                         Rubber
                                                                                                                           and                           Metals
employees in the state.                      industrie
                                                 s
                                                                                                   Gas                   Plastic
                                                                                                                        Industrie
                                                                                                                            s                                                        Mining


                              Top 7 ranked types of Factories in the state                                                    15-21 ranked types of Factories in the state

                              7-14 ranked types of Factories in the state                                                      21-28 ranked types of Factories in the state
COMPONENTS OF REGIONAL ECONOMIES


                  •        The economy has been looked at from the primary, secondary and tertiary Perspective. These sectors
                           are then looked in detail to find the contribution of each sub sector to the three primary sectors namely
                           Agriculture, Industry and Services.
                  •        The result is a bubble chart which shows the contribution of each sub sector to the economy.
                  •        The size of the bubble represents the size of the GSDP contribution in Rs. Crores.


                                                                                                                 18
                                                                                                                 16
                                                              Chhattisgarh/National GSDP share (Percent) ,2011


                                                                                                                 14                                           Mining and quarrying

The regions share of                                                                                             12
cluster GSDP relative to
its size
                                                                                                                 10
                                      Strong and
                                   Growing Position                                                              8
                                                                                                                                                                Electricity, gas and water
                                                                                                                 6                                                         supply

                                                                                                                 4
                                                                                                                              Forestry and logging                                   Manufacturing
                                                                                                                                      Railways Other services administration and                          Construction
                                                                                                                 2                                         Public
                                                                                                                                   Real states, ownership of Fishing
                                                                                                                                                Agricuture Trade, hotel and restaurant
                                                                                                                                                                  Transport by other means
                                                                                                                                                                     defence
                                                                                                                               Storage               Communication
                                                                                                                                    dwellingsBanking and insurance
                                                                                                                                               and business
                                         Cluster is growing                                                      0                          services
                                         faster than Indian
                                         Average                                                                 -2 0          5                   10                   15                   20      25                  30   35

                                                                                                                        Change in contribution of GSDP of Chhattisgarh to total Indian GSDP, CAGR (2000-2011)
EMPLOYMENT BY A CLUSTER

                                                      Apparels and related Industries       0
                                                                       Glass Industries     0
•   Clusters   are     geographically   proximate                           Production      0
                                                                               Minerals     0
    groups of interconnected companies and                                       Metals     0
                                                      Domestic and electric industries      0
    associated institutions in a particular field.         Machinery and equipment          0
                                                                              Furniture     0.019
    Examples         include    chemical      and                          Oil and Gas      0.078
                                                                    Leather Industries      0.094
    pharmaceutical clusters in Gujarat and                     Printing and Publishing      0.214
                                                                              Chemical      0.215
    apparel and diamond cluster in Surat.
                                                       Television and allied electronic …   0.277
    Clusters and sub clusters taken for the study                              Tobacco      0.32
                                                                           Automotive       0.64
    are taken at the end of this report.                               Pulp and Paper       0.726
                                                                 Other transportation       0.756
                                                                              Footwear      0.833
                                                                               Medical      0.956
•   Employment by cluster gives a more                            Agriculture Products       1.208
                                                                                 Mining      2.161
    detailed profile of the activities in the state                             Textiles      3.314
                                                      Lighting and electric equipment          4.878
    economy that make up the Job Base. It can                      Agriculture services             14.661
                                                         Rubber and Plastic Industries               15.361
    be used to understand the importance of
                                                              Other service industries               15.469
    the health of various groups of Industries on           Wood and forest Products                 16.51
                                                                      Food Processing                                      75.265
    the overall prosperity of the region.                                               0          20         40   60      80

                                                                                                                   Thousands
A BRIEF NOTE OF THE REGIONS AND OVERALL ECONOMY OF CHHATTISGARH


 •    The political boundaries of a state often encompass many distinct regional economies or portions of
      large regional economies. A comprehensive approach to economic development should reflect both
      the distinct economies within the state as well as strong linkages to the economies in the neighboring
      states. In addition to this clusters should be mapped on areas of high economic growth. This will lead
      to spillover effects in the long run.
                                                                     3000000
 •    A state's or region’s economy can be divided                                                                               2549085
      into 3 components namely                                       2500000


                                                                     2000000


                                                 GSDP in Rs. Crore
                                                                                                               1492375
                                                                     1500000
 1.   Primary/Agriculture sector
 2.   Secondary/Industry sector                                      1000000               924340

 3.   Tertiary/Service sector
                                                                     500000

                                                                                 16820                 53614             33176
                                                                           0
                                                                               Agriculture, forestry      Industry          Services
                                                                                    and fishing


      In this report we focus more on Industrial sector to bring out its components in detail.
CLUSTERS AND SUB CLUSTERS IN THE INDIAN ECONOMY
Agricultural products                                        Leather industries                                          Other transportation
•    Grain mill products, starches & starch products         •   Tanning & dressing of leather; luggage, handbags        •     Other transport equipment
    and prepared animal foods                                                                                            •     Railway and tramway locomotives and rolling stock
•    Other food products                                     Lighting electric equipment                                 •     Transport equipment
•    Beverages
                                                             •   Insulated wire and cable                                Processed food
Apparels and related industries                              •   Accumulators, primary cells and primary batteries
                                                                                                                         •    Manufacture of food products and beverages
•    Knitted and crocheted fabrics and articles              •   Electric lamps and lighting equipment
                                                                                                                         •    Meat, fish, fruit vegetables, oils and fats
•    Wearing apparel; dressing and dyeing of fur             •   Other electrical equipment
                                                                                                                         •    Dairy product
•    Wearing apparel, except fur apparel
                                                             Machinery and equipment                                     Production
                                                             •   Structural metal products, tanks, reservoirs            •
Agricultural services                                        •   Other fabricated metal products
                                                                                                                              Manufacturing
•    Agriculture, hunting, and related services activities   •   Machinery and equipment
                                                             •   General purpose machinery                           Publishing and printing
Automotive                                                   •   Special purpose machinery                           •       Publishing
•    Bodies (coach work) for motor                                                                                   •       Printing and service activities related to printing
     vehicles                                                Medical equipment
•    Parts and accessories for                               •    Medical, precision and optical                     Rubber and plastic industries
     motor vehicles & their engines                              instruments, watches & clocks                       •       Rubber products
                                                                                                                     •       Plastic products
Chemicals                                                    Metals
•    Basic chemicals                                         •   Basic Iron & Steel
                                                             •   Basic precious and non-ferrous metals               Television and allied electronic industries
                                                             •   Casting of metals                                   •        Electronic valves and tubes
Domestic and electric Industries                                                                                             and other electronic components
•    Domestic appliances
•    Office, accounting and computing machinery
                                                             Minerals                                                •        Television and radio transmitters
                                                             •   Minerals                                                    and apparatus
•    Electrical machinery and apparatus                                                                              •        Television and radio receivers
•    Electric motors, generators and transformers
•
                                                             Mining
     Electricity distribution and control apparatus
                                                             •   Mining and quarrying                                Textiles
                                                                                                                     •       Spinning, weaving and finishing of textiles
Footwear                                                     Pulp and Paper                                          •       Other textiles
•    Footwear
                                                             •   Pulp and Paper Industries                           Tobacco
                                                                                                                     •       Tobacco products
Furniture                                                    Other service industries
•   Furniture                                                •   Other Service Industries                            Wood and forest products
                                                             Oil and gas                                             •       Wood and of products
Glass and related industries                                 •   Coke oven products                                  •       Saw milling and planning of wood
•    Glass and glass products                                •   Refined petroleum products                          •       Products of wood, cork, straw and plaiting materials

Chhattisgarh

  • 1.
    STATE PROFILES –CHHATTISGARH
  • 2.
    ECONOMIC CHALLENGE FORCHIEF MINISTERS IN 2012 Achieving Fiscal Stability Enhancing State Competitiveness • Competitiveness is the only way to achieve sustainable job growth, improving incomes and stable public finances • Creating a clear economic strategy for the state that engages all stakeholders is even more important in times of budget cutting and austerity
  • 3.
    HIERARCHY OF MEASUREMENTOF STATE COMPETITIVENESS INDEX 4 Major Pillars 12 Sub Indices 350* Indicators * Approximate figure
  • 4.
    STAGES OF THEECONOMY Innovation Driven Economies (Per capita GDP 900 to City States (Per capita GDP>1300 USD) 1300 USD) Transition Economies (Per capita GDP 800 to 900 USD) Investment Driven Economies (Per capita GDP 500 to 800 USD) Evolving / Changeover Economies (Per capita GDP 400 to 500 USD) Factor Driven Economies(Per capita GDP < 400 USD)
  • 5.
    STATES ACCORDING TOCATEGORIZATION Microeconomic Competitiveness Categorization Ranks City States (Per capita Incomes >1300 USD) Delhi 1 Goa 2 Innovation Driven Economies (Per capita Incomes 900 to1300 USD) Haryana 1 Maharashtra 2 Gujarat 3 Kerala 4 Transition Economies (Per capita Incomes 800 to 900 USD) Punjab 1 Tamil Nadu 2 Himachal Pradesh 3 Investment Driven Economies (Per capita Incomes 500 to 800 USD) Andhra Pradesh 1 Karnataka 2 Uttarakhand 3 West Bengal 4 Chhattisgarh 5 Sikkim 6 Mizoram 7 Meghalaya 8 Arunachal Pradesh 9 Tripura 10 Evolving/ Changeover Economies (Per capita Incomes 400 to 500 USD) Rajasthan 1 Jharkhand 2 Orissa 3 Jammu and Kashmir 4 Factor Driven Economies(Per capita Incomes < 500 USD) Bihar 1 Madhya Pradesh 2 Assam 3 Uttar Pradesh 4 Manipur 5 Nagaland 6 Source: Institute for Competitiveness Analysis
  • 6.
    NEAR TERM STATEPROSPERITY PERFORMANCE 9 Gross Domestic Product per Capita real growth rate, 2000-2011 Haryana Low but rising versus India Chhattisgarh Highly Productive and Prosperity Bihar Rising versus India Maharashtra 8 Himachal Pradesh Uttar Pradesh Andhra Pradesh Orissa 7 Karnataka Punjab Sikkim Uttarakhand Arunachal Pradesh Kerala Assam Gujarat Rajasthan Tripura 6 Tamil Nadu West Bengal Goa Points Index 57.28 Average All India Delhi Meghalaya All India GSDP Jharkhand /Capita rate Mizoram (CAGR) of 6.27 % 5 Manipur Madhya Jammu & Kashmir Pradesh All India Average 4 Nagaland of 47,998 Low and declining versus India Rupees/capita High but declining versus India 3 0 20000 40000 60000 80000 100000 120000 140000 Gross Domestic Product per Capita, 2011
  • 7.
    COMPETITIVENESS: UNDERLYING CONCEPTS • Competitiveness is the productivity with which a state utilizes its human, capital, and natural resources • Productivity determines wages and the standard of living – Productivity growth determines sustainable economic growth • Productivity depends on how a state competes, not what industries it competes in • Innovation in products and processes is necessary to drive productivity growth • Only productive businesses can create wealth and jobs. States compete to offer the most productive environment for business • The public and private sectors play different but interrelated roles in creating a productive economy
  • 8.
    CHHATTISGARH PERFORMANCE SNAPSHOT Position Trend Prosperity Productivity Labour Mobilization State of Clusters Type of Economy Investment Driven Top 33.33% of the states 33.33%-66.67% of Mining the states Leading Clusters Wood and forest products Agricultural Products 66.67% to 100% of Lighting and Electric Industries the states
  • 9.
    CHHATTISGARH COMPETITIVENESS –OVERALL PERFORMANCE INDICATORS Prosperity Clusters Gross State Domestic Product per Capita, 2011 Rank: 5 Total Number of People employed in all Factory sector Rank: 5 • In Chhattisgarh Rs. 42,744 • In Chhattisgarh 154518 • In India Rs. 47,998 • In India 1,15,06,838 • State Difference to India -10.95 %. • State Employment to total India Employment (factory sector) 1.34% Growth in Gross State Domestic Product per Capita, 2008-11 , (CAGR) Rank: 1 • In Chhattisgarh 8.30% • In India 6.28% Productivity Labour Mobilization Population, 2011 Rank: 4 Gross State Domestic Product per labour force participant, 2011 Rank: 5 • In Chhattisgarh 2,55,40,196 • In Chhattisgarh Rs 1,04,840 • % of India 4.98% • In India Rs 1,21,265 • State Difference to India -13.54% Population Growth, GAGR, 2001-2011 Rank: 4 • In Chhattisgarh 2.06% Growth in Gross State Domestic Product Rank: 1 • In India 1.61% per Labour force participant, 2001-11 • In Chhattisgarh 12.36% Employment, 2010 Rank: 4 • In India 8.44% • In Chhattisgarh 4185787 • % India 1.47% Average Private Wage in 2008-09, Rank: 3 • In Chhattisgarh Rs 71,771 Employment growth, annual rate, 2000-2010 Rank: 4 • In India Rs 64,741 • In Chhattisgarh 2.51% • State Difference to India 10.85.% • In India 2.05% Private Wage Growth, CAGR, 2000-2009 Rank:7 Unemployment, 2010 (Per hundred People) Rank: 10 • In Chhattisgarh 0.47% • In Chhattisgarh 3.40 • In India 4.53% • In India 9.39 Change in Unemployment rate, 2000-2010 Rank: 10 • In Chhattisgarh -49.25 • In India 41.37
  • 10.
    UNDERSTANDING STATE ECONOMICPERFORMANCE Chhattisgarh 120000 107848 GSDP at current price at factor cost in Rupees Crore 100000 103610 95204 80000 79419 64706 60000 50999 40000 43589 38802 32493 29539 27249 25846 20000 0 Dec-00 Dec-01 Dec-02 Dec-03 Dec-04 Dec-05 Dec-06 Dec-07 Dec-08 Dec-09 Dec-10 Dec-11 Source : Institute for Competitiveness Analysis
  • 11.
    CONTRIBUTION OF CHHATTISGARH’SGSDP TO INDIAN GSDP GSDP at current price at factor cost in Rupees Crore 6000000 5000000 4000000 3000000 2000000 1000000 0 Dec-00 Dec-01 Dec-02 Dec-03 Dec-04 Dec-05 Dec-06 Dec-07 Dec-08 Dec-09 Dec-10 Dec-11 Chhattisgarh's GDP Indian GDP Dec-00 Dec-01 Dec-02 Dec-03 Dec-04 Dec-05 Dec-06 Dec-07 Dec-08 Dec-09 Dec-10 Dec-11 Ratio of Chhattisgarh's GSDP to Indian 1.60 1.44 1.53 1.56 1.65 1.65 1.71 1.86 1.97 2.08 2.16 2.07 GDP in Percentage Terms Source : Institute for Competitiveness Analysis
  • 12.
    WHAT DRIVES STATEPRODUCTIVITY 3. Proper Policy 1. Overall business 2. Stage of Economy enactment and strong climate conducive to (strong clusters) rule of law growth
  • 13.
    MODEL USED FORANALYSIS Climate for Innovation based local rivalry • Local rules and incentives that encourage investment and productivity e.g. - salaries, Factor - incentives for capital investments, Demand Conditions - intellectual property protection Conditions • Vigorous local competition i.e., - Openness to foreign and local competition; - Sophistication of company operations Access to high quality business inputs i.e., Sophisticated and demanding local - Natural endowments, customers and needs e.g., - Human resources, - Strict quality, safety, and environmental - Capital availability, Clusters of Related standards - Physical infrastructure, and Supporting – Consumer protection laws - Administrative infrastructure, Industries – Government procurement of - Information infrastructure, advanced technology - Scientific and technological infrastructure – Early demand for products and Local availability of suppliers and supporting industries Services. Presence of clusters instead of isolated firms Source: Michael E Porter
  • 14.
    IMPROVING PRODUCTIVITY INBUSINESS ENVIRONMENT Key Issues for States • More power in terms of tax sharing with center • Reduce costs of doing business • Developing training programs which meet the specific needs of the state industrial clusters • Focus on infrastructure investments on the most leveraged areas for productivity and economic growth • Implementing policies to support small growth businesses • Enhancing the state’s skill development and training institutions for the same • Relentlessly improve of the public education system, the essential foundation
  • 15.
    GEOGRAPHIC INFLUENCES ONCOMPETITIVENESS • Influence and access federal Nation policies and programs • Integrate policies and Neighboring states infrastructure with neighbors States • Assist each city area in City Regions developing its own strategy • Connect rural regions with Rural Regions urban areas
  • 16.
    CONTRIBUTION OF AGRICULTURESECTOR TO GSDP 120000 GSDP at current price at factor cost in Rupees Crore 100000 80000 60000 40000 20000 0 Dec-00 Dec-01 Dec-02 Dec-03 Dec-04 Dec-05 Dec-06 Dec-07 Dec-08 Dec-09 Dec-10 Dec-11 Dec-00 Dec-01 Dec-02 Dec-03 Dec-04 Dec-05 Dec-06 Dec-07 Dec-08 Dec-09 Dec-10 Dec-11 Ratio of Agricultural GSDP in Chhattisgarh to 24.61 19.89 25.79 20.05 23.94 18.11 20.98 18.20 19.27 15.81 14.92 16.23 the total GSDP in Chhattisgarh in Percentage terms Source : Institute for Competitiveness Analysis
  • 17.
    CONTRIBUTION OF MANUFACTURINGSECTOR TO GSDP 120000 GSDP at current price at factor cost in Rupees Crore 100000 80000 60000 40000 20000 0 Dec-00 Dec-01 Dec-02 Dec-03 Dec-04 Dec-05 Dec-06 Dec-07 Dec-08 Dec-09 Dec-10 Dec-11 Dec-00 Dec-01 Dec-02 Dec-03 Dec-04 Dec-05 Dec-06 Dec-07 Dec-08 Dec-09 Dec-10 Dec-11 Ratio of Manufacturing GSDP in Chhattisgarh to 14.00 14.72 12.64 15.23 17.98 24.08 18.03 23.16 22.74 22.06 21.16 22.58 the total GSDP in Chhattisgarh in Percentage terms Source : Institute for Competitiveness Analysis
  • 18.
    CONTRIBUTION OF SERVICESECTOR TO GSDP 120000 GSDP at current price at factor cost in Rupees Crore 100000 80000 60000 40000 20000 0 Dec-00 Dec-01 Dec-02 Dec-03 Dec-04 Dec-05 Dec-06 Dec-07 Dec-08 Dec-09 Dec-10 Dec-11 Dec-00 Dec-01 Dec-02 Dec-03 Dec-04 Dec-05 Dec-06 Dec-07 Dec-08 Dec-09 Dec-10 Dec-11 Ratio of Services GSDP in Chhattisgarh to the total 39.59 42.87 41.96 40.24 37.43 37.19 35.66 33.20 32.10 31.89 32.82 32.02 GSDP in Chhattisgarh in Percentage terms Source : Institute for Competitiveness Analysis
  • 19.
    COMPOSITION OF CHHATTISGARH’SECONOMY Agriculture, forestry Services and fishing 32% 16% Industry 52% Source : Institute for Competitiveness Analysis
  • 20.
    COMPOSITION OF CHHATTISGARH’SECONOMY 3000000 2549085 2500000 GSDP in Rs. Crore 2000000 1492375 1500000 1000000 924340 500000 16820 53614 33176 0 Agriculture, forestry and fishing Industry Services Indian contribution Chhattisgarh’s contribution Source : Institute for Competitiveness Analysis
  • 21.
    COMPOSITION OF CHHATTISGARH’SECONOMY IN GREATER DEPTH 18 16 14 Mining and quarrying Chhattisgarh /National GSDP share (Percent) ,2011 12 10 8 6 Electricity, gas and water supply 4 Manufacturing Forestry and logging Construction Railways 2 Other services Fishing Agricuture Public administration and defence Trade, hotel and restaurant means Transport by other Real states, ownership of dwellings and Communication Storage business services and insurance Banking 0 0 5 10 15 20 25 30 35 -2 Change in contribution of GSDP of Chhattisgarh to total Indian GSDP, CAGR (2000-2011)
  • 22.
    STATE PRIVATE WAGEPERFORMANCE 160000 140000 Jharkhand Wage Growth rate 4.53% Average Wages in Rupees ,2009 120000 Uttaranchal Orissa 100000 Maharashtra Goa Average Wage : Rupees 64,741 80000 Chhattisgarh West Bengal Madhya Pradesh Haryana Karnataka Gujarat Meghalaya Delhi Himachal Pradesh Uttar Pradesh 60000 Andhra Pradesh Punjab Tamil Nadu Kerala Rajasthan Jammu & Kashmir Bihar Assam 40000 Manipur Tripura Nagaland 20000 Low and declining versus India Low but rising versus India 0 0 2 4 6 8 10 12 14 Wage Growth (CAGR), 2001 to 2008 Source : Institute for Competitiveness Analysis, Data as of 2010
  • 23.
    LABOUR PRODUCTIVITY 400000 GSDP at Current Prices per labour force participant, 2011 Goa 350000 High but declining versus India Highly productive and Productivity rising versus India 300000 Points Index 57.28 e Averag India All Delhi All India Average of 250000 8.44% Haryana 200000 All India Average of of Punjab Maharashtra Kerala Gujarat 1,21,265 Rupees/Labour Himachal Pradesh 150000 force participant Tamil Nadu Karnataka Andhra Pradesh Sikkim West Bengal Uttarakhand Chhattisgarh Mizoram Nagaland 100000 MeghalayaTripura Pradesh Arunachal Orissa Rajasthan Jammu & Kashmir Assam Madhya Pradesh Jharkhand Manipur Uttar Pradesh 50000 Bihar Low and declining versus India Low but rising versus India 0 5.00 6.00 7.00 8.00 9.00 10.00 11.00 12.00 13.00 GSDP /Labor force participant growth rate(CAGR) Source : Institute for Competitiveness Analysis
  • 24.
    LONG TERM JOBGROWTH 90000000 Uttar Pradesh 80000000 70000000 All India Average of 60000000 2.05% Number of Jobs, 2011 50000000 Maharashtra Bihar 40000000 West Bengal Andhra Pradesh All India average of Madhya Pradesh 30000000 1,62,99,464 Jobs Tamil Nadu Rajasthan /State Karnataka Gujarat 20000000 Orissa Jharkhand Kerala Assam Punjab Haryana Chhattisgarh 10000000 Delhi Uttarakhand Jammu & Kashmir Himachal Pradesh Nagaland Goa Tripura Mizoram Manipur Arunachal Pradesh Meghalaya 0 Sikkim 0 0.5 1 1.5 2 2.5 3 3.5 Losing Jobs Job growth rate CAGR, 2001-2010 Gaining Jobs Source : Institute for Competitiveness Analysis
  • 25.
    LONG TERM UNEMPLOYMENTRATE 30 Goa jharkhand 25 s Point Index 57.28 ge Avera India All Below average Unemployment All India Average of - 20 2.12% Rajasthan Unemployment rate 2010 Bihar Unemployment Rising 15 Unemployment rate All India Average of Meghalaya 9.39% West Bengal kerala Gujarat Punjab MizoramOrissa Uttar Pradesh 10 Haryana Nagaland Manipur Tripura Andhra Pradesh Madhya Pradesh Arunachal Pradesh Above Average Himachal Pradesh Assam Unemployment Sikkim Maharashtra Jammu Tamil Nadu 5 Uttarakhand Chhattisgarh Karnataka Delhi 0 -25 -20 -15 -10 -5 0 5 10 15 Change in Employment rate 1999-2010 Source : Institute for Competitiveness Analysis, Data as of 2010
  • 26.
    NEAR TERM UNEMPLOYMENTRATE 30 Goa jharkhand Points Avera 57.28 Index All India Average of - India 25 6.55% All ge 20 Unemployment rate 2010 Rajasthan Bihar 15 All India Average of Meghalaya West Bengal 9.39% Punjab Gujarat kerala Orissa Haryana 10 Uttar Pradesh Manipur Mizoram Nagaland Madhya Pradesh Tripura Andhra Pradesh Arunachal Pradesh Sikkim Assam Himachal Pradesh Maharashtra Tamil Nadu Jammu Uttarakhand 5 Chattisgarh Karnataka Delhi 0 -30 -25 -20 -15 -10 -5 0 5 10 Change in Employment rate 2008 to 2010 Source : Institute for Competitiveness Analysis, Data as of 2010
  • 27.
    GROSS AREA SOWNVERSUS IRRIGATED AREA 100000 Madhya Pradesh Maharashtra Uttar Pradesh Rajasthan Tamil Nadu Andhra Pradesh 10000 Gujarat West Bengal Punjab Karnataka Chhattisgarh BiharOrissaHaryana Log of area sown in ‘000 hectares Assam Kerala All India Average Jharkhand 67,41,000 Uttarakhand 1000 Himachal Pradesh & Kashmir Jammu hectares India All All India Average Meghalaya Nagaland Arunachal Pradesh Tripura 30,03,000 hectares Goa 100 Sikkim Mizoram Delhi 10 1 1 10 100 1000 10000 100000 Log of Irrigated Area in ‘000 hectares Source: MOA, Institute for Competitiveness Analysis, Data as of 2010
  • 28.
    HEALTHCARE Percentage of Totalgovernment Expenditure on Medical, Health 10 Delhi 9 8 7 and Sanitation 6 Goa Jammu & Kashmir Uttarakhand All India Average 5 Manipur Himachal Pradesh 4.02% AssamKerala Meghalaya West Bengal Tamil Nadu Tripura Nagaland Uttar Pradesh Mizoram Rajasthan 4 Gujarat Sikkim Chhattisgarh Karnataka Jharkhand Haryana Andhra Pradesh Madhya Pradesh Maharashtra Orissa Punjab Bihar 3 Arunachal Pradesh India All 2 All India Average 1633 Crores 1 0 1000 2000 3000 4000 5000 6000 Total Government Expenditure on Medical, Health and Sanitation in Crores Source: Institute for Competitiveness Analysis
  • 29.
    PERCENTAGE OF VILLAGESELECTRIFIED 120 100 100.0 100.099.7100.098.2 98.2 99.9100.0 100.0 100.0 All India 100 96.9 96.4 96.9 97.3 94.4 Average of 88.3 85.8 88.3 84.96 % 80.8 80.6 80 69.2 64.4 62.6 61.3 59.3 60 56.8 57.2 40 31.1 20 0 Source: Institute for Competitiveness Analysis
  • 30.
    TELEDENSITY 140000 Goa 120000 y = 429.3x + 12630 R² = 0.388 Delhi 100000 Haryana 80000 GSDP per Capita Maharashtra Gujarat Punjab Kerala Himachal Pradesh 60000 Tamil Nadu Karnataka Andhra Pradesh Sikkim Arunachal Pradesh Bengal West MeghalayaChhattisgarh Mizoram Tripura Orissa Uttarakhand 40000 Jammu & Kashmir Rajasthan Nagaland Jharkhand Manipur Madhya Pradesh Uttar Pradesh 20000 0 50 70 90 110 130 150 170 190 210 230 250 Teledensity Source: Ministry of telecom, Institute for Competitiveness Analysis
  • 31.
    DEBT TO GDPRATIO West Bengal 42.8 Prescribed limit according to the Uttaranchal 41.1 growth and stability Pact of EU Uttar Pradesh 43.5 Tripura 42.2 Tamil Nadu 25.5 Sikkim 80.6 Rajasthan 41.1 Punjab 35.2 Orissa 30.6 Nagaland 59.4 Mizoram 109.1 Meghalya 37.3 Manipur 77.4 Maharashtra 25.1 Madhya Pradesh 34.4 Kerala 34.3 Karnataka 24.3 Jharkhand 33.6 Jammu & Kashmir 70.1 Himachal 55.7 Haryana 19 Gujarat 32.1 Goa 35.5 Delhi 13.8 Prescribed limit according Chattisgarh 15.2 to WTO for developing Bihar 39.7 economies Assam 28 Arunachal 115.9 Andhra 30.1 0 20 40 60 80 100 120 Source: Institute for Competitiveness Analysis
  • 32.
    RURAL POPULATION VERSUSRURAL POPULATION GROWTH RATES 4.000 Meghalaya Arunachal Pradesh Bihar Mizoram Manipur Jammu & Kashmir Jharkhand Rajasthan Chhattisgarh Madhya Pradesh Uttar Pradesh 2.000 Assam Himachal Pradesh Uttarakhand Orissa Maharashtra Haryana Gujarat Punjab KarnatakaBengal West Tamil Nadu Tripura Andhra Pradesh 0.000 Sikkim 10 100 1,000 10,000 100,000 1,000,000 Growth rate (CAGR 2001-2011) Nagaland Goa Thousands -2.000 Kerala -4.000 -6.000 Delhi -8.000 -10.000 Population in Rural areas as per census (provisional Data) in Thousands Source: Census 2011, Institute for Competitiveness Analysis
  • 33.
    URBAN POPULATION VERSUSURBAN POPULATION GROWTH RATES 12 Sikkim 10 Growth rate (CAGR 2001-2011) 8 Kerala Tripura 6 Nagaland Haryana 4 Manipur Uttarakhand Chhattisgarh Arunachal Pradesh Andhra Pradesh Goa Bihar Gujarat Meghalaya & KashmirJharkhand Jammu Karnataka Assam Orissa Rajasthan Uttar Pradesh Mizoram Delhi Madhya Pradesh Tamil Nadu Punjab West Bengal Maharashtra 2 Himachal Pradesh 0 0 10000 20000 30000 40000 50000 60000 Thousands Population in Urban areas as per census (provisional Data) in Thousands Source: Census 2011, Institute for Competitiveness Analysis
  • 34.
    100,000,000 120,000,000 140,000,000 160,000,000 20,000,000 40,000,000 60,000,000 80,000,000 0 151,726 455,962 561,977 529037 313,446 1069165 906,309 551414 573,741 1406861 822,132 1899624 595,036 2368971 960,981 2,710,051 688,704 6167805 3,091,169 7,025,583 3,414,106 Source: Census 2011, Institute for Competitiveness Analysis 9134820 16,333,916 419319 8,821,588 Urban Population in 2011 16531493 5,936,538 19603658 10,387,436 RURAL AND URBAN POPULATION IN INDIA 17,316,800 4,388,756 26780516 7,929,292 25,036,946 15,932,171 17455506 6,996,124 Rural Population in 2011 34,951,234 25,712,811 34670817 23,578,175 37552529 17,080,776 51,540,236 34,949,729 37,189,229 20,059,666 52537899 28,353,745 56311788 29,134,060 62,213,676 11,729,609 92075028 50,827,531 61545441 44,470,455 155,111,022
  • 35.
    DEMOGRAPHIC PROFILE INCHHATTISGARH 3000000 2567000 2526000 2521000 2497000 2365000 2500000 1958000 Population in Numbers 1666000 2000000 1563000 1476000 1308000 1500000 1066000 838000 1000000 646000 497000 374000 242000 500000 148000 0 0-4 5-9 10-14 15-19 20-24 25-29 30-34 35-39 40-44 45-49 50-54 55-59 60-64 65-69 70-74 75-79 80+ years years years years years years years years years years years year years years years years years Source: Institute for Competitiveness Analysis
  • 36.
    RURAL URBAN ANDTOTAL POPULATION 120 Delhi Urban Population as a percentage of total Population 100 All India Average India 67.02% All 80 Goa Tamil Nadu Maharashtra 60 Kerala Mizoram Gujarat Karnataka All India Average Punjab Pradesh Andhra Bengal West Haryana 32.98% MadhyaUttar Pradesh Pradesh 40 Rajasthan Uttarakhand Manipur Jammu & Kashmir Jharkhand Nagaland Chhattisgarh Tripura Sikkim Orissa Arunachal Pradesh Bihar Meghalaya Assam 20 Himachal Pradesh 0 -20 0 20 40 60 80 100 120 -20 Rural Population as a percentage of total Population Source: Census 2011, Institute for Competitiveness Analysis
  • 37.
    SEX RATIO VERSUSSEX RATIO GROWTH RATES 0.8 Delhi 0.7 0.6 All India Average 940 India females/1000 males Mizoram All 0.5 Nagaland 0.4 Arunachal Pradesh Goa CAGR growth rate 2001-11 All India Average Punjab Kerela 0.3 0.169% CAGR Haryana Assam 0.2 Sikkim Meghalaya Tripura Madhya Pradesh WestAndhra Pradesh Bengal Uttar Pradesh Manipur Himachal Pradesh Rajasthan Tamil Nadu Jharkhand 0.1 Maharashtra Orissa Karnataka Chattisgarh Uttarakhand Gujarat 0 0 200 400 600 800 Bihar 1000 1200 -0.1 Jammu and Kashmir -0.2 -0.3 Sex ratio Source: Census 2011, Institute for Competitiveness Analysis
  • 38.
    LITERACY RATES VERSUSGDP 140000 Goa 120000 Delhi GSDP per capita at current prices 2011 100000 Haryana y = 1576.x - 73239 R² = 0.254 80000 Maharashtra Gujarat Punjab Himachal Pradesh Kerala 60000 Tamil Nadu Karnataka Andhra Pradesh Sikkim Uttarakhand Chhattisgarh West Bengal Arunachal Pradesh Meghalaya Orissa Tripura Mizoram 40000 Rajasthan & Kashmir Jammu Assam Jharkhand Nagaland Madhya Pradesh Manipur Uttar Pradesh 20000 Bihar 0 60 65 70 75 80 85 90 95 100 Literacy rate 2011 Source: RBI , Census 2011, Institute for Competitiveness Analysis
  • 39.
    REVENUE EXPENDITURE VERSUSREVENUE RECEIPTS 120000 Maharashtra Uttar Pradesh 100000 India All All India Average 34190 Revenue Expenditure in Rs. Crores Andhra Pradesh Rs. Crores 80000 Tamil Nadu West Bengal Gujarat 60000 Karnataka Madhya Pradesh Rajasthan Bihar All India Average 34757 40000 Kerala Punjab Rs. Crores Assam Orissa Haryana Chhattisgarh Jharkhand 20000 Delhi Uttarakhand Himachal Pradesh Jammu & Kashmir Goa Tripura Nagaland Manipur Meghalaya Mizoram Sikkim Arunachal Pradesh 0 0 20000 40000 60000 80000 100000 120000 Revenue Receipts in Rs. Crores Source: RBI , Institute for Competitiveness Analysis
  • 40.
    LITERACY RATES VERSUSPOPULATION 25000000 Uttar Pradesh 20000000 All India Average India All Literacy level of 77.12% 15000000 Maharashtra Bihar 10000000 All India Average West Bengal 67232968 People/state Andhra Pradesh Madhya Pradesh Tamil Nadu Rajasthan Karnataka Gujarat 50000000 Orissa Jharkhand Kerela Assam Punjab Chhattisgarh Haryana Delhi Jammu and Kashmir Uttarakhand Himachal Pradesh Meghalaya Manipur Nagaland Tripura Arunachal Pradesh Sikkim Goa Mizoram 0 0 10 20 30 40 50 60 70 80 90 100 Literacy rates in Percentage terms Source: Census 2011 , Institute for Competitiveness Analysis
  • 41.
    GROWTH RATE INAGRICULTURE VERSUS BANK CREDIT TO AGRICULTURE 20 Gujarat Chhattisgarh Punjab Haryana 15 Andhra Pradesh Tamil Nadu CAGR growth rate in Agriculture 2005-10 Arunachal Pradesh Meghalaya Orissa Uttar Pradesh Maharashtra Madhya Pradesh Assam Kerala Bihar Bengal West 10 Karnataka Rajasthan Sikkim All India Average of Tripura Goa Himachal Pradesh 9.30 % CAGR growth Uttarakhand Delhi 5 Mizoram Jammu & Kashmir rate Manipur Nagaland All India Average of India All 12,157 Crores/state 0 0 5000 10000 15000 20000 25000 30000 35000 40000 45000 Jharkhand -5 Outstanding commercial scheduled bank credit to Agriculture in Rs. Crores Source: MOA , Institute for Competitiveness Analysis
  • 42.
    PERCENTAGE OF FACTORIESIN OPERATION VERSUS TOTAL NUMBER OF FACTORIES 16 Bihar Nagaland Tripura Jharkhand 14 Manipur Percentage of factories not in operation 12 India All All India Average of 6198 Factories/state 10 Kerala Andhra Pradesh 8 Delhi Orissa Tamil Nadu Assam Chhattisgarh All India Average of 4.1% factories not in 6 operation/state average Karnataka Himachal Pradesh Maharashtra 4 Uttarakhand Madhya Pradesh Rajasthan Uttar Pradesh Jammu & Kashmir West Bengal Gujarat Punjab Haryana 2 Meghalaya Goa 0 0 5000 10000 15000 20000 25000 Total number of factories Source: ASI , Institute for Competitiveness Analysis, Data as of 2010
  • 43.
    SLUM POPULATION GROWTHRATE (2001-2011) 30 Meghalya Arunachal Population Decadal Growth Rate Bihar 25 Jammu & Kashmir Mizoram Jharkhand Chattisgarh India’s decadal population Rajasthan Delhi growth rate is 17%. Madhya Uttar Pradesh Pradesh Haryana Uttaranchal 20 Manipur Gujarat Assam Maharashtra Tamil Nadu Karnataka Tripura 15 West Bengal Orissa Punjab Himachal Sikkim Andhra 10 Goa Average change in Kerala slum population is 5 26%. Nagaland 0 0.00 10.00 20.00 30.00 40.00 50.00 60.00 70.00 80.00 -5 Percentage Change in the Slum Population Source: MOUA, Data as of 2010
  • 44.
    AIR POLLUTION 500 Delhi Uttar Pradesh 450 Rajasthan SPM Level above 400 is considered dangerous for 400 industrial areas Madhya Pradesh Punjab Bihar Haryana 350 Maharashtra SPM Level (Residential) 300 Andhra West Bengal Orissa Gujarat Uttaranchal Chhattisgarh 250 Himachal Assam SPM Level above 140 is Karnataka considered dangerous for 200 residential areas Tamil Nadu Jharkhand Nagaland 150 Mizoram Meghalya Goa Kerala 100 50 0 0 100 200 300 400 500 600 SPM Level (Industrial Area) SPM is Suspended Particulate matter. The above mentioned limits are are prescribed by Central Pollution Control Board (CPCB), India.
  • 45.
    CAPITAL OUTLAY BYMAJOR SECTORS Chhattisgarh General economic services 1% Social service 32% Economic service 67%
  • 46.
    POPULATION PERCENTAGES INVARIOUS DISTRISTCS OF CHHATTISGARH 2.58 9.25 3.34 10.42 4.72 5.85 6.35 3.22 15.90 4.04 6.02 13.09 3.13 2.93 Narayanpur 0.55 Note: The are 18 districts in Chhattisgarh out of which Bijapur and Narayanpur are Bijapur 5.53 newly created districts. 1.00 2.09
  • 47.
    POPULATION PERCENTAGES INVARIOUS DISTRISTCS OF CHHATTISGARH Capital City Major Cities Bhilai
  • 48.
    FACTOR CONDITIONS 140000 Goa 120000 Delhi 100000 GSDP in Rs. Crore Haryana 80000 Maharashtra y = 2567.x - 97812 Gujarat Punjab R² = 0.143 Kerala Himachal Pradesh 60000 Tamil Nadu Karnataka Andhra Pradesh Sikkim Uttarakhand Chhattisgarh West Bengal Meghalaya Arunachal Pradesh Tripura Orissa Mizoram 40000 Rajasthan Jammu and Kashmir Assam Nagaland Jharkhand Manipur Madhya Pradesh Uttar Pradesh 20000 Bihar 0 50 52 54 56 58 60 62 64 66 68 Factor Conditions Score Source: MOSPI, Institute for Competitiveness Analysis
  • 49.
    SUB PILLARS OFFACTOR CONDITIONS - FINANCIAL CONDITIONS 140000 Goa 120000 y = 5200.x - 24915 R² = 0.750 Delhi 100000 GSDP in Rs. Crore Haryana 80000 Maharashtra Gujarat Punjab Kerala Himachal Pradesh 60000 Tamil Nadu Karnataka Andhra Pradesh Sikkim Uttarakhand Chhattisgarh West Bengal Meghalaya Arunachal Pradesh Tripura Orissa 40000 Mizoram Rajasthan Jammu & Kashmir Assam Nagaland JharkhandManipur Pradesh Madhya Uttar Pradesh 20000 Bihar 0 50 55 60 65 70 75 Financial Conditions Score Source: MOSPI, Institute for Competitiveness Analysis
  • 50.
    SUB PILLARS OFFACTOR CONDITIONS - PHYSICAL CONDITIONS 2500 Road length per one lakh of Population Delhi 2000 1500 Arunachal Pradesh y = 35.81x - 1554. R² = 0.254 Nagaland 1000 Tripura Assam Manipur Goa Mizoram Kerala Orissa Himachal Pradesh Karnataka Uttarakhand 500 Meghalaya Chhattisgarh Sikkim West Bengal RajasthanAndhra Pradesh GujaratNadu Tamil Jammu & Kashmir Maharashtra Uttar Pradesh Bihar Madhya Pradesh Jharkhand Punjab Haryana 0 45 50 55 60 65 70 75 80 Physical Conditions Score Source: MORTH, Institute for Competitiveness Analysis
  • 51.
    SUB PILLARS OFFACTOR CONDITIONS - COMMUNICATION CONDITIONS 250 Chhattisgarh 200 Teledensity 150 Himachal Pradesh Punjab Tamil Nadu Kerala y = 0.878x + 32.19 Karnataka Maharashtra R² = 0.115 100 Haryana Andhra Pradesh Gujarat West Bengal Bihar Goa Jharkhand Uttarakhand Rajasthan Orissa Manipur Uttar Pradesh Tripura Meghalaya Arunachal Pradesh Mizoram Nagaland Sikkim Jammu & Kashmir Madhya Pradesh Delhi 50 Assam 0 45 55 65 75 85 95 105 Communication Conditions Score Source: Ministry of Telecom , Institute for Competitiveness Analysis
  • 52.
    SUB PILLARS OFFACTOR CONDITIONS – ADMINSTRATION 2000 1800 Orissa Delhi Total Number of Government Hospitals 1600 1400 1200 1000 Uttar Pradesh Karnataka Maharashtra 800 Uttarakhand y = 28.91x - 1185. R² = 0.148 Tamil Nadu 600 Jharkhand Rajasthan Gujarat Kerala Madhya Pradesh Andhra Pradesh 400 West Bengal Bihar Punjab Assam Arunachal Pradesh Himachal Pradesh Haryana 200 Chhattisgarh Jammu & Kashmir Nagaland Goa Manipur Meghalaya Sikkim Tripura Mizoram 0 35 40 45 50 55 60 65 70 -200 Administration Conditions Score Source: CBHI, Institute for Competitiveness Analysis
  • 53.
    SUB PILLARS OFFACTOR CONDITIONS - HUMAN CONDITIONS 14000000 Sikkim 12000000 Population in the age group 15-64 years 10000000 Delhi y = 2E+06x - 8E+07 80000000 R² = 0.429 Chhattisgarh Andhra Pradesh Nagaland 60000000 Haryana Tripura Jharkhand Tamil Nadu Bihar 40000000 Rajasthan Goa Uttarakhand Meghalaya Jammu & Kashmir Kerala 20000000 Gujarat Uttar Pradesh West Bengal Karnataka Orissa Madhya Pradesh Assam MizoramArunachal Pradesh Punjab Himachal Pradesh Manipur 0 Maharashtra 40 45 50 55 60 65 70 75 80 85 90 -2000000 Human Conditions Score Source: Report on Population , Institute for Competitiveness Analysis
  • 54.
    SUB PILLAR OFFACTOR CONDITIONS- INNOVATION RATING 100 Kerala 95 Mizoram 90 Goa Tripura Delhi 85 Himachal Pradesh Sikkim Maharashtra Literacy rate Nagaland Tamil Nadu Manipur Uttarakhand 80 West Bengal Punjab Haryana y = 0.017x + 75.91 Meghalaya Karnataka R² = 0.000 Gujarat 75 Assam Orissa Chhattisgarh Pradesh Madhya Uttar Pradesh 70 Jammu & Kashmir Jharkhand Andhra Pradesh Arunachal Pradesh Rajasthan 65 Bihar 60 45 50 55 60 65 70 75 80 85 90 95 Innovation Score Source: Census 2011, Institute for Competitiveness Analysis
  • 55.
    DEMAND CONDITIONS 140000 Goa 120000 Delhi 100000 Haryana 80000 Literacy rate Maharashtra Punjab Gujarat y = 1048.x - 4544. Kerala Himachal Pradesh R² = 0.211 60000 Tamil Nadu Karnataka Andhra Pradesh Sikkim Uttarakhand Chhattisgarh Meghalaya West Bengal Arunachal Pradesh Mizoram Tripura Orissa 40000 Rajasthan Jammu and Kashmir Assam Nagaland Jharkhand Manipur Madhya Pradesh Uttar Pradesh 20000 Bihar 0 30 35 40 45 50 55 60 65 70 Demand Conditions Source: Census 2011, Institute for Competitiveness Analysis
  • 56.
    SUB PILLAR OFDEMAND CONDITIONS- DEMOGRAPHY 140000 Goa 120000 Delhi 100000 Per capita GSDP at state level Haryana 80000 Maharashtra y = 1048.x - 4544. Punjab Gujarat R² = 0.211 Kerala Himachal Pradesh 60000 Tamil Nadu Karnataka Andhra Pradesh Sikkim Uttarakhand Chhattisgarh West Bengal Arunachal Pradesh Meghalaya Mizoram Tripura Orissa 40000 Jammu and Kashmir Rajasthan Assam Nagaland Jharkhand Manipur Madhya Pradesh Uttar Pradesh 20000 Bihar 0 30 35 40 45 50 55 60 65 70 Demography Source: MOSPI, Institute for Competitiveness Analysis
  • 57.
    SUB PILLAR OFDEMAND CONDITIONS- INCOME AND CONSUMPTION 35,000,000 Uttar Pradesh 30,000,000 25,000,000 Maharashtra Total number of households Andhra West Bengal 20,000,000 Bihar Tamil Nadu Madhya Pradesh 15,000,000 Karnataka y = 26229x - 5E+06 Rajasthan R² = 0.143 Gujarat Orissa 10,000,000 Kerala Assam Jharkhand Chhattisgarh Punjab Haryana 5,000,000 Delhi J&K Uttarakhand Himachal Tripura Manipur Meghalaya MizoramNagaland Arunachal Sikkim Goa 0 20 30 40 50 60 70 80 Income Distribution Source: Census 2011, Institute for Competitiveness Analysis
  • 58.
    SUPPORTING CONDITIONS 140000 Goa 120000 Delhi 100000 y = 2607.x - 10984 R² = 0.654 Haryana 80000 GSDP/ Capita Maharashtra Gujarat Punjab Kerala Himachal Pradesh 60000 Tamil Nadu Karnataka Andhra Pradesh Sikkim Uttarakhand Chhattisgarh West Bengal Meghalaya Arunachal Pradesh Orissa Tripura 40000 Mizoram Rajasthan Jammu and Kashmir Assam Nagaland Jharkhand Manipur Madhya Pradesh Uttar Pradesh 20000 Bihar 0 50 55 60 65 70 75 80 Supporting Conditions Source: MOSPI, Institute for Competitiveness Analysis
  • 59.
    SUB PILLAR OFSUPPORTING CONDITIONS- DIVERSITY OF FIRMS 25000 Tamil Nadu 20000 Maharashtra Andhra Pradesh Total number of factories 15000 Gujarat y = 402.4x - 18291 Uttar Pradesh R² = 0.299 10000 Punjab Karnataka West Bengal Rajasthan Kerala 5000 Haryana Delhi Madhya Pradesh Jharkhand Assam Bihar Orissa Chhattisgarh Uttarakhand Manipur Jammu and Kashmir Himachal Pradesh Goa Tripura Arunachal Pradesh Meghalaya Mizoram Sikkim Nagaland 0 45 50 55 60 65 70 75 80 Diversity of Firms Index Source: ASI, Institute for Competitiveness Analysis
  • 60.
    SUB PILLAR OFSUPPORTING CONDITIONS - BUSINESS INCENTIVES 1200000 Maharashtra 1000000 Outstanding Scheduled commercial bank credit 800000 600000 Chhattisgarh 400000 Tamil Nadu Andhra Pradesh Karnataka y = 5370x - 22486 R² = 0.046 Gujarat West Bengal 200000 Uttar Pradesh Rajasthan Kerala Punjab Madhya Pradesh Haryana Jharkhand Orissa Meghalaya Bihar Delhi Assam Himachal Pradesh Jammu & Kashmir ArunachalSikkim Tripura Uttarakhand Pradesh Manipur Goa Nagaland Mizoram 0 55 60 65 70 75 80 85 90 95 100 Business Incentives Source : RBI, Institute for Competitiveness Analysis
  • 61.
    STRATEGIC CONTEXT 140000 Goa 120000 Delhi 100000 Haryana 80000 GSDP per capita Maharashtra Gujarat Punjab Kerala Himachal Pradesh 60000 Tamil Nadu Karnataka Andhra Pradesh Sikkim Uttarakhand Chhattisgarh West Bengal Meghalaya Arunachal Pradesh Orissa Tripura Mizoram 40000 Rajasthan Jammu and Kashmir Assam Jharkhand Nagaland Madhya Pradesh Manipur Uttar Pradesh 20000 Bihar 0 45 50 55 60 65 70 75 Strategic context Source: Institute for Competitiveness Analysis
  • 62.
    SUB PILLARS OFSTRATEGIC CONTEXT – SUPPLIER SOPHISTICATION 1600000 Tamil Nadu 1400000 Maharashtra Total Number of Factory Workers 1200000 Andhra Pradesh 1000000 Gujarat 800000 y = 20093x - 80534 Uttar Pradesh Karnataka R² = 0.206 600000 West Bengal Punjab Haryana 400000 Arunachal Pradesh Sikkim Mizoram Kerala Rajasthan Madhya Pradesh 200000 Jharkhand Orissa Assam Bihar Chhattisgarh Delhi Himachal PradeshUttarakhand Nagaland Jammu & Kashmir Tripura Goa Manipur Meghalaya 0 45 50 55 60 65 70 75 80 Supplier sophistication Source: ASI, Institute for Competitiveness Analysis
  • 63.
    SUB PILLAR OFSTRATEGIC CONTEXT- INSTITUTIONAL SUPPORT 60 Educational Institutions – Universities per crore of population Sikkim 50 40 y = 0.980x - 49.26 30 R² = 0.650 20 Arunachal Pradesh Uttarakhand Himachal Pradesh Tamil Nadu Chhattisgarh Jammu & Kashmir Goa Mizoram 10 Manipur Karnataka Rajasthan Tripura Nagaland Haryana Bihar MeghalayaGujarat Orissa Kerala Maharashtra Punjab Andhra Pradesh Jharkhand Assam Delhi Uttar Pradesh West Bengal Madhya Pradesh 0 40 45 50 55 60 65 70 75 80 85 -10 Institutional Support Index Source: UGC, Institute for Competitiveness Analysis
  • 64.
    PROSPERITY AND COMPETITIVENESS 90000 Goa Delhi Per capita State Domestic product at constant price 2011 80000 70000 60000 y = 2486.x - 10552 R² = 0.517 Haryana 50000 Kerala Maharashtra Gujarat Himachal Pradesh Tamil Nadu Punjab 40000 Karnataka Andhra Pradesh Sikkim Uttarakhand West Bengal Meghalaya 30000 Tripura Arunachal Pradesh Chattisgarh Mizoram Orissa Rajasthan Jammu and Kashmir Jharkhand Manipur Assam Madhya Pradesh 20000 Nagaland Uttar Pradesh Bihar 10000 0 45 50 55 60 65 70 Microeconomic Competitiveness Scores Source: Institute for Competitiveness Analysis
  • 65.
    POLICE OFFICIALS VERSUSCOMPETITIVENESS 180000 Maharashtra 160000 140000 Number of Police Officials 120000 Uttar Pradesh 100000 Andhra Pradesh Tamil Nadu 80000 Karnataka Jammu and Kashmir West Bengal Rajasthan y = 2830x - 11635 60000 R² = 0.122 Madhya Pradesh Bihar Gujarat Punjab Kerala Haryana 40000 Jharkhand Orissa Assam Chhattisgarh 20000 Uttarakhand Tripura Manipur Nagaland Meghalaya Himachal Pradesh Goa Arunachal Pradesh Mizoram Sikkim 0 45 47 49 51 53 55 57 59 61 63 65 Microeconomic Competitiveness Scores Source: Institute for Competitiveness Analysis
  • 66.
    PORT INFRASTRUCTURE VERSUSCOMPETITIVENESS 60 Maharashtra 50 Gujarat 40 Number of Ports 30 y = 0.225x + 2.814 20 R² = 0.005 Tamil Nadu Kerala Andhra Pradesh 10 Goa Orissa West Bengal 0 50 55 60 65 70 75 80 Microeconomic Competitiveness Score Source: Institute for Competitiveness Analysis
  • 67.
    NATIONAL HIGHWAY INFRASTRUCTUREVERSUS COMPETITIVENESS 7000 Uttar Pradesh 6000 Rajasthan Length of Total National Highways, In Km 5000 Madhya Pradesh Tamil Nadu Andhra Pradesh Karnataka Maharashtra 4000 Orissa Bihar Gujarat Assam 3000 y = 65.13x - 1354. West Bengal R² = 0.035 Chhattisgarh Uttarakhand Jharkhand 2000 Punjab Kerala Haryana Jammu and Kashmir Himachal Pradesh Manipur Mizoram Meghalaya 1000 Nagaland Arunachal Pradesh Tripura Goa Delhi Sikkim 0 45 50 55 60 65 70 Microeconomic Competitiveness Score Source: Institute for Competitiveness Analysis
  • 68.
    AIRPORT INFRASTRUCTURE VERSUSCOMPETITIVENESS 9 West Bengal 8 Gujarat 7 Numbers of Domestic Airports 6 5 Karnataka Madhya Pradesh Maharashtra Andhra Pradesh 4 y = 0.116x - 4.225 R² = 0.098 Assam Kerala Himachal Pradesh Nadu Tamil Punjab 3 Uttar Pradesh Jammu and Kashmir Mizoram Rajasthan Uttarakhand 2 Meghalaya Nagaland Tripura Orissa Chhattisgarh Bihar Goa Haryana Delhi Manipur Jharkhand 1 Arunachal Pradesh Sikkim 0 45 50 55 60 65 Microeconomic Competitiveness Scores Source: Institute for Competitiveness Analysis
  • 69.
    TELEDENSITY VERSUS COMPETITIVENESS Delhi 200 Teledensity , Phones per 100 people in the population 150 y = 4.650x - 210.8 R² = 0.340 Himachal Pradesh 100 Punjab Haryana Gujarat Andhra Pradesh Rajasthan Maharashtra Madhya Pradesh Goa Nagaland Uttar Pradesh Bihar 50 Manipur Tripura Arunachal Pradesh Mizoram Meghalaya Assam Kerala Orissa Karnataka West Bengal Sikkim Tamil Nadu Uttarakhand Jammu and Kashmir Jharkhand Chhattisgarh 0 45 50 55 60 65 70 Microeconomic Competitiveness Scores Source: Institute for Competitiveness Analysis
  • 70.
    LITERACY RATES VERSUSCOMPETITIVENESS 100 95 Kerala Mizoram 90 Tripura Goa Delhi 85 Himachal Pradesh Literacy Rates Sikkim Maharashtra Nagaland Manipur Tamil Nadu Uttarakhand y = 0.237x + 63.62 80 R² = 0.023 West Bengal Punjab Haryana Meghalaya Karnataka 75 Orissa Gujarat Assam Chhattisgarh Madhya Pradesh Uttar Pradesh 70 Jammu and Kashmir Jharkhand Andhra Pradesh Arunachal Pradesh Rajasthan 65 Bihar 60 45 50 55 60 65 Microeconomic Competitiveness Score Source: Institute for Competitiveness Analysis
  • 71.
    EDUCATION VERSUS COMPETITIVENESS 20 Millions Uttar Pradesh 18 16 Students enrolled in higher secondary classes 14 12 10 Andhra Pradesh 8 6 Maharashtra Madhya Pradesh Tamil Nadu 4 West Bengal y = 89218x - 3E+06 Rajasthan Karnataka Bihar R² = 0.014 Gujarat 2 Orissa Kerala Haryana Jharkhand Chhattisgarh Punjab Delhi Jammu and Kashmir Assam Uttarakhand Pradesh Himachal Tripura Nagaland Manipur Mizoram Meghalaya Goa Arunachal Pradesh Sikkim 0 45 50 55 60 65 Microeconomic Competitiveness Score Source: Institute for Competitiveness Analysis
  • 72.
    RURAL TO URBANLITERACY RATIO VERSUS COMPETITIVENESS 100.00 Kerala Ratio of Urban to rural literacy rates in percentage terms Delhi Goa 95.00 Tripura Himachal Pradesh Uttarakhand Manipur Sikkim 90.00 Uttar Pradesh y = 0.305x + 67.33 Haryana Punjab R² = 0.056 Mizoram Maharashtra West Bengal Tamil Nadu 85.00 Nagaland Jammu and Kashmir Gujarat Orissa Karnataka Assam 80.00 Chhattisgarh Bihar Meghalaya Madhya Pradesh Rajasthan Andhra Pradesh Jharkhand 75.00 Arunachal Pradesh 70.00 45 50 55 60 65 70 Microeconomic Competitiveness Score Source: Institute for Competitiveness Analysis
  • 73.
    GENDER DISPARITY (LITERACY)VERSUS COMPETITIVENESS 100.00 Meghalaya Kerala Mizoram Ratio of Female Literacy Rate to male Literacy rates 95.00 Nagaland Tripura 90.00 Delhi Goa Sikkim Punjab Assam Tamil Nadu Manipur Himachal Pradesh Maharashtra 85.00 Karnataka Gujarat y = 0.007x + 81.97 Arunachal Pradesh R² = 3E-05 Uttarakhand Andhra Pradesh 80.00 Orissa Haryana West Bengal Uttar Pradesh Jammu and Kashmir Chhattisgarh Madhya Pradesh 75.00 Bihar Jharkhand 70.00 Rajasthan 65.00 60.00 45 50 55 60 65 70 Microeconomic Competitiveness Score Source: Institute for Competitiveness Analysis
  • 74.
    DEMOGRAPHICS OF INDIA2011 Age Pyramid for India in 2011 80+ 4469 5163 75-79 6075 7017 70-74 8910 10034 65-69 11991 12406 60-64 16693 15712 55-59 22391 20447 50-54 28157 26038 45-49 33218 31993 40-44 36773 36691 Males 35-39 40596 40164 Female 30-34 46050 42855 25-29 54078 47877 20-24 62281 55757 15-19 63479 58248 10-14 61318 57259 5-9 60092 53394 0-4 60746 54133 80000 60000 40000 20000 0 20000 40000 60000 80000 Population of males / females in Thousands in 2011 Source: Census of India, Institute for Competitiveness Analysis
  • 75.
    DEMOGRAPHICS OF INDIA2026 Age Pyramid for India in 2026 80+ 8412 11465 75-79 9937 10644 70-74 15820 15819 65-69 22185 21982 60-64 28268 28651 55-59 32968 34124 50-54 37704 38267 45-49 43702 41361 40-44 51965 46466 Male 35-39 60313 54219 Female 30-34 61859 56739 25-29 60113 55998 20-24 59176 52410 15-19 59529 52739 10-14 59500 52734 5-9 58396 51790 0-4 55328 49256 80000 60000 40000 20000 0 20000 40000 60000 80000 Projected Population of males / females in Thousands Source: Census of India, Institute for Competitiveness Analysis
  • 76.
    OVERALL DEPENDENCE RATIOOF STATES Dependence Ratios 2011 Dependence ratio 2026 West Bengal 44.58 42.35 Uttarakhand 56.39 47.88 Uttar Pradesh 66.11 55.02 Tamil Nadu 43.07 43.78 Rajasthan 60.51 46.67 Punjab 46.62 41.77 Orissa 48.47 43.43 NE States Excluding Assam 44.57 42.23 Maharashtra 48.85 42.72 Madhya Pradesh 60.18 48.37 Kerala 45.23 45.96 Karnataka 45.97 43.46 Jharkhand 55.35 47.13 Jammu & Kashmir 50.27 43.11 Himachal Pradesh 46.91 42.87 Haryana 51.12 41.24 Gujarat 48.40 43.16 Delhi 39.96 34.81 Chattisgarh 57.45 48.40 Bihar 49.71 47.67 Assam 51.97 45.14 Andhra Pradesh 45.05 42.49 80.0 60.0 40.0 20.0 0.0 20.0 40.0 60.0 80.0 Dependence ratio 2011 Dependence ratio 2026 Source: Census of India, Institute for Competitiveness Analysis
  • 77.
    GOVERNMENT HOSPITALS VERSUSCOMPETITIVENESS 1800 Orissa Bihar 1600 1400 Number of government Hoispitals 1200 1000 Uttar Pradesh Karnataka Maharashtra 800 Uttarakhand Tamil Nadu 600 Jharkhand Rajasthan y = 11.66x - 253.3 Kerala R² = 0.016 Madhya Pradesh Gujarat Andhra Pradesh 400 West Bengal Punjab Chhattisgarh Arunachal Pradesh Haryana 200 Assam Himachal Pradesh Delhi Jammu and Kashmir Nagaland Meghalaya Manipur Tripura Sikkim Goa Mizoram 0 45 50 55 60 65 Microeconomic Competitiveness Score Source: Institute for Competitiveness Analysis
  • 78.
    REGISTERED DOCTORS VERSUSCOMPETITIVENESS 10000 West Bengal 9000 Total number of registered Allopathic doctors 8000 Tamil Nadu Uttar Pradesh 7000 Rajasthan 6000 Orissa Karnataka Andhra Pradesh 5000 y = 158.8x - 5888. Maharashtra R² = 0.114 Bihar Kerala 4000 Madhya Pradesh Punjab Delhi 3000 Jammu and Kashmir Gujarat Assam Haryana 2000 Jharkhand Chhattisgarh Uttarakhand Goa 1000 Tripura Meghalaya Manipur Nagaland Arunachal Pradesh Mizoram Sikkim 0 45 50 55 60 65 70 Microeconomic Competitiveness Scores Source: Institute for Competitiveness Analysis
  • 79.
    PER CAPITA REVENUUEEXPENDITURE ON MEDICAL, HEALTH AND EXPENDITURE AND COMPETITIVENESS 2500.00 Goa Per capita revenue expeniture on medical, health and 2000.00 Sikkim 1500.00 Mizoram sanitation Delhi Arunachal Pradesh 1000.00 Himachal Pradesh Jammu and Kashmir Manipur y = 6.696x + 281.1 Uttarakhand R² = 0.004 Nagaland Meghalaya Tripura Assam Kerala Tamil Nadu Haryana Andhra Pradesh Punjab 500.00 Madhya Pradesh Chhattisgarh Maharashtra Gujarat Karnataka Orissa West Bengal Rajasthan Uttar Pradesh Bihar Jharkhand 0.00 45 50 55 60 65 70 Microeconomic Competitiveness Scores Source: Institute for Competitiveness Analysis
  • 80.
    HOUSEHOLDS AND COMPETITIVENESS 35 Uttar Pradesh 30 Number of Households in Millions 25 Maharashtra Andhra Pradesh West Bengal 20 Bihar Tamil Nadu Madhya Pradesh 15 Karnataka Rajasthan Gujarat y = 37114x - 1E+07 R² = 0.045 Odisha 10 Kerala Jharkhand Assam Chhattisgarh Punjab Haryana 5 Delhi Nagaland Uttarakhand Jammu & Kashmir Tripura Himachal Pradesh Meghalaya Manipur Mizoram Goa Arunachal Pradesh Sikkim 0 45.00 50.00 55.00 60.00 65.00 Microeconomic Competitiveness Score Source: Institute for Competitiveness Analysis
  • 81.
    AGRICULTURAL GSDP PERCAPITA AND COMPETITIVENESS Agricultural GSDP per capita in Rupees /Annum 25000.00 Punjab 20000.00 Haryana 15000.00 Nagaland Himachal Pradesh Andhra Pradesh y = 199.8x - 2794. Goa R² = 0.060 Gujarat 10000.00 Orissa West Bengal Kerala Arunachal Pradesh Sikkim Tripura Assam Rajasthan Maharashtra Jammu and Kashmir Uttarakhand Karnataka Manipur Uttar Pradesh ChhattisgarhMadhya Pradesh Meghalaya Tamil Nadu Mizoram 5000.00 Bihar Jharkhand Delhi 0.00 45 50 55 60 65 Microeconomic Competitiveness Score Source: Institute for Competitiveness Analysis
  • 82.
    PER CAPITA FERTILIZERCONSUMPTION AND COMPETITIVENESS 60 Punjab Per caipita consumption of Nitrogenous fertilizers in Kg per annum 50 40 Haryana 30 Andhra Pradesh Gujarat y = 1.047x - 48.11 R² = 0.212 20 Uttar Pradesh Karnataka Maharashtra Chhattisgarh Madhya Pradesh Rajasthan Uttarakhand Tamil Nadu Bihar West Bengal 10 Orissa Jammu & Kashmir Assam Himachal Pradesh Kerala Tripura Manipur Mizoram Goa Nagaland Arunachal PradeshJharkhand Delhi Meghalaya 0 45 50 55 60 65 Microeconomic Competitiveness Score Source: Institute for Competitiveness Analysis
  • 83.
    MANUFACTURING AND COMPETITIVENESS 50000 Goa 45000 40000 Manufacturing GSDP per capita in Rupees /Annum 35000 30000 25000 Gujarat 20000 y = 966.5x - 47032 R² = 0.295 Maharashtra Haryana 15000 Tamil Nadu Chhattisgarh Karnataka Delhi 10000 Jharkhand Punjab Himachal Pradesh Andhra Pradesh Orissa Uttarakhand Kerala West Bengal Rajasthan 5000 Jammu and Kashmir Assam Uttar Pradesh Meghalaya Manipur Madhya Pradesh Nagaland Tripura Sikkim Bihar Arunachal Pradesh Mizoram 0 45 50 55 60 65 Microeconomic Competitiveness Score Source: Institute for Competitiveness Analysis
  • 84.
    SERVICES AND COMPETITIVENESS 90000 Delhi 80000 70000 Services GSDP per capita in Rupees /Annum 60000 Goa 50000 y = 2177.x - 97702 Maharashtra R² = 0.463 Haryana 40000 Kerala Punjab Tamil Nadu 30000 Karnataka Mizoram Gujarat Andhra Pradesh Sikkim West Bengal Nagaland Uttarakhand Tripura Himachal Pradesh 20000 Arunachal Pradesh Meghalaya Orissa Assam Jammu and Kashmir Chhattisgarh Rajasthan Manipur Madhya Pradesh Uttar Pradesh 10000 Jharkhand Bihar 0 45 50 55 60 65 70 Microeconomic Competitiveness Score Source: Institute for Competitiveness Analysis
  • 85.
    HOUSEHOLDS IN INDIA Households in India (in Millions) 2001 and 2011 32.92 23.83 21.02 20.07 18.94 18.49 25.76 13.18 14.97 12.18 19.06 12.58 16.85 9.66 15.72 7.72 14.17 6.37 13.98 5.62 6.18 10.92 0.51 0.54 0.22 0.40 5.41 0.26 0.32 9.64 4.72 1.48 2.02 10.23 9.34 0.13 0.84 2.00 4.15 0.28 6.60 7.87 0.21 4.94 3.53 1.24 1.55 4.86 0.40 0.42 0.16 0.33 4.27 0.10 0.66 1.59 Percentage of Households in India 2001 and 2011 having electricity 96.9 96.8 96.6 90.4 90.5 85.1 90.6 94.4 83.9 92.5 93.4 92.2 84.2 81.6 67.1 87 65.7 75.3 68.4 67 93.6 94.8 60.9 91.9 68.4 80.4 82.9 80.7 78.6 77.8 78.2 54.5 67.2 45.8 70.2 70.0 77.5 69.6 63.6 43 36.8 60.3 54.7 37.1 53.1 60.0 54.7 16.4 42.7 41.8 37.5 24.9 10.3 26.9 31.9 24.3 Percentage of Households having electricity in India 2001 Percentage of Households having electricity in India 2011 Source: Census of India,2011 Institute for Competitiveness Analysis
  • 86.
    ACCESS TO WATER 100 3.4 0.9 3.2 2 3.1 1.7 1.8 3.4 2.3 2 2.6 2.2 3.2 3.5 2.4 6.7 3 5.1 5.2 0.1 4.4 0.7 14.1 5.7 3.6 11.1 2.9 11.3 3.5 7.2 7.6 0.3 3.7 2 9.6 6.9 8.2 16.7 2.9 15.8 11.1 0.5 90 12.9 0 20.6 16.7 16 89.5 21.9 16.3 9.9 4.6 0.6 29.9 20 2.4 9.2 13.7 1.5 12.2 85.3 0 34.8 11.6 85.4 5.1 80 22 12 10.7 4.5 47.2 5.5 79.8 11.4 14.4 2.2 Percentage by source of households 7.1 6.4 43.8 9 70 1.1 3 5.7 18.1 2.6 6.5 0.9 2.8 47.1 69 69.9 68.8 24.7 68.2 25.3 64.9 0.8 67.9 66.1 65.5 4.7 58.4 60 63.9 25.7 62 58.7 50.1 50.2 41.5 86.6 0.4 25.4 50 0.5 6.5 51 27.4 10.8 47.2 7.5 40 40.6 39.3 38.6 20 30 33.2 36.5 4 6 11.4 29.3 27.3 19.5 25.4 20 18.9 23.4 20.7 10 12.9 13.8 4.3 10.5 0 4.4 Tap water Well Handpump Tubewell Tank, Pond, Lake, River, Spring, Canal and any other source Source: Census of India,2011 Institute for Competitiveness Analysis
  • 87.
    EXPORT COMPETITIVENESS 160,000 Madhya Share of Exports from various states in 2010-11 Value of Exports from various states Pradesh 1% Goa 140,000 1% Punjab 2% Rest of the 120,000 Rajasthan states 53788 2% 11% 61694 Delhi Exports in Millions of Dollars 2% Gujarat 100,000 Kerala 25% 3% Odisha 3% 80,000 West Bengal 3% 43356 60,000 38775 Uttar Pradesh Maharashtra 3% 21% Haryana 23378 3% Tamil Nadu 40,000 44667 9% 40272 Andhra Pradesh 16085 13603 12567 5% 20,000 Karnataka 9093 8208 18540 8559 8584 7111 6990 6547 5% 5524 12296 9897 5679 4197 5843 3230 4792 7571 5583 3351 4753 0 2008-09 2009-10 2010-11 Source: Economic Survey of India 2011, Institute for Competitiveness Analysis
  • 88.
    COUNTRY EQUIVALENTS BAHA CUBA MAS Source: EIU 2011, Institute for Competitiveness Analysis
  • 89.
    EXPORTS FROM THETOP 15 STATES PERCENTAGE OF THE TOTAL Jammu and Kashmir Himachal Pradesh Pakistan China Punjab Uttarakhand 1.6 Haryana 3.4 Delhi Arunachal Pradesh Nepal 2.4 Uttar Pradesh Sikkim Rajasthan 3.3 2.1 Assam Nagaland Bihar Meghalaya Manipur Tripura Gujarat Jharkhand Mizoram 24.6 Madhya Pradesh West Bengal 1.2 2.8 Chhattisgarh Odisha 2.8 Maharashtra 21.4 Bay of Bengal Arabian Sea Andhra Pradesh 5.0 Goa 0.7 Karnataka 5.4 Tamil Nadu Kerala 9.3 2.6 Sri Lanka Indian Ocean Source: Institute for Competitiveness Analysis
  • 90.
    NUMBER OF PPPPROJECTS IN INDIA Jammu and Kashmir 3 Himachal Pradesh Pakistan 1 China Punjab Uttarakhand 35 21 Haryana 40 15 Delhi Nepal Arunachal Pradesh Sikkim 7 Uttar Pradesh 31 Rajasthan 22 Assam Nagaland 0 67 7 Bihar Meghalaya 2 18 Manipur 0 Tripura Gujarat Jharkhand 0 Mizoram 74 Madhya Pradesh 11 West Bengal 0 88 36 Chhattisgarh 4 Odisha 33 Maharashtra 88 Bay of Bengal Arabian Sea Andhra Pradesh Goa 100 2 Karnataka 108 Tamil Nadu Kerala 52 33 Sri Lanka Indian Ocean Source: Institute for Competitiveness Analysis
  • 91.
    POPULATION PERCENTAGES INSTATES Jammu and Kashmir 1.04 Himachal Pradesh Pakistan 0.57 China Punjab Uttarakhand 2.29 0.84 Haryana 2.09 Delhi Nepal Arunachal Pradesh 1.38 Sikkim 0.11 Uttar Pradesh Rajasthan 16.49 Nagaland 5.67 Assam 0.16 2.58 Bihar Meghalaya 0.24 8.58 Manipur 0.22 Tripura Gujarat Jharkhand 0.30 Mizoram 4.99 Madhya Pradesh 2.72 West Bengal 0.09 6.00 7.55 Chhattisgarh 2.11 Odisha 3.47 Maharashtra 9.29 Bay of Bengal Arabian Sea Andhra Pradesh Goa 7.00 0.12 Karnataka 5.05 Tamil Nadu Kerala 5.96 2.76 Sri Lanka Indian Ocean Source: Institute for Competitiveness Analysis
  • 92.
    PROSPERITY IN INDIA Jammu and Kashmir 474 Himachal Pradesh Pakistan 872 China Punjab Uttarakhand 821 650 1056 Haryana 1652 Delhi Arunachal Pradesh Nepal 669 553 Uttar Pradesh Sikkim Rajasthan 320 494 Assam Nagaland 396 Bihar Meghalaya 378 571 254 Manipur 394 Gujarat Jharkhand Tripura Mizoram 941 Madhya Pradesh 404 West Bengal 544 529 377 615 Chhattisgarh 534 Odisha Maharashtra 487 945 Bay of Bengal Arabian Sea Andhra Pradesh Goa 698 1788 Karnataka 713 Tamil Nadu Kerala 801 933 Sri Lanka Indian Ocean All the figures are in dollars, The exchange rate taken for arriving at the figures was 1 US$ = 49 Rupees Source: Institute for Competitiveness Analysis
  • 93.
    STATE OF INDUSTRIES 10000000 Andhra Pradesh West Bengal Uttar Pradesh Gujarat Karnataka Maharashtra Delhi Kerala Rajasthan Tamil Nadu Orissa Punjab Bihar Assam Madhya Pradesh Haryana 1000000 Jharkhand Jammu & Kashmir Chhattisgarh Tripura Uttarakhand Meghalaya Goa All India Average of India All Manipur 100000 Sikkim Himachal Pradesh All India Average 18,54,826 people Nagaland Arunachal Pradesh 23816.62 Crores employed/ state Mizoram 10000 1000 100 10 1 0 20000 40000 60000 80000 100000 120000 Contribution in Rs Crores Source: MSME , Institute for Competitiveness Analysis
  • 94.
    CONTRIBUTION PER PERSONIN INDUSTRIES 7.00 6.00 5.75 Contribution in Lakhs of Rupees 5.00 4.00 3.79 3.88 3.56 3.34 2.96 Average 3.00 Contribution of 2.76 1.57 2.27 Lakhs/Person 1.98 2.00 1.77 1.72 1.41 1.37 1.26 1.20 1.00 0.76 0.76 0.81 0.51 0.55 0.43 0.62 0.62 0.30 0.36 0.35 0.25 0.14 0.20 0.00 Source: MSME 4th round , Institute for Competitiveness Analysis
  • 95.
    PER UNIT EMPLOYMENTVERSUS PER UNIT GROSS OUTPUT 45.00 40.00 35.00 Per unit employment (Person) 30.00 25.00 Per unit Gross Output (in Lakhs of 20.00 Rupees) 15.00 10.00 5.00 0.00 Manufacturing Services Manufacturing Services Per unit employment (Person) 4.57 1.54 Per unit Gross Output (in Lakhs of Rupees) 41.19 1.94 Per unit revenues/ per unit employment 9.01 1.26 Source: MSME, Institute for Competitiveness Analysis
  • 96.
    MARKET VALUE VERSUSORIGINAL VALUE OF PLANT AND EQUIPMENT 1800.00 1600.00 1400.00 Market value of Fixed Investments in Crores of 1200.00 Rupees 1000.00 800.00 600.00 Original value of Plant and Machinery/ Equipment 400.00 in Crores of Rupees 200.00 0.00 Manufacturing Services Manufacturing Services Market value of Fixed Investments in Crores of Rupees 1778.91 153.58 Original value of Plant and Machinery/ Equipment in Crores of Rupees 508.10 49.92 No of times valued by the market 3.50 3.08 Source: MSME, Institute for Competitiveness Analysis
  • 97.
    STATE OF CLUSTERDEVELOPMENT: TOTAL NUMBER OF FACTORIES Agricultural Glass and Furniture related services industries Wood and Agricultural Domestic Forest Products and electric Television Products Industries and allied electronic Other industries Other Processed Service Lighting transportat food Industries Electric ion Publishing equipment and Printing Medical Machinery equipment and Equipment Automotiv e Pulp and Apparels Textiles Paper and related industries Chemicals Production Tobacco Minerals Footwear Rubber and Leather Oil and Gas Plastic Metals industries Industries Mining Top 7 types of Industries in the state 15-21 types of Industries in the state 7-14 types of Industries in the state 21-28 types of Industries in state Source: ASI 2008-09, Institute for Competitiveness Analysis
  • 98.
    STATE OF CLUSTERDEVELOPMENT: TOTAL NUMBER OF EMPLOYEES Agricultural Glass and Furniture related services industries Wood and Agricultural Domestic Forest Products and electric Television Products Industries and allied electronic Other industries Other Processed Service Lighting transportat food Industries Electric ion Publishing equipment and Printing Medical Machinery equipment and Equipment Automotiv e Pulp and Apparels Textiles Paper and related industries Chemicals Production Tobacco Minerals Footwear Rubber and Leather Oil and Gas Plastic Metals industries Industries Mining Top 7 types of Industries in the state 15-21 types of Industries in the state 7-14 types of Industries in the state 21-28 types of Industries in state Source: ASI 2008-09, Institute for Competitiveness Analysis
  • 99.
    STATE OF CLUSTERDEVELOPMENT: TOTAL NUMBER OF PEOPLE 0 Glass Industries 0 0 Minerals 0 0 Domestic and electric industries 0 0 Furniture 0.019 0.078 Leather Industries 0.094 0.214 Chemical 0.215 0.277 Tobacco 0.32 0.64 Pulp and Paper 0.726 0.756 Footwear 0.833 0.956 Agriculture Products 1.208 2.161 Textiles 3.314 4.878 Agriculture services 14.661 15.361 Other service industries 15.469 16.51 Food Processing 75.265 0 10 20 30 40 50 60 70 80 Thousands Source: ASI, Institute for Competitiveness Analysis
  • 100.
    CREATING A STATEECONOMIC STRATEGY State Value Proposition What are the main strengths, positive attributes, location advantage etc of the particular state in question. Developing Unique Strengths Achieving and Maintaining parity with peers • How can the state leverage on its • What are the key weaknesses unique capabilities and create new which need to be taken care of ones? while forming maintaining parity • Which businesses/ clusters can be with peers? made stronger? State economic strategy requires setting clear priorities and measuring against predefined criteria.
  • 101.
    COMPETITION AMONG STATES Tactical (Zero Sum Strategic (Positive Competition) Sum Competition) • Focus on FDI investments • Focus on domestic and existing • Compete in every domain companies • Compete in specialized cluster domains • Offer tax benefits across the • Government incentives and support for spectrum training, infrastructure, and institutions • Provide subsidies to lower / offset • Improve the efficiency of doing business costs business • Economies of scale to help benefit from • Every city and sub-region for itself multiple geographies • Government is responsible for • Government and the private sector development of cluster. collaborate to build cluster strength Source: Michael E Porter
  • 102.
    HOW SHOULD STATESCOMPETE WITH EACH OTHER Old Model New Model • Economic development is a • Government drives economic collaborative process involving development through policy government at multiple decisions and incentives levels, companies, teaching and research institutions, and private sector organizations Competitiveness is the result of both top-down and bottom-up processes in which many companies and institutions take responsibility Source: Michael E Porter
  • 103.
    COMPETITION AMONG STATES •The purpose of a sound economic policy is to increase the overall prosperity in the state and for that the states should focus on increasing their competitiveness. • Improvements and productivity and technological advancement are the guiding principles in this regard. • Competitiveness requires a fundamental rethinking of usage of your existing resources. • For government has to fundamentally rethink its role, it should try to foster a spirit of entrepreneurship in the private sector. • The criteria for judging the merits and demerits of an economic policy should be by outcomes and not political philosophy. • The prosperity of India will depend largely on the states and not just the (Center) Delhi.
  • 104.
    INTERPRETATION CHARTS • The snapshot chart summarizes the relative performance of a state on levels and trends in 5 key measures. The circles in the chart show the measurement of the chart legend. • Prosperity: State GDP per capita and 10 year trend. • Productivity: Average Private wage and 10 year trend. • Labour Mobilization: Total labour force as a share of civilian population and 10 year trend. • Clusters: Total number of people employed in the cluster and total number of enterprises in the cluster. • Type of Economy: Factor Driven economies, Changeover economies, Investment driven economies, Transition economies, Innovation driven economies and city state economies. Position Trend Prosperity Productivity Labour Mobilization State of Clusters Top 33.33% of the states Type of Economy Investment Driven 33.33%-66.67% of the states Mining Leading Clusters Wood and forest products Agricultural Products 66.67% to 100% of Lighting and Electric Industries the states
  • 105.
    STATE OF CLUSTERDEVELOPMENT : FACTORIES Agricultur Glass and al Furniture related services industries Wood and Agricultur Domestic Forest al and Products Products electric Television The Chart represents the number Industries and allied electronic of factories in various types of industries Other Other Industries in state. Processe Service Lighting transport ation d food Industries Electric equipmen t The position of the various types Publishin g and of factories shows relative Printing Medical Machiner y and equipmen proximity in terms of type of t Equipmen t Industry. Thus, Chemical is placed Automoti ve next to Oil and gas, etc. Pulp and Paper Apparels Textiles and The colour coding is done to related industries Chemicals Productio show the importance of factory Tobacco n sector in terms of number of Minerals enterprises in the state. Thus yellow shows the maximum Leather Footwear Oil and Gas Rubber and Metals industries Plastic number of industries in the state. Industries Mining Top 7 types of Industries in the state 15-21 types of Industries in the state 7-14 types of Industries in the state 21-28 types of Industries in the state
  • 106.
    STATE OF CLUSTERDEVELOPMENT : EMPLOYEES Agricultu Glass and ral Furniture related services industrie s Wood Domestic and Agricultu and Forest ral Televisio electric Products Products n and Industrie The Chart represents the number of s allied electroni c Employees in various types of industrie Other s Other Industries in state. Processe Service Industrie Lighting transport ation d food s Electric equipme nt The position of the various types of Publishin g and industries shows relative proximity Printing Medical Machiner equipme y and in terms of type of Industry. nt Equipme nt Thus, Chemical is placed next to Oil Automoti and gas. etc. ve Pulp and Paper Apparels Textiles and The colour coding is done to show related industrie the importance of Industries in s Chemical s Productio n Tobacco terms of number of employees in the state. Thus yellow shows the Minerals bracket of maximum number of Leather Footwear Oil and Rubber and Metals employees in the state. industrie s Gas Plastic Industrie s Mining Top 7 ranked types of Factories in the state 15-21 ranked types of Factories in the state 7-14 ranked types of Factories in the state 21-28 ranked types of Factories in the state
  • 107.
    COMPONENTS OF REGIONALECONOMIES • The economy has been looked at from the primary, secondary and tertiary Perspective. These sectors are then looked in detail to find the contribution of each sub sector to the three primary sectors namely Agriculture, Industry and Services. • The result is a bubble chart which shows the contribution of each sub sector to the economy. • The size of the bubble represents the size of the GSDP contribution in Rs. Crores. 18 16 Chhattisgarh/National GSDP share (Percent) ,2011 14 Mining and quarrying The regions share of 12 cluster GSDP relative to its size 10 Strong and Growing Position 8 Electricity, gas and water 6 supply 4 Forestry and logging Manufacturing Railways Other services administration and Construction 2 Public Real states, ownership of Fishing Agricuture Trade, hotel and restaurant Transport by other means defence Storage Communication dwellingsBanking and insurance and business Cluster is growing 0 services faster than Indian Average -2 0 5 10 15 20 25 30 35 Change in contribution of GSDP of Chhattisgarh to total Indian GSDP, CAGR (2000-2011)
  • 108.
    EMPLOYMENT BY ACLUSTER Apparels and related Industries 0 Glass Industries 0 • Clusters are geographically proximate Production 0 Minerals 0 groups of interconnected companies and Metals 0 Domestic and electric industries 0 associated institutions in a particular field. Machinery and equipment 0 Furniture 0.019 Examples include chemical and Oil and Gas 0.078 Leather Industries 0.094 pharmaceutical clusters in Gujarat and Printing and Publishing 0.214 Chemical 0.215 apparel and diamond cluster in Surat. Television and allied electronic … 0.277 Clusters and sub clusters taken for the study Tobacco 0.32 Automotive 0.64 are taken at the end of this report. Pulp and Paper 0.726 Other transportation 0.756 Footwear 0.833 Medical 0.956 • Employment by cluster gives a more Agriculture Products 1.208 Mining 2.161 detailed profile of the activities in the state Textiles 3.314 Lighting and electric equipment 4.878 economy that make up the Job Base. It can Agriculture services 14.661 Rubber and Plastic Industries 15.361 be used to understand the importance of Other service industries 15.469 the health of various groups of Industries on Wood and forest Products 16.51 Food Processing 75.265 the overall prosperity of the region. 0 20 40 60 80 Thousands
  • 109.
    A BRIEF NOTEOF THE REGIONS AND OVERALL ECONOMY OF CHHATTISGARH • The political boundaries of a state often encompass many distinct regional economies or portions of large regional economies. A comprehensive approach to economic development should reflect both the distinct economies within the state as well as strong linkages to the economies in the neighboring states. In addition to this clusters should be mapped on areas of high economic growth. This will lead to spillover effects in the long run. 3000000 • A state's or region’s economy can be divided 2549085 into 3 components namely 2500000 2000000 GSDP in Rs. Crore 1492375 1500000 1. Primary/Agriculture sector 2. Secondary/Industry sector 1000000 924340 3. Tertiary/Service sector 500000 16820 53614 33176 0 Agriculture, forestry Industry Services and fishing In this report we focus more on Industrial sector to bring out its components in detail.
  • 110.
    CLUSTERS AND SUBCLUSTERS IN THE INDIAN ECONOMY Agricultural products Leather industries Other transportation • Grain mill products, starches & starch products • Tanning & dressing of leather; luggage, handbags • Other transport equipment and prepared animal foods • Railway and tramway locomotives and rolling stock • Other food products Lighting electric equipment • Transport equipment • Beverages • Insulated wire and cable Processed food Apparels and related industries • Accumulators, primary cells and primary batteries • Manufacture of food products and beverages • Knitted and crocheted fabrics and articles • Electric lamps and lighting equipment • Meat, fish, fruit vegetables, oils and fats • Wearing apparel; dressing and dyeing of fur • Other electrical equipment • Dairy product • Wearing apparel, except fur apparel Machinery and equipment Production • Structural metal products, tanks, reservoirs • Agricultural services • Other fabricated metal products Manufacturing • Agriculture, hunting, and related services activities • Machinery and equipment • General purpose machinery Publishing and printing Automotive • Special purpose machinery • Publishing • Bodies (coach work) for motor • Printing and service activities related to printing vehicles Medical equipment • Parts and accessories for • Medical, precision and optical Rubber and plastic industries motor vehicles & their engines instruments, watches & clocks • Rubber products • Plastic products Chemicals Metals • Basic chemicals • Basic Iron & Steel • Basic precious and non-ferrous metals Television and allied electronic industries • Casting of metals • Electronic valves and tubes Domestic and electric Industries and other electronic components • Domestic appliances • Office, accounting and computing machinery Minerals • Television and radio transmitters • Minerals and apparatus • Electrical machinery and apparatus • Television and radio receivers • Electric motors, generators and transformers • Mining Electricity distribution and control apparatus • Mining and quarrying Textiles • Spinning, weaving and finishing of textiles Footwear Pulp and Paper • Other textiles • Footwear • Pulp and Paper Industries Tobacco • Tobacco products Furniture Other service industries • Furniture • Other Service Industries Wood and forest products Oil and gas • Wood and of products Glass and related industries • Coke oven products • Saw milling and planning of wood • Glass and glass products • Refined petroleum products • Products of wood, cork, straw and plaiting materials