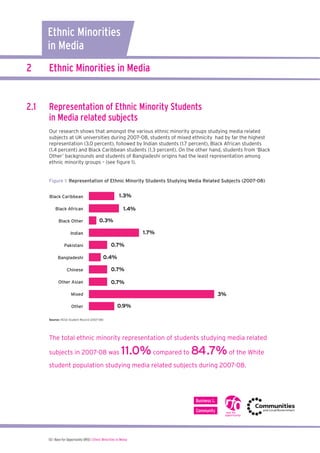
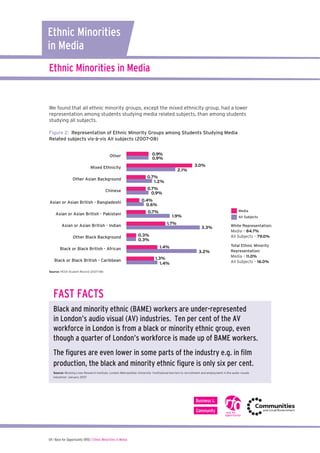
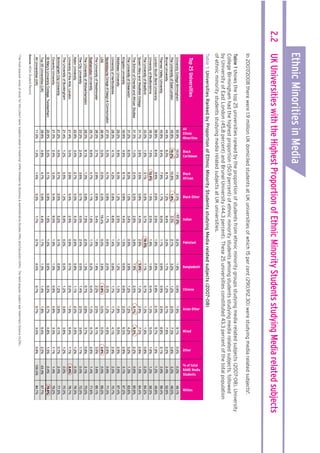
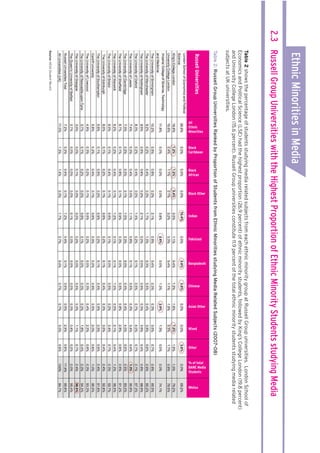
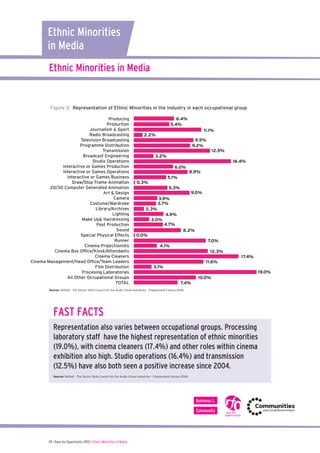
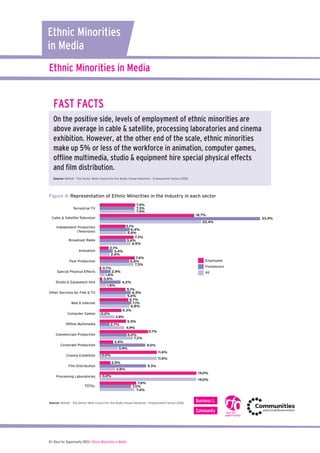
Research
Ethnic Minorities in Media

Workplace
Ethnic Minorities
in Media
1

Research Sources and Assumptions

1.1

Source
The data used in this factsheet is from the Higher Education Statistics Agency (HESA)
student record database. The data covers the academic year of 2007 – 2008.
Definitions of the various subject areas used in this factsheet can be found at:
http://www.hesa.ac.uk/index.php/content/view/102/136/1/4

1.2

Assumptions
	 	 

The data used refers to UK domiciled students only; it does not include overseas students
who are studying in the UK.


Students falling under the ‘Unknown’ category have not been added to the White group
or any of the ethnic minority groups. Instead, these have either been disregarded or
represented as ‘Unknown’ in the analysis.


Media related subjects include the following subjects:
o
o
o

1.3

Mass communications and documentation
Languages
Creative arts and design

Definitions
The ethnic minority category groupings are based on Census 2001 categories.
Please note in particular that:


White includes:
White
Irish Traveller


Mixed includes:
Mixed – White and Black Caribbean
Mixed – White and Black African
Mixed – White and Asian
Mixed – other


Other includes:
Other ethnic background


Not Known includes:
Not Known
Information refused

02 I Race for Opportunity (RfO) | Ethnic Minorities in Media
Ethnic Minorities
in Media
2

Ethnic Minorities in Media

2.1

Representation of Ethnic Minority Students
in Media related subjects
Our research shows that amongst the various ethnic minority groups studying media related
subjects at UK universities during 2007–08, students of mixed ethnicity had by far the highest
representation (3.0 percent), followed by Indian students (1.7 percent), Black African students
(1.4 percent) and Black Caribbean students (1.3 percent). On the other hand, students from ‘Black
Other’ backgrounds and students of Bangladeshi origins had the least representation among
ethnic minority groups – (see figure 1).

Figure 1: Representation of Ethnic Minority Students Studying Media Related Subjects (2007-08)

1.3%

Black Caribbean

1.4%

Black African
Black Other

0.3%
1.7%

Indian

0.7%

Pakistani
Bangladeshi

0.4%

Chinese

0.7%

Other Asian

0.7%
3%

Mixed
Other

0.9%

Source: HESA Student Record (2007-08)

The total ethnic minority representation of students studying media related
subjects in 2007-08 was

11.0% compared to 84.7% of the White

student population studying media related subjects during 2007-08.

03 I Race for Opportunity (RfO) | Ethnic Minorities in Media
Ethnic Minorities
in Media
Ethnic Minorities in Media

We found that all ethnic minority groups, except the mixed ethnicity group, had a lower
representation among students studying media related subjects, than among students
studying all subjects.
Other

0.9%

Other Asian Background

0.7%
1.2%

0.9%
Figure 2: Representation of Ethnic Minority Groups among Students Studying Media
3.0%
Related subjects vis-à-vis All subjects (2007-08)
Mixed Ethnicity
2.1%

Other

0.9%
0.7%
0.9% 0.9%

Chinese

AsianMixed Ethnicity
or Asian British - Bangladeshi

0.4%
0.6%

Asian Background
Other Asianor Asian British - Pakistani

0.7% 0.7%
1.2%

Asian or Asian British - Indian

Chinese

Other Black Background

Asian or Asian British - Bangladeshi

Black or Black British - African

Asian or Asian Black or Black British - Caribbean
British - Pakistani

0.4% 0.3%
0.6%
0.7%

3.0%

1.9%
1.7%

0.7%
0.9%
0.3%

1.4%

3.3%

3.2%

Media

1.3%
1.9%
1.4%

1.7%

Asian or Asian British - Indian
Other Black Background

2.1%

All Subjects

White Representation:
Media – 84.7%
All Subjects – 79.0%

3.3%

0.3%
0.3%

Black or Black British - African

1.4%

Black or Black British - Caribbean

Total Ethnic Minority
Representation:
Media
Media – 11.0%
All Subjects
All Subjects – 16.0%

1.3%
1.4%

3.2%

Source: HESA Student Record (2007-08)

FAST FACTS

68.6%

79.0%

Black and minority ethnic (BAME) workers are under-represented
in London’s audio visual (AV) industries. Ten per cent of the AV
workforce in London is from a black or 27.4% ethnic16.0% even
minority
group,
though a quarter of London’s workforce is made up of BAME workers.
68.6%

79.0%

The figures are even lower in some parts of the industry e.g. in film
production, the black and minority ethnic figure is only six per cent.
Source: Working Lives Research Institute, London Metropolitan University ‘Institutional barriers to recruitment and employment in the audio visuals
industries’ January 2007

27.4%

04 I Race for Opportunity (RfO) | Ethnic Minorities in Media

16.0%
2.2

Ethnic Minorities in Media

UK Universities with the Highest Proportion of Ethnic Minority Students studying Media related subjects

In 2007/2008 there were 1.9 million UK domiciled students at UK universities of which 15 per cent (290,912.30) were studying media related subjects1.

Mixed

Other

% of total
BAME Media
Students

Whites

Table 1 shows the top 25 universities ranked by the proportion of students from ethnic minority groups studying media related subjects (2007-08). University
College Birmingham had the highest proportion (50.9 percent) of ethnic minority students among students studying media related subjects, followed
by University of East London (45.8 percent) and Brunel University (44.3 percent). These 25 universities constituted 43.3 percent of the total population
of ethnic minority students studying media related subjects at UK universities.

Black
African

Black Other

Indian

Pakistani

Bangladeshi

Chinese

Asian Other

Table 1: Universities Ranked by Proportion of Ethnic Minority Students studying Media related subjects (2007–08)

Top 25 Universities

Black
Caribbean

The most popular areas of study for this cohort were ‘subjects allied to medicine’ (14%) followed by Business & Administrative Studies (11%) and Education (10%). The least popular subject was Veterinary Science (0.2%).

Source: HESA Student Record
1

All
Ethnic
Minorities
Ethnic Minorities in Media

2.3 Russell Group Universities with the Highest Proportion of Ethnic Minority Students studying Media

% of total
BAME Media
Students

Whites

Table 2 shows the percentage of students studying media related subjects from each ethnic minority group at Russell Group universities. London School of
Economics and Political Science (LSE) had the highest proportion (26.9 percent) of ethnic minority students, followed by King’s College London (19.8 percent)
and University College London (15.6 percent). Russell Group universities constitute 11.9 percent of the total ethnic minority students studying media related
subjects at UK universities.

Black
Caribbean

Black
African

Black Other

Indian

Pakistani

Bangladeshi

Chinese

Asian Other

Mixed

Other

Table 2: Russell Group Universities Ranked by Proportion of Students from Ethnic Minorities studying Media Related Subjects (2007–08)

Russell Universities

Source: HESA Student Record

All
Ethnic
Minorities
Ethnic Minorities
in Media
What’s class got to do with it?


Of the top 100 journalists in 2006, 54% were independently educated
an increase from 49% in 1986.
Source: The Sutton Trust -The Educational Backgrounds of Leading Journalists, June 2006


A separate survey of leading journalists and editors suggests that the latest new recruits
to the national news media are even more likely to come from privileged backgrounds
than those from previous generations. Reasons for this range from: low pay and
insecurity at junior levels; the high costs of living in London; the increasing costs of
postgraduate courses; a bias towards those with family or personal connections within
the industry amid a largely informal but highly competitive recruitment process;
and finally, the stronger skills and attributes exhibited at an earlier age by those
from private schools.
Source: The Sutton Trust -The Educational Backgrounds of Leading Journalists, June 2006

Some Household Names and their Educational Background
News Presenters/Correspondents:
Name
Jeremy Paxman
John Simpson
Jon Snow

Organisation
BBC Newsnight
BBC
Channel 4 News

David Dimbleby

BBC Question Time

Fiona Bruce

BBC

School
Malvern College
St. Pauls
St Edwards Chichester
High for Boys
Glengorse, Battle;
Charterhouse
Hatcham Girls,
New Cross

School Type
IND
IND

University
Cambridge
Cambridge

IND

Liverpool

IND

Oxford

SEL

Oxford

Ardingly College
St. Dunstan’s College
Dulwich College
Clifton College
Cranleigh

IND
IND
IND
IND
IND

Oxford
Oxford
Oxford
Oxford
Cambridge

Newspaper Editors:
Ian Hislop
Matthew d’Ancona
Lionel Barber
Roger Alton
Alan Rusbridger

Private Eye
Spectator
Financial Times
Observer
Guardian

Source: The Sutton Trust -The Educational Backgrounds of Leading Journalists, June 2006


Private schools make up only 7 per cent of the country’s secondary school
population. Yet they produce well over half of the country’s top news
journalists.
Source: The SuttonTrust -The Educational Backgrounds of Leading Journalists, June 2006

07 I Race for Opportunity (RfO) | Ethnic Minorities in Media
Ethnic Minorities
in Media
Key Media Facts

Ethnic minority participation
How good are the TV companies at Diversity?
A survey2 carried out in 2004 found that:
ITV

7% across ITV as a whole and 14% of staff in London were
from ethnic minority groups.

Channel 4

11.4% of all staff and 6% of senior staff were from ethnic minority backgrounds.

Five News

10% of staff on Five News were from ethnic minority backgrounds.

Sky

8.2% of Sky’s workforce was from an ethnic minority background and 9%
of Sky’s management team were from ethnic minority backgrounds.
In addition, 13% of Sky’s programming team were from an ethnic
minority background.

ITN

Two members of the senior management team were from an
ethnic minority background.

BBC

13% of new recruits were from an ethnic minority background.
Source: http://www.asiansinmedia.org/news/article.php/television/740

TV Milestones
	 	 

1975, Empire Road became the first black soap programme


1978, LWT set up the London Minorities Unit


1982, Channel 4 launched with minority brief
Source: http://news.bbc.co.uk/hi/english/static/in_depth/uk/2002/race/how_entertainment_changed.stm


According to a Weber Shandwick study, 77% of Asians, 78% of black people
and 51% of Chinese people in the UK say marketing by mainstream brands
has little or no relevance to them.

2

The figures and information below were provided by the broadcasters themselves.

08 I Race for Opportunity (RfO) | Ethnic Minorities in Media
Ethnic Minorities
in Media
Ethnic Minorities in Media

Figure 3: Representation of Ethnic Minorities in the Industry in each occupational group
Producing
Production
Journalism & Sport
Radio Broadcasting
Television Broadcasting
Programme Distribution
Transmission
Broadcast Engineering
Studio Operations
Interactive or Games Production
Interactive or Games Operations
Interactive or Games Business
Draw/Stop Frame Animation
2D/3D Computer Generated Animation
Art & Design
Camera
Costume/Wardrobe
Library/Archives
Lighting
Make Up& Hairdressing
Post Production
Sound
Special Physical Effects
Runner
Cinema Projectionists
Cinema Box Office/Kiosk/Attendants
Cinema Cleaners
Cinema Management/Head Office/Team Leaders
Film Distribution
Procesing Laboratories
All Other Occupational Groups
TOTAL

6.4%
5.4%
11.1%

2.2%

9.5%
9.2%
12.5%
3.2%
16.4%
6.0%

8.9%

5.1%
0.3%
5.3%

9.0%

3.9%
3.7%
2.3%
4.9%
3.0%

4.7%
8.2%

0.0%

7.0%
4.1%
12.3%
17.4%
11.6%
3.1%
19.0%
10.0%
7.4%

Source: Skillset - The Sector Skills Council for the Audio Visual Industries – Employment Census 2006

FAST FACTS

68.6%

79.0%

Representation also varies between occupational groups. Processing
laboratory staff have the highest representation of ethnic minorities
(19.0%), with cinema cleaners (17.4%) and other roles within cinema
exhibition also high. Studio operations (16.4%) and transmission
(12.5%) have also both seen a positive increase since 2004.
27.4%

Source: Skillset - The Sector Skills Council for the Audio Visual Industries – Employment Census 2006

09 I Race for Opportunity (RfO) | Ethnic Minorities in Media

16.0%

Media
All Subjects
Ethnic Minorities
in Media
Ethnic Minorities in Media

FAST FACTS
On the positive side, levels of employment of ethnic minorities are
above average in cable & satellite, processing laboratories and cinema
exhibition. However, at the other end of the scale, ethnic minorities
make up 5% or less of the workforce in animation, computer games,
offline multimedia, studio & equipment hire special physical effects
and film distribution.
Source: Skillset - The Sector Skills Council for the Audio Visual Industries – Employment Census 2006

Figure 4: Representation of Ethnic Minorities in the Industry in each sector
7.4%
7.3%
7.4%

Terrestrial TV

18.7%

Cable & Satellite Television

20.4%
5.1%
6.4%
5.8%
7.3%
5.6%
6.9%

Independent Production
(Television)
Broadcast Radio
Animation

2.1%
3.4%
2.6%

7.6%
6.8%
7.3%

Post Production
Special Physical Effects
Studio & Equipment Hire

0.7%

2.9%
1.6%
0.8%
1.8%

Web & Internet

Offline Multimedia

0.0%

All
4.2%

3.9%
2.7%

5.5%
4.9%

Commercials Production
3.4%

Corporate Production
Cinema Exhibition

6.0%
7.2%

9.7%

9.0%

5.9%

11.6%

0.0%

11.6%
2.9%

Film Distribution
Processing Laboratories

Freelancers

5.1%
6.5%
5.6%
6.7%
7.1%
6.8%
4.3%

Other Services for Film & TV

Computer Games

Employees

9.3%

3.8%

19.0%

0.0%

TOTAL

7.6%
7.0%
7.4%

Source: Skillset - The Sector Skills Council for the Audio Visual Industries – Employment Census 2006

10 I Race for Opportunity (RfO) | Ethnic Minorities in Media

19.0%

33.4%
Ethnic Minorities
in Media
Focus on Creative and Cultural Skills
In the UK advertising employs around 26,500
people and contributes £1.4 billion to the UK
economy each year.


About 70% of the industry’s workforce are based in London
94% of the advertising workforce is white

Design contributes £6.3 billion to the UK
economy and 180,000 people currently work
in the design industry.


33% are self employed and 20% are freelancers
95% of the design workforce is white

Music contributes £6 billion of GVA to the UK
economy and UK artists account for more than
half of all albums sold in the UK, and one in 12
albums sold in the US.
	 	 

96% of the music workforce is white

Literature contributes £2.3 billion to the UK
economy and 68,900 people currently work
in the literature industry.


32% of the workforce is freelance, and 62% self-employed
94% of the workforce is white

Source: Creative & Cultural Skills www..ccskills.org.uk

11 I Race for Opportunity (RfO) | Ethnic Minorities in Media
For further information on the Race for Opportunity campaign.
Please visit www.raceforopportunity.org.uk or telephone 020 7566 8661

Race for Opportunity
is part of Business
in the Community
© Race and produced by scs marketing | t: 01323 471050
designed for Opportunity February 2010ltddesign and print OSCCreative
designed and produced by scs marketing ltd || t: 01323 471050
Product code: 01RFO000436
Product code: 01OPP000435
00 I Race for Opportunity (RfO) | Race to the top

www.bitc.org.uk
information@bitc.org.uk

Registered Details
137 Shepherdess Walk, London N1 7RQ.
Telephone: 020 7566 8650
Registered Charity No: 297716.
Company Limited by Guarantee No: 1619253

Ethnic Minorities in the Media

  • 1.
  • 2.
    Ethnic Minorities in Media 1 ResearchSources and Assumptions 1.1 Source The data used in this factsheet is from the Higher Education Statistics Agency (HESA) student record database. The data covers the academic year of 2007 – 2008. Definitions of the various subject areas used in this factsheet can be found at: http://www.hesa.ac.uk/index.php/content/view/102/136/1/4 1.2 Assumptions The data used refers to UK domiciled students only; it does not include overseas students who are studying in the UK. Students falling under the ‘Unknown’ category have not been added to the White group or any of the ethnic minority groups. Instead, these have either been disregarded or represented as ‘Unknown’ in the analysis. Media related subjects include the following subjects: o o o 1.3 Mass communications and documentation Languages Creative arts and design Definitions The ethnic minority category groupings are based on Census 2001 categories. Please note in particular that: White includes: White Irish Traveller Mixed includes: Mixed – White and Black Caribbean Mixed – White and Black African Mixed – White and Asian Mixed – other Other includes: Other ethnic background Not Known includes: Not Known Information refused 02 I Race for Opportunity (RfO) | Ethnic Minorities in Media
  • 3.
    Ethnic Minorities in Media 2 EthnicMinorities in Media 2.1 Representation of Ethnic Minority Students in Media related subjects Our research shows that amongst the various ethnic minority groups studying media related subjects at UK universities during 2007–08, students of mixed ethnicity had by far the highest representation (3.0 percent), followed by Indian students (1.7 percent), Black African students (1.4 percent) and Black Caribbean students (1.3 percent). On the other hand, students from ‘Black Other’ backgrounds and students of Bangladeshi origins had the least representation among ethnic minority groups – (see figure 1). Figure 1: Representation of Ethnic Minority Students Studying Media Related Subjects (2007-08) 1.3% Black Caribbean 1.4% Black African Black Other 0.3% 1.7% Indian 0.7% Pakistani Bangladeshi 0.4% Chinese 0.7% Other Asian 0.7% 3% Mixed Other 0.9% Source: HESA Student Record (2007-08) The total ethnic minority representation of students studying media related subjects in 2007-08 was 11.0% compared to 84.7% of the White student population studying media related subjects during 2007-08. 03 I Race for Opportunity (RfO) | Ethnic Minorities in Media
  • 4.
    Ethnic Minorities in Media EthnicMinorities in Media We found that all ethnic minority groups, except the mixed ethnicity group, had a lower representation among students studying media related subjects, than among students studying all subjects. Other 0.9% Other Asian Background 0.7% 1.2% 0.9% Figure 2: Representation of Ethnic Minority Groups among Students Studying Media 3.0% Related subjects vis-à-vis All subjects (2007-08) Mixed Ethnicity 2.1% Other 0.9% 0.7% 0.9% 0.9% Chinese AsianMixed Ethnicity or Asian British - Bangladeshi 0.4% 0.6% Asian Background Other Asianor Asian British - Pakistani 0.7% 0.7% 1.2% Asian or Asian British - Indian Chinese Other Black Background Asian or Asian British - Bangladeshi Black or Black British - African Asian or Asian Black or Black British - Caribbean British - Pakistani 0.4% 0.3% 0.6% 0.7% 3.0% 1.9% 1.7% 0.7% 0.9% 0.3% 1.4% 3.3% 3.2% Media 1.3% 1.9% 1.4% 1.7% Asian or Asian British - Indian Other Black Background 2.1% All Subjects White Representation: Media – 84.7% All Subjects – 79.0% 3.3% 0.3% 0.3% Black or Black British - African 1.4% Black or Black British - Caribbean Total Ethnic Minority Representation: Media Media – 11.0% All Subjects All Subjects – 16.0% 1.3% 1.4% 3.2% Source: HESA Student Record (2007-08) FAST FACTS 68.6% 79.0% Black and minority ethnic (BAME) workers are under-represented in London’s audio visual (AV) industries. Ten per cent of the AV workforce in London is from a black or 27.4% ethnic16.0% even minority group, though a quarter of London’s workforce is made up of BAME workers. 68.6% 79.0% The figures are even lower in some parts of the industry e.g. in film production, the black and minority ethnic figure is only six per cent. Source: Working Lives Research Institute, London Metropolitan University ‘Institutional barriers to recruitment and employment in the audio visuals industries’ January 2007 27.4% 04 I Race for Opportunity (RfO) | Ethnic Minorities in Media 16.0%
  • 5.
    2.2 Ethnic Minorities inMedia UK Universities with the Highest Proportion of Ethnic Minority Students studying Media related subjects In 2007/2008 there were 1.9 million UK domiciled students at UK universities of which 15 per cent (290,912.30) were studying media related subjects1. Mixed Other % of total BAME Media Students Whites Table 1 shows the top 25 universities ranked by the proportion of students from ethnic minority groups studying media related subjects (2007-08). University College Birmingham had the highest proportion (50.9 percent) of ethnic minority students among students studying media related subjects, followed by University of East London (45.8 percent) and Brunel University (44.3 percent). These 25 universities constituted 43.3 percent of the total population of ethnic minority students studying media related subjects at UK universities. Black African Black Other Indian Pakistani Bangladeshi Chinese Asian Other Table 1: Universities Ranked by Proportion of Ethnic Minority Students studying Media related subjects (2007–08) Top 25 Universities Black Caribbean The most popular areas of study for this cohort were ‘subjects allied to medicine’ (14%) followed by Business & Administrative Studies (11%) and Education (10%). The least popular subject was Veterinary Science (0.2%). Source: HESA Student Record 1 All Ethnic Minorities
  • 6.
    Ethnic Minorities inMedia 2.3 Russell Group Universities with the Highest Proportion of Ethnic Minority Students studying Media % of total BAME Media Students Whites Table 2 shows the percentage of students studying media related subjects from each ethnic minority group at Russell Group universities. London School of Economics and Political Science (LSE) had the highest proportion (26.9 percent) of ethnic minority students, followed by King’s College London (19.8 percent) and University College London (15.6 percent). Russell Group universities constitute 11.9 percent of the total ethnic minority students studying media related subjects at UK universities. Black Caribbean Black African Black Other Indian Pakistani Bangladeshi Chinese Asian Other Mixed Other Table 2: Russell Group Universities Ranked by Proportion of Students from Ethnic Minorities studying Media Related Subjects (2007–08) Russell Universities Source: HESA Student Record All Ethnic Minorities
  • 7.
    Ethnic Minorities in Media What’sclass got to do with it? Of the top 100 journalists in 2006, 54% were independently educated an increase from 49% in 1986. Source: The Sutton Trust -The Educational Backgrounds of Leading Journalists, June 2006 A separate survey of leading journalists and editors suggests that the latest new recruits to the national news media are even more likely to come from privileged backgrounds than those from previous generations. Reasons for this range from: low pay and insecurity at junior levels; the high costs of living in London; the increasing costs of postgraduate courses; a bias towards those with family or personal connections within the industry amid a largely informal but highly competitive recruitment process; and finally, the stronger skills and attributes exhibited at an earlier age by those from private schools. Source: The Sutton Trust -The Educational Backgrounds of Leading Journalists, June 2006 Some Household Names and their Educational Background News Presenters/Correspondents: Name Jeremy Paxman John Simpson Jon Snow Organisation BBC Newsnight BBC Channel 4 News David Dimbleby BBC Question Time Fiona Bruce BBC School Malvern College St. Pauls St Edwards Chichester High for Boys Glengorse, Battle; Charterhouse Hatcham Girls, New Cross School Type IND IND University Cambridge Cambridge IND Liverpool IND Oxford SEL Oxford Ardingly College St. Dunstan’s College Dulwich College Clifton College Cranleigh IND IND IND IND IND Oxford Oxford Oxford Oxford Cambridge Newspaper Editors: Ian Hislop Matthew d’Ancona Lionel Barber Roger Alton Alan Rusbridger Private Eye Spectator Financial Times Observer Guardian Source: The Sutton Trust -The Educational Backgrounds of Leading Journalists, June 2006 Private schools make up only 7 per cent of the country’s secondary school population. Yet they produce well over half of the country’s top news journalists. Source: The SuttonTrust -The Educational Backgrounds of Leading Journalists, June 2006 07 I Race for Opportunity (RfO) | Ethnic Minorities in Media
  • 8.
    Ethnic Minorities in Media KeyMedia Facts Ethnic minority participation How good are the TV companies at Diversity? A survey2 carried out in 2004 found that: ITV 7% across ITV as a whole and 14% of staff in London were from ethnic minority groups. Channel 4 11.4% of all staff and 6% of senior staff were from ethnic minority backgrounds. Five News 10% of staff on Five News were from ethnic minority backgrounds. Sky 8.2% of Sky’s workforce was from an ethnic minority background and 9% of Sky’s management team were from ethnic minority backgrounds. In addition, 13% of Sky’s programming team were from an ethnic minority background. ITN Two members of the senior management team were from an ethnic minority background. BBC 13% of new recruits were from an ethnic minority background. Source: http://www.asiansinmedia.org/news/article.php/television/740 TV Milestones 1975, Empire Road became the first black soap programme 1978, LWT set up the London Minorities Unit 1982, Channel 4 launched with minority brief Source: http://news.bbc.co.uk/hi/english/static/in_depth/uk/2002/race/how_entertainment_changed.stm According to a Weber Shandwick study, 77% of Asians, 78% of black people and 51% of Chinese people in the UK say marketing by mainstream brands has little or no relevance to them. 2 The figures and information below were provided by the broadcasters themselves. 08 I Race for Opportunity (RfO) | Ethnic Minorities in Media
  • 9.
    Ethnic Minorities in Media EthnicMinorities in Media Figure 3: Representation of Ethnic Minorities in the Industry in each occupational group Producing Production Journalism & Sport Radio Broadcasting Television Broadcasting Programme Distribution Transmission Broadcast Engineering Studio Operations Interactive or Games Production Interactive or Games Operations Interactive or Games Business Draw/Stop Frame Animation 2D/3D Computer Generated Animation Art & Design Camera Costume/Wardrobe Library/Archives Lighting Make Up& Hairdressing Post Production Sound Special Physical Effects Runner Cinema Projectionists Cinema Box Office/Kiosk/Attendants Cinema Cleaners Cinema Management/Head Office/Team Leaders Film Distribution Procesing Laboratories All Other Occupational Groups TOTAL 6.4% 5.4% 11.1% 2.2% 9.5% 9.2% 12.5% 3.2% 16.4% 6.0% 8.9% 5.1% 0.3% 5.3% 9.0% 3.9% 3.7% 2.3% 4.9% 3.0% 4.7% 8.2% 0.0% 7.0% 4.1% 12.3% 17.4% 11.6% 3.1% 19.0% 10.0% 7.4% Source: Skillset - The Sector Skills Council for the Audio Visual Industries – Employment Census 2006 FAST FACTS 68.6% 79.0% Representation also varies between occupational groups. Processing laboratory staff have the highest representation of ethnic minorities (19.0%), with cinema cleaners (17.4%) and other roles within cinema exhibition also high. Studio operations (16.4%) and transmission (12.5%) have also both seen a positive increase since 2004. 27.4% Source: Skillset - The Sector Skills Council for the Audio Visual Industries – Employment Census 2006 09 I Race for Opportunity (RfO) | Ethnic Minorities in Media 16.0% Media All Subjects
  • 10.
    Ethnic Minorities in Media EthnicMinorities in Media FAST FACTS On the positive side, levels of employment of ethnic minorities are above average in cable & satellite, processing laboratories and cinema exhibition. However, at the other end of the scale, ethnic minorities make up 5% or less of the workforce in animation, computer games, offline multimedia, studio & equipment hire special physical effects and film distribution. Source: Skillset - The Sector Skills Council for the Audio Visual Industries – Employment Census 2006 Figure 4: Representation of Ethnic Minorities in the Industry in each sector 7.4% 7.3% 7.4% Terrestrial TV 18.7% Cable & Satellite Television 20.4% 5.1% 6.4% 5.8% 7.3% 5.6% 6.9% Independent Production (Television) Broadcast Radio Animation 2.1% 3.4% 2.6% 7.6% 6.8% 7.3% Post Production Special Physical Effects Studio & Equipment Hire 0.7% 2.9% 1.6% 0.8% 1.8% Web & Internet Offline Multimedia 0.0% All 4.2% 3.9% 2.7% 5.5% 4.9% Commercials Production 3.4% Corporate Production Cinema Exhibition 6.0% 7.2% 9.7% 9.0% 5.9% 11.6% 0.0% 11.6% 2.9% Film Distribution Processing Laboratories Freelancers 5.1% 6.5% 5.6% 6.7% 7.1% 6.8% 4.3% Other Services for Film & TV Computer Games Employees 9.3% 3.8% 19.0% 0.0% TOTAL 7.6% 7.0% 7.4% Source: Skillset - The Sector Skills Council for the Audio Visual Industries – Employment Census 2006 10 I Race for Opportunity (RfO) | Ethnic Minorities in Media 19.0% 33.4%
  • 11.
    Ethnic Minorities in Media Focuson Creative and Cultural Skills In the UK advertising employs around 26,500 people and contributes £1.4 billion to the UK economy each year. About 70% of the industry’s workforce are based in London 94% of the advertising workforce is white Design contributes £6.3 billion to the UK economy and 180,000 people currently work in the design industry. 33% are self employed and 20% are freelancers 95% of the design workforce is white Music contributes £6 billion of GVA to the UK economy and UK artists account for more than half of all albums sold in the UK, and one in 12 albums sold in the US. 96% of the music workforce is white Literature contributes £2.3 billion to the UK economy and 68,900 people currently work in the literature industry. 32% of the workforce is freelance, and 62% self-employed 94% of the workforce is white Source: Creative & Cultural Skills www..ccskills.org.uk 11 I Race for Opportunity (RfO) | Ethnic Minorities in Media
  • 12.
    For further informationon the Race for Opportunity campaign. Please visit www.raceforopportunity.org.uk or telephone 020 7566 8661 Race for Opportunity is part of Business in the Community © Race and produced by scs marketing | t: 01323 471050 designed for Opportunity February 2010ltddesign and print OSCCreative designed and produced by scs marketing ltd || t: 01323 471050 Product code: 01RFO000436 Product code: 01OPP000435 Product code: 01OPP000435 00 I Race for Opportunity (RfO) | Race to the top www.bitc.org.uk information@bitc.org.uk Registered Details 137 Shepherdess Walk, London N1 7RQ. Telephone: 020 7566 8650 Registered Charity No: 297716. Company Limited by Guarantee No: 1619253