SlideShare a Scribd company logo
1 of 55
Download to read offline
4.
5.
6.
7.
8.
9.
10.
11.
12.
13.
14.
15.
Laying Out the Project
To figure out how much time the project will take, we have to lay out the ac-
tivities in the order we expect to complete them. To do this, write each activity
on a separate sticky note. Create a sticky note labeled “Start” and one named
“Finish.” Stick the “Start” note on your whiteboard or flip chart, and begin
adding the activities until you reach “Finish.” Draw connecting lines to show
the dependency relationships among the activities. Exhibit 3–5 shows a completed
network diagram for the work package “FDA Application.”
52 SUCCESSFUL PROJECT MANAGEMENT
© American Management Association. All rights reserved.
http://www.amanet.org/
xhibit 3–5
Network Diagram
Start
FInish
1.
Assign
Team
2. Obtain
Raw
Data
3.
ezinagrO
Data
4.
Prepare
Index
5. Write
Summary
Sections
6. Review
Summary
Sections
7. Draft
Overall
Summary
8.
Review
1st Draft
9.
Rewrite
Summary
10.
Review
2nd Draft
11. Write
Final
12. Final
Signoff
13. Print
Data
14.
Submit
Exercise 3–4 continued from previous page.
Copyright2015.AMASelf-Study.
Allrightsreserved.Maynotbereproducedinanyformwithoutpermissionfromthepublisher,exceptfairusespermittedunderU.S.orapplicablecopyrightlaw.
EBSCO Publishing : eBook Collection (EBSCOhost) - printed on 10/19/2019 3:57 PM via UNIVERSIDAD NACIONAL ABIERTA Y A DISTANCIA - UNAD
AN: 1520886 ; Dobson, Michael Singer.; Successful Project Management : How to Complete Projects on Time, on Budget, and on Target
Account: ns145102.main.eds
Instructions: Take the items from the activity list you prepared in Exercise 3–4. Write the activities
on sticky notes, with one activity per note. Add two additional notes for “Start” and “Finish.” Use
these notes to prepare a network diagram for the PMO project.
Determining the Critical Path
When two or more activities take place during the same time period (parallel
activities), only the longest path of activities (known as the critical path) deter-
mines how long the project will take.
In Exhibit 3–6, we’ve assigned time estimates to each activity. Notice that
the path Start 2 3 4 7 takes 0 + 4 + 12 + 3 + 2, or 21, weeks. The par-
allel path Start 1 5 6 7 takes 0 + 1 + 4 + 8 + 2, or 15, weeks. We say
that Start 2 3 4 7 is part of the critical path, which means we expect that
part of the project to take 21 weeks to accomplish. If any of those critical path
activities run longer than expected, the whole project will take longer to ac-
complish.
What if Activities 1, 5, or 6 take longer than expected? As long as their
combined lateness doesn’t exceed six weeks, our project is still on schedule!
We say that the path segment 1 5 6 has six weeks of slack or float. (“Slack”
and “float” are synonyms. One term comes from CPM and the other from
PERT, but they both describe the same thing.)
Knowing the critical path tells you two things: first, how long the project
is expected to take, and second, which activities have to stay on schedule in
order to achieve that time estimate. Because you have extra time to complete
activities with slack or float, you can worry less about them. In some cases,
Exercise 3–5
Network Diagram
PLANNING THE ACTIVITIES 53
© American Management Association. All rights reserved.
http://www.amanet.org/
Critical activities are shown in solid black; noncritical activities (those with slack or float) are shown
in gray.
xhibit 3–6
Critical Path
Start
FInish
1.
Assign
Team
2. Obtain
Raw
Data
3.
ezinagrO
Data
4.
Prepare
Index
5. Write
Summary
Sections
6. Review
Summary
Sections
7. Draft
Overall
Summary
8.
Review
1st Draft
9.
Rewrite
Summary
10.
Review
2nd Draft
11. Write
Final
12. Final
Signoff
13. Print
Data
14.
Submit
0 weeks
0 weeks
1 weeks
4 weeks 12 weeks
4 weeks 8 weeks
3 weeks
2 weeks 6 weeks 2 weeks 6 weeks 2 weeks
3 weeks
6 weeks
1 weeks
Total Time = 60 weeks
Critical Path = 44 weeks
Slack/Float = 6 weeks
Slack/Float = 3 weeks
Copyright2015.AMASelf-Study.
Allrightsreserved.Maynotbereproducedinanyformwithoutpermissionfromthepublisher,exceptfairusespermittedunderU.S.orapplicablecopyrightlaw.
EBSCO Publishing : eBook Collection (EBSCOhost) - printed on 10/19/2019 3:57 PM via UNIVERSIDAD NACIONAL ABIERTA Y A DISTANCIA - UNAD
AN: 1520886 ; Dobson, Michael Singer.; Successful Project Management : How to Complete Projects on Time, on Budget, and on Target
Account: ns145102.main.eds
you can even move resources from an activity with lots of slack to an activity
on the critical path as a way to make sure you stay on schedule.
Remember that cost isn’t affected by the critical path. If you spend extra
money on a noncritical activity, it has the same effect as if you spend extra
money on a critical one.
Although we haven’t yet estimated the duration of the various activities on the PMO project, what
is your current feeling about the time constraint based on your current network diagram? Is it com-
fortable, tight, or impossible? What makes you think so?
Additional Scheduling Relationships
All the relationships in our existing network diagram are of the type known
as “finish to start” (FS), which means that the successor activity can’t start
until the predecessor activity is finished. That’s by far the most common type
of relationship, but it isn’t the only one.
Finish to finish (FF) relationships describe situations in which one activity
can’t finish until its predecessor activity has finished. In cooking Thanksgiving
dinner, you don’t want to start the potatoes as soon as you put the turkey in
the oven, but rather time the potatoes so that they finish at the same time.
Start to start relationships (SS) say that an activity can’t start until its pred-
ecessor has started. Let’s say you want to make a hundred widgets and put
them in boxes. You don’t have to have all the widgets done before you put the
first one in a box, but you do need some of them.
Lag is additional time added to a relationship. In our widget example, you
could start boxing the widgets two days after you start making them. That’s a
start-to-start relationship with a two-day lag.
Lead is when you overlap two activities. You could start making the pota-
toes an hour before you finish cooking the turkey. Instead of a finish-to-finish
relationship, this is now a finish-to-start relationship with a one-hour lead.
Imposed dates are conditions when an outside date overrules a relationship.
If you’re putting a swimming pool in the back yard and order a truckload of
concrete, it doesn’t matter if you finish digging the hole early—the truck won’t
come until it’s scheduled. If you finish the hole a day late, the consequences
are much greater than a single day; you have to wait until the truck can come
back and you may have to pay for the unused concrete.
Think About It . . . Will You Make the Deadline?
54 SUCCESSFUL PROJECT MANAGEMENT
© American Management Association. All rights reserved.
http://www.amanet.org/
Copyright2015.AMASelf-Study.
Allrightsreserved.Maynotbereproducedinanyformwithoutpermissionfromthepublisher,exceptfairusespermittedunderU.S.orapplicablecopyrightlaw.
EBSCO Publishing : eBook Collection (EBSCOhost) - printed on 10/19/2019 3:57 PM via UNIVERSIDAD NACIONAL ABIERTA Y A DISTANCIA - UNAD
AN: 1520886 ; Dobson, Michael Singer.; Successful Project Management : How to Complete Projects on Time, on Budget, and on Target
Account: ns145102.main.eds
Forward and Backward Pass
For a lot of projects, it’s easy enough to find the critical path with a little in-
spection. In Exhibit 3–6, there are only two short segments where there are
multiple paths, and all you have to do is to compare the length of the top and
bottom segments.
For large projects, you’ll most likely use scheduling software, such as Mi-
crosoft Project®. It will automatically determine the critical path once you’ve
entered the duration and predecessor(s) of each activity. However, sometimes
you’ll have a project that falls somewhere in between, so it’s useful to know how
to calculate the critical path by hand. For that, you need to know how to perform
a forward and backward pass. Exhibit 3–7 shows a sample project without any task
names so you can just watch the numbers and learn how this process works.
Forward Pass
If an activity has slack or float, there is flexibility in the start and finish dates.
The early start is the earliest the activity can start considering its predecessors,
and the early finish is simply the early start plus the duration. The late finish is
the latest date an activity can finish without affecting the critical path, and
the late start is the late finish minus the duration.
The forward pass calculates early start and early finish; the backward pass
calculates late start and late finish. An activity is critical if the early/late start
and early/late finish are the same. If there’s a difference, the amount of the
difference is how much slack or float exists for that activity.
Exhibit 3–7 shows a forward pass calculation. The top center number in
each box is the duration. The top left number is the early start; the top right
number is the early finish.
PLANNING THE ACTIVITIES 55
© American Management Association. All rights reserved.
http://www.amanet.org/
Source: Adapted from Managing Multiple Projects by Dobson and Dobson ©2011. Used by permission of the publisher, AMACOM Books, a division of
American Management Association, New York, New York. All rights reserved. www.amacombooks.org
xhibit 3–7
Forward Pass
Copyright2015.AMASelf-Study.
Allrightsreserved.Maynotbereproducedinanyformwithoutpermissionfromthepublisher,exceptfairusespermittedunderU.S.orapplicablecopyrightlaw.
EBSCO Publishing : eBook Collection (EBSCOhost) - printed on 10/19/2019 3:57 PM via UNIVERSIDAD NACIONAL ABIERTA Y A DISTANCIA - UNAD
AN: 1520886 ; Dobson, Michael Singer.; Successful Project Management : How to Complete Projects on Time, on Budget, and on Target
Account: ns145102.main.eds
Start with the first activity, “Activity A,” which always has an early start
of zero. Its duration is zero; it finishes at zero. (An activity with a duration of
zero is called a milestone.) Activities B and C are both dependent on A; they
can’t start until A is finished. Because A is a milestone, B and C both start at
zero as well. Because B has a duration of 15 days, its early finish is 15; C’s
early finish is 11.
Activity D is dependent on both B and C. Its early start is the latest of the
early finishes of its predecessors. It therefore starts at 15, and 15 + 21 = 36, its
early finish. E, on the other hand, only requires that C be finished, so its early
start is 11, add 9, and its early finish is 20.
Activity F only needs D. It starts at 36, adds 8, and ends at 44. G needs
both D and E, so it begins at 36 (the later of the two predecessors) and ends
at 48 (36 + 12). The last activity, H, needs both F and G. It takes the G finish
of 48, adds 2, and now we know the duration of the project: 50 days. Exhibit
3–8 summarizes all these numbers.
Backward Pass
For the backward pass, we start with the end of the project and work backward
to the start, figuring out the late finish and late start of each activity. Exhibit
3–9 shows how it works. The numbers are summarized in Exhibit 3–10.
56 SUCCESSFUL PROJECT MANAGEMENT
© American Management Association. All rights reserved.
http://www.amanet.org/
xhibit 3–8
Forward Pass Summary
Activity
Takes Early Start
from Early Finish of:
Early Start (plus) Duration = Early Finish
A N/A 0 0 0
B A 0 15 15
C A 0 11 11
D Larger of C or D 15 21 36
E C 11 9 20
F D 36 8 44
G Larger of D or E 36 12 48
H Larger of F or G 48 2 50
Copyright2015.AMASelf-Study.
Allrightsreserved.Maynotbereproducedinanyformwithoutpermissionfromthepublisher,exceptfairusespermittedunderU.S.orapplicablecopyrightlaw.
EBSCO Publishing : eBook Collection (EBSCOhost) - printed on 10/19/2019 3:57 PM via UNIVERSIDAD NACIONAL ABIERTA Y A DISTANCIA - UNAD
AN: 1520886 ; Dobson, Michael Singer.; Successful Project Management : How to Complete Projects on Time, on Budget, and on Target
Account: ns145102.main.eds
PLANNING THE ACTIVITIES 57
© American Management Association. All rights reserved.
http://www.amanet.org/
Source: Adapted from Managing Multiple Projects by Dobson and Dobson ©2011. Used by permission of the publisher, AMACOM Books, a division of
American Management Association, New York, New York. All rights reserved. www.amacombooks.org
xhibit 3–9
Backward Pass
xhibit 3–10
Backward Pass Summary
Activity
Takes Late Finish
from Late Start of
Late Finish (minus) Duration Late Start
H Early Finish of H 50 2 48
G H 48 12 36
F H 48 8 40
E G 36 9 27
D Lesser of F or G 36 21 15
C Lesser of D or E 15 11 4
B D 15 15 0
A Lesser of B or C 0 0 0
Copyright2015.AMASelf-Study.
Allrightsreserved.Maynotbereproducedinanyformwithoutpermissionfromthepublisher,exceptfairusespermittedunderU.S.orapplicablecopyrightlaw.
EBSCO Publishing : eBook Collection (EBSCOhost) - printed on 10/19/2019 3:57 PM via UNIVERSIDAD NACIONAL ABIERTA Y A DISTANCIA - UNAD
AN: 1520886 ; Dobson, Michael Singer.; Successful Project Management : How to Complete Projects on Time, on Budget, and on Target
Account: ns145102.main.eds
For Activity H, the late finish is 50 days, and so the late start is 50 – 2, or
48. That number becomes the late finish for both F and G. For F, take the late
finish of 48, subtract 8, and the late start is 40. For G, 48 – 12 = 36.
Going backward, you pretend as if the arrows are reversed. If you have
more than one activity feeding a predecessor, this time you pass the lowest
number. Activity D’s late finish is governed by G’s 36, rather than F’s 40, and
36 – 21 = 15. E only cares about G, so its late finish is 36 and its early finish
is 27. However, it’s the late start of D that matters to both B and C. Both ac-
tivities have a late finish of 15; B’s late start is zero and C’s late start is 4. The
milestone, Activity A, ends up with a late finish and a late start of zero.
Critical Path and Float
Exhibit 3–11 puts all the numbers in their proper places. Now, we’ll determine
the critical path and float. To start, let’s compare the late and early figures for
each activity. The difference is zero for Activities A, B, D, G, and H. Those
activities make up the critical path.
Activities C, E, and F have float. For C, it’s four days (4 – 0 = 4). For E,
27 – 11 = 16 days of float. F has four days of float (40 – 36) as well. The num-
bers are summarized in Exhibit 3–12.
By the way, there’s a difference between total float, which is what we’ve
just calculated, and free float. Let’s imagine that Activity C uses its float, and
ends on day 15. Activity D, on the critical path, is unaffected. Activity E, with
16 days of float available, is also in good shape, but notice that because C is
late, E has lost four of those 16 days even before it starts. C’s float is not free
float, because it eats up some of E’s float. Activity F, on the other hand, has four
58 SUCCESSFUL PROJECT MANAGEMENT
© American Management Association. All rights reserved.
http://www.amanet.org/
Source: Adapted from Managing Multiple Projects by Dobson and Dobson ©2011. Used by permission of the publisher, AMACOM Books, a division of
American Management Association, New York, New York. All rights reserved. www.amacombooks.org
xhibit 3–11
Critical Path and Float
Copyright2015.AMASelf-Study.
Allrightsreserved.Maynotbereproducedinanyformwithoutpermissionfromthepublisher,exceptfairusespermittedunderU.S.orapplicablecopyrightlaw.
EBSCO Publishing : eBook Collection (EBSCOhost) - printed on 10/19/2019 3:57 PM via UNIVERSIDAD NACIONAL ABIERTA Y A DISTANCIA - UNAD
AN: 1520886 ; Dobson, Michael Singer.; Successful Project Management : How to Complete Projects on Time, on Budget, and on Target
Account: ns145102.main.eds
days of float, but if it uses all four days, Activity H still starts when scheduled.
Because none of Activity F’s float comes from H, it is considered free float.
Notice that in the case of Activity C, it can start as early as day 0 but can
start as late as day 4. It has four days of total float; extra time before lateness
jeopardizes the project deadline. However, if Activity C uses any of its float, the
float available for Activity E is reduced because E will no longer start on Day
11. The float is shared, not free. The float in E and F, however, is free float, be-
cause no other activity is affected if those activities use their available float. Ex-
ercise 3–6 gives you an opportunity to practice the forward and backward pass.
Instructions: Perform a forward and backward pass on the following figure. Determine the critical
path and identify available float.
Exercise 3–6
Identify Critical Path and Float
PLANNING THE ACTIVITIES 59
© American Management Association. All rights reserved.
http://www.amanet.org/
Exercise 3–6 continues on next page.
Note that you will get the same answers if you use “Late Finish” and “Early Finish” instead.
xhibit 3–12
Critical Path and Float Summary
Activity Late Start
(minus)
Early Start
Float Critical?
A 0 0 0 Critical
B 0 0 0 Critical
C 4 0 4 Noncritical
D 15 15 0 Critical
E 27 11 16 Noncritical
F 40 36 4 Noncritical
G 36 36 0 Critical
H 48 48 0 Critical
Copyright2015.AMASelf-Study.
Allrightsreserved.Maynotbereproducedinanyformwithoutpermissionfromthepublisher,exceptfairusespermittedunderU.S.orapplicablecopyrightlaw.
EBSCO Publishing : eBook Collection (EBSCOhost) - printed on 10/19/2019 3:57 PM via UNIVERSIDAD NACIONAL ABIERTA Y A DISTANCIA - UNAD
AN: 1520886 ; Dobson, Michael Singer.; Successful Project Management : How to Complete Projects on Time, on Budget, and on Target
Account: ns145102.main.eds
Source: Adapted from Managing Multiple Projects by Dobson and Dobson ©2011. Used by permission of the publisher, AMACOM Books, a division of
American Management Association, New York, New York. All rights reserved. www.amacombooks.org
GANTT CHART
A Gantt chart is a timeline of project activities drawn as a bar chart over a
calendar grid. Exhibit 3–13 shows a simple Gantt chart.
As we mentioned earlier, a Gantt chart is very easy to produce if you
have already done a network diagram. Create a table with a list of the activi-
ties, the duration of each, and the predecessor or predecessors of each. Exhibit
3–14 shows you such a table, as developed from the network diagram in Ex-
hibit 3–11.
To build a Gantt chart using project management software, you simply
enter this information in the appropriate columns and you’re done. To build
a Gantt chart by hand, create a calendar grid and draw each activity as a
straight line or bar from its start (determined by its predecessors) to its end
(determined by its duration). If the duration of an activity is zero, it’s a mile-
stone. The traditional symbol for a milestone in project management is a di-
amond ( ).
The sample Gantt chart in Exhibit 3–13 shows arrows connecting the
end of each line to the activity that’s dependent on it. This is optional. Exhibit
3–15 shows a Gantt chart built from the table in Exhibit 3–14.
60 SUCCESSFUL PROJECT MANAGEMENT
© American Management Association. All rights reserved.
http://www.amanet.org/
Exercise 3–6 continued from previous page.
Copyright2015.AMASelf-Study.
Allrightsreserved.Maynotbereproducedinanyformwithoutpermissionfromthepublisher,exceptfairusespermittedunderU.S.orapplicablecopyrightlaw.
EBSCO Publishing : eBook Collection (EBSCOhost) - printed on 10/19/2019 3:57 PM via UNIVERSIDAD NACIONAL ABIERTA Y A DISTANCIA - UNAD
AN: 1520886 ; Dobson, Michael Singer.; Successful Project Management : How to Complete Projects on Time, on Budget, and on Target
Account: ns145102.main.eds
PLANNING THE ACTIVITIES 61
© American Management Association. All rights reserved.
http://www.amanet.org/
Credit: Gantt chart created using MindView Business Edition, authored by V. Heilman in 2011. Used under the Creative Commons Attribution-Share Alike
3.0 Unported license. Retrieved from http://commons.wikimedia.org/wiki/File:Gantt_chart_example.png, 5 August 2013.
xhibit 3–13
Gantt Chart
xhibit 3–14
Gantt Chart Data
Source: Adapted from Managing Multiple Projects by Dobson and Dobson ©2011. Used by permission of the publisher, AMACOM Books, a division of
American Management Association, New York, New York. All rights reserved. www.amacombooks.org
xhibit 3–15
Completed Gantt Chart
Task Dur. Pred. 1 2 3 4 5 6 7 8 9 10 11 12 13 14 15 16 17 18 19 20 21 22 23 24 25 26 27 28 29 30 31 32 33 34 35 36 37 38 39 40 41 42 43 44 45 46 47 48 49 50
Task A 0d —
Task B 15d A
Task C 11d A
Task D 21d B,C
Task E 9d C
Task F 8d D
Task G 12d D,E
Task H 2d F,G
GANTT CHART
Activity Duration Predecessor(s)
A 0 N/A
B 15d A
C 11d A
D 21d B, C
E 9d C
F 8d D
G 12d E, G
H 2d F, G
Copyright2015.AMASelf-Study.
Allrightsreserved.Maynotbereproducedinanyformwithoutpermissionfromthepublisher,exceptfairusespermittedunderU.S.orapplicablecopyrightlaw.
EBSCO Publishing : eBook Collection (EBSCOhost) - printed on 10/19/2019 3:57 PM via UNIVERSIDAD NACIONAL ABIERTA Y A DISTANCIA - UNAD
AN: 1520886 ; Dobson, Michael Singer.; Successful Project Management : How to Complete Projects on Time, on Budget, and on Target
Account: ns145102.main.eds
Instructions: Take the network diagram from Exercise 3–6 and turn it into a Gantt chart.
Activity Duration Predecessor(s)
Exercise 3–7
Draw a Gantt Chart
Task 1 2 3 4 5 6 7 8 9 10 11 12 13 14 15 16 17 18 19 20 21
62 SUCCESSFUL PROJECT MANAGEMENT
© American Management Association. All rights reserved.
http://www.amanet.org/
Copyright2015.AMASelf-Study.
Allrightsreserved.Maynotbereproducedinanyformwithoutpermissionfromthepublisher,exceptfairusespermittedunderU.S.orapplicablecopyrightlaw.
EBSCO Publishing : eBook Collection (EBSCOhost) - printed on 10/19/2019 3:57 PM via UNIVERSIDAD NACIONAL ABIERTA Y A DISTANCIA - UNAD
AN: 1520886 ; Dobson, Michael Singer.; Successful Project Management : How to Complete Projects on Time, on Budget, and on Target
Account: ns145102.main.eds
Project planning is an iterative process. You need an initial
draft of a project plan in order to develop a final one. The
process begins by developing a project statement of work
(SOW), a narrative description of the project. In technology
and construction projects, you often need to prepare a re-
quirements document and requirements traceability matrix,
but this is not required in all cases.
The work breakdown structure (WBS) is at the core of effective project
management. Whether done in an org chart or outline format, it decomposes
the project into manageable components and organizes the work of the project
to make it easier to manage. Both top-down and bottom-up approaches are
used in developing a project WBS. The WBS can be organized by department
or skill area, phase, or many other ways; there is seldom only one right WBS
for a given project. Follow the 100% rule and make sure that each level of de-
composition includes 100% of the scope needed for each higher level. If
something isn’t in the WBS, it won’t be in the project.
Although Gantt charts are more frequently used for project scheduling,
a network diagram is easier to create and can be turned into a Gantt chart
when finalized. To build a network diagram, you must create an activity list
from your WBS, then arrange the activities in the order you plan to perform
them.
Activities can be dependent on other activities or parallel to them, de-
pending on the nature of the work and your choices. Most activity relation-
ships are “finish to start” (the successor activity can’t start until the predecessor
activity is finished), but “start to start” and “finish to finish” relationships are
also possible. Relationships can be adjusted by adding lag time or subtracting
lead time. Some project activities have “imposed dates” that override normal
activity relationships.
The critical path is the longest path from the project start to the project
finish. If any activity on the critical path is delayed, the deadline is jeopardized.
Other parallel activities may have slack or float, or extra time to complete
them before they, too, become critical.
In simple projects, it’s usually easy to spot the critical path. In very com-
plex projects, use project management software to find the critical path and
identify slack or float. You can determine the critical path, slack, and float
manually by using the forward and backward pass technique.
PLANNING THE ACTIVITIES 63
© American Management Association. All rights reserved.
http://www.amanet.org/
Copyright2015.AMASelf-Study.
Allrightsreserved.Maynotbereproducedinanyformwithoutpermissionfromthepublisher,exceptfairusespermittedunderU.S.orapplicablecopyrightlaw.
EBSCO Publishing : eBook Collection (EBSCOhost) - printed on 10/19/2019 3:57 PM via UNIVERSIDAD NACIONAL ABIERTA Y A DISTANCIA - UNAD
AN: 1520886 ; Dobson, Michael Singer.; Successful Project Management : How to Complete Projects on Time, on Budget, and on Target
Account: ns145102.main.eds
To prepare a WBS, you should: 1. (d)1.
use a top-down approach.(a)
make sure each category has the same number of levels.(b)
organize the project scope into an outline structure.(c)
decompose the total project scope into a hierarchy.(d)
An example of a nonfunctional requirement is: 2. (b)2.
the type of material to be used.(a)
ease of use of the final product.(b)
a maintenance manual for the product.(c)
mean time between failures.(d)
What is a parallel activity? 3. (a)3.
An activity performed at the same time as another activity(a)
An activity that is necessary but outside the scope of the project(b)
An activity that must directly follow another activity(c)
An activity that contains slack or float(d)
The project statement of work (SOW) is: 4. (b)4.
the hierarchical decomposition of the project work.(a)
a narrative description of the project scope.(b)
an activity list of the work that must be completed.(c)
the requirements traceability matrix for the project.(d)
What is the late finish of an activity? 5. (a)5.
The latest an activity can finish without delaying a critical(a)
path activity
An activity that has missed its deadline(b)
The latest an activity can start based on its relationship(c)
to predecessor activities
The date a parallel activity can begin(d)
Review Questions
64 SUCCESSFUL PROJECT MANAGEMENT
© American Management Association. All rights reserved.
http://www.amanet.org/
Copyright2015.AMASelf-Study.
Allrightsreserved.Maynotbereproducedinanyformwithoutpermissionfromthepublisher,exceptfairusespermittedunderU.S.orapplicablecopyrightlaw.
EBSCO Publishing : eBook Collection (EBSCOhost) - printed on 10/19/2019 3:57 PM via UNIVERSIDAD NACIONAL ABIERTA Y A DISTANCIA - UNAD
AN: 1520886 ; Dobson, Michael Singer.; Successful Project Management : How to Complete Projects on Time, on Budget, and on Target
Account: ns145102.main.eds
4EstimatingtheActivities
Learning Objectives
By the end of this chapter, you should be able to:
• Describe the process of progressively elabo-
rating the initial project plan.
• Define the difference between rough order of
magnitude, preliminary, and definitive esti-
mates and give circumstances in which each
is appropriate.
• Explain standard estimating techniques of
analogous estimating, expert judgment esti-
mating, Delphi method estimating, paramet-
ric estimating, and bottom-up estimating.
• Define three-point estimating and the two
methods that use it; perform PERT calcula-
tions using three-point estimates.
• List common issues in estimating, including
overoptimism, the role of contingency al-
lowances, and the use of rolling wave esti-
mates.
Estimated timing for this chapter:
Reading 45 minutes
Exercises 1 hour 15 minutes
Review Questions 10 minutes
Total Time 2 hours 10 minutes
© American Management Association. All rights reserved.
http://www.amanet.org/ 65
Copyright2015.AMASelf-Study.
Allrightsreserved.Maynotbereproducedinanyformwithoutpermissionfromthepublisher,exceptfairusespermittedunderU.S.orapplicablecopyrightlaw.
EBSCO Publishing : eBook Collection (EBSCOhost) - printed on 10/19/2019 3:57 PM via UNIVERSIDAD NACIONAL ABIERTA Y A DISTANCIA - UNAD
AN: 1520886 ; Dobson, Michael Singer.; Successful Project Management : How to Complete Projects on Time, on Budget, and on Target
Account: ns145102.main.eds
UNCERTAINTY IN PROJECT PLANNING
Our first version of a network diagram is an important milestone in develop-
ing a comprehensive and workable project management approach, but it’s
hardly the end of the process. How long will these activities take? How much
will they cost?
Sometimes we know exactly how long an activity will take and exactly
what it will cost. If you sign up to take a three-day seminar, it will take three
days—not two, and not four. If the seminar has a firm, fixed price of $1,250,
then it will cost $1,250.
Of course, there may be secondary considerations. If you have to travel
to another city and rent a car and a hotel room, you’ll incur those costs, and
they may vary depending on when and where you go, or how far in advance
you book. And if you’re traveling, you’ll probably need to leave at least a day
earlier, and may need to stay over an extra day, depending on flights.
With a little research, you can probably firm up those extra costs and
travel times, but in other cases you may be looking at a great deal more un-
certainty. At the beginning of this chapter, there’s a time estimate for how long
we expect it will take you to complete it. The reading time is based on the
word count and the average reading speed, which is 200 words per minute.
“Average,” of course, recognizes that some people read faster and others
slower. If you’re already familiar with project management, you may need less
time to absorb the concepts than if they are entirely new to you.
If you are supposed to gather user needs for a new IT system, the actual
time will be affected by how many users you survey, how willing they are to
provide you with information, how much information you ask for, and many
other variables. So how long will it take?
In this case, you have a choice. You could establish a quality goal—how
much information, how many users, what level of depth—and the time to ac-
complish it may vary. On the other hand, you could establish a time constraint,
say, two weeks, and do as much as you can within that two-week period. That
way you can guarantee you’ll make the deadline, but there’s a potential impact
on quality. You might use the hierarchy of constraints to help you choose the
best (or least worst) option, but the uncertainty remains. It’s simply shifted
position.
What are some elements of projects in your organization that have uncertain durations and costs?
To what extent can you predict or control that uncertainty?
Think About It . . . Uncertainties on Your Project
66 SUCCESSFUL PROJECT MANAGEMENT
© American Management Association. All rights reserved.
http://www.amanet.org/
Copyright2015.AMASelf-Study.
Allrightsreserved.Maynotbereproducedinanyformwithoutpermissionfromthepublisher,exceptfairusespermittedunderU.S.orapplicablecopyrightlaw.
EBSCO Publishing : eBook Collection (EBSCOhost) - printed on 10/19/2019 3:57 PM via UNIVERSIDAD NACIONAL ABIERTA Y A DISTANCIA - UNAD
AN: 1520886 ; Dobson, Michael Singer.; Successful Project Management : How to Complete Projects on Time, on Budget, and on Target
Account: ns145102.main.eds
ESTIMATING METHODOLOGIES
The basic estimating methodology is known as a WAG, or Wildly Aimed
Guess. (It’s also defined in a less family-friendly way.) That’s distinct from a
SWAG, or Scientific Wildly Aimed Guess, which is delivered with a calm and
confident air, as if you know what you’re talking about.
Sometimes, guesses are the best we can do, and as long as we label them
for what they are, they can have some value in the planning process. Estimates,
unlike guesses, have history: they are based on some real data and use some real
methodology. That doesn’t always make them superior to guesses; some people’s
WAGs are better than other people’s detailed and documented estimates.
Different estimates are used for different purposes, and are based on dif-
ferent levels of understanding about a project.
A rough order of magnitude (ROM) estimate is used by decision-makers to
decide if a project will be undertaken at all. The estimator starts with very
little knowledge about the project. “How much would a new office building
cost?” Obviously, that will vary by how large the building is, whether it has
any special characteristics, where it will be built, and many other factors. But
if none of that has been decided yet, you can only come up with a very general
number. ROM estimates are considered accurate if the project comes in within
-25% to +100% of the number provided.
A preliminary estimate is based on a written statement of work (SOW), so
you have more information to work with, but a detailed plan has not yet been
created. Preliminary estimates are often used as the basis of a budget request
or a proposal bid, and are considered accurate within a range of -10% to +25%.
A definitive estimate requires a complete plan, so it’s used as the project
baseline. Because reality never quite lines up with the plan, a definitive estimate
still has some variance. It’s considered accurate in the range of -5% to +10%.
If you’re asked to provide an estimate, you should always specify the type
of estimate you’re providing, and offer the estimate as a range, rather than as
a single number.
STANDARD ESTIMATING TECHNIQUES
Depending on the detail available and the accuracy required, several common
estimating techniques are widely used: analogous estimating, expert judgment
or Delphi estimating, parametric estimating, and bottom-up estimating.
Analogous Estimating
An analogous estimate uses the real numbers from another similar project, and
adjusts them based on any known difference. How much does a new office
building cost? Well, that new five-story building over on Main Street was built
two years ago and cost $15 million. It holds 200 people. If you know you’re
going to need space for 500 people, you could multiply $15 million by 150%,
and offer an analogous estimate of $22.5 million. Notice that this type of es-
timate is a ROM, which suggests a range between $16.875 million (25% less)
and $45 million (100% more).
ESTIMATING THE ACTIVITIES 67
© American Management Association. All rights reserved.
http://www.amanet.org/
Copyright2015.AMASelf-Study.
Allrightsreserved.Maynotbereproducedinanyformwithoutpermissionfromthepublisher,exceptfairusespermittedunderU.S.orapplicablecopyrightlaw.
EBSCO Publishing : eBook Collection (EBSCOhost) - printed on 10/19/2019 3:57 PM via UNIVERSIDAD NACIONAL ABIERTA Y A DISTANCIA - UNAD
AN: 1520886 ; Dobson, Michael Singer.; Successful Project Management : How to Complete Projects on Time, on Budget, and on Target
Account: ns145102.main.eds
Expert Judgment and Delphi Estimating
If you want a good estimate, you could ask an expert. Experts bring extensive
experience and deep understanding to the table, and their numbers are often
quite accurate. There are several potential concerns, however.
First, is the expert actually an expert in the particular type of project or
activity? Some experts hate to disappoint the questioner, and will offer an “ex-
pert” opinion for which they are no more qualified than the average person.
Second, does the expert have a bias? If the expert has an economic inter-
est in the project, the estimate may be less reliable, regardless of the actual
knowledge of the expert. This isn’t always lying on the expert’s part: some-
times people tend to be optimistic when they are part of the project.
Third, is there a potential for “groupthink”? If you gather together a
group of experts and ask each in turn for an estimate, people who are asked
later tend to avoid violating the group consensus, and skew their answer to-
ward the others given.
The solution for groupthink is known as the Delphi method. In Delphi,
you give each expert an estimating worksheet with information and questions,
and have each complete it simultaneously. This keeps one person’s opinion
from being influenced by another. The average of the expert judgments is
often far more accurate than any individual’s estimate.
Depending on the questions asked and the information provided, expert
judgment estimates can fall into ROM, preliminary, or even definitive levels
of accuracy.
Parametric Estimating
A parametric estimate is one that uses a statistical model. If you ask a commercial
real estate person how much office space in your area costs, you’ll normally
get a cost-per-square-foot number. If office space goes for $35 a square foot,
and you need 1,200 square feet, the estimated annual rent is $42,000, or about
$3,500/month. Of course, the price of office space varies, but if a particular
landlord quotes a figure much higher or much lower than $3,500/month, it
should raise questions. Perhaps the difference is completely appropriate, but
you want to understand why.
That’s a simple parametric. A more complex parametric is one you’ve
encountered if you’ve purchased life insurance. An agent interviews you: your
age, your health history, whether you smoke, and many other factors. The
model queries a large statistical database and calculates what your premium
should be.
Depending on the sophistication of the model and the data available,
parametric estimates can be produced in all three categories of accuracy.
Bottom-Up Estimating
To prepare a bottom-up estimate, you need a comprehensive and complete proj-
ect plan, along with all the necessary supporting data. In a bottom-up estimate,
you begin by estimating each activity separately, rolling them up into WBS
work packages, then to control accounts, until you get to the final figure. Be-
68 SUCCESSFUL PROJECT MANAGEMENT
© American Management Association. All rights reserved.
http://www.amanet.org/
Copyright2015.AMASelf-Study.
Allrightsreserved.Maynotbereproducedinanyformwithoutpermissionfromthepublisher,exceptfairusespermittedunderU.S.orapplicablecopyrightlaw.
EBSCO Publishing : eBook Collection (EBSCOhost) - printed on 10/19/2019 3:57 PM via UNIVERSIDAD NACIONAL ABIERTA Y A DISTANCIA - UNAD
AN: 1520886 ; Dobson, Michael Singer.; Successful Project Management : How to Complete Projects on Time, on Budget, and on Target
Account: ns145102.main.eds
cause a bottom-up estimate is based on the most detailed planning informa-
tion available, it constitutes a definitive estimate, which usually becomes the
baseline used to monitor project progress.
The potential danger with a bottom-up estimate is the tendency to pad
the numbers for safety. There’s nothing wrong with adjusting estimates based
on risk—we’ll learn how to do that in the next chapter—but padding is usually
just adding a WAG to the base number. Sometimes, the higher levels of the
WBS will add their own padding, and pretty soon your bottom-up estimate
is of no value. Although it’s not uncommon for project managers to pad esti-
mates, we strongly discourage the practice. Adjusting for risk is based on
analysis, not WAGs, and accomplishes the legitimate goal of ensuring you
have a reasonably good estimate without making up numbers.
Instructions: For the following estimates, list the estimating methodology (WAG, analogous, expert,
Delphi, parametric, bottom-up) used and classify the expected accuracy (ROM, preliminary, budg-
etary, variable) of the number.
Estimate Basis Type Accuracy
1. The president says we’ll go to the moon in 10 years. ____________ ____________
2. We surveyed ten people and used the average. ____________ ____________
3. Joe has done this kind of thing a lot. ____________ ____________
4. We did something like this a few years back. ____________ ____________
5. When we added it all together, it came to $1 million. ____________ ____________
6. We ran the specs through our job cost program. ____________ ____________
7. Six weeks sounds reasonable. ____________ ____________
8. Research says 10–15K lines of code per year is average. ____________ ____________
9. Six months sounds about right. ____________ ____________
THREE-POINT ESTIMATING
In addition to these common estimating techniques, project management has
two unique estimating methodologies: PERT and Monte Carlo simulation.
Both are built on what are known as three-point estimates. This estimating tech-
nique is useful on projects that have a high degree of inherent uncertainty
and a need for accurate predictions.
Because it’s a fair amount of work, you should evaluate whether these
techniques are appropriate for your project. Even if you don’t need the infor-
mation right now, you may in the future. And if you plan to take the PMP® ex-
amination, you’ll need to have a grasp of the basic concepts of these methods.
Exercise 4–1
Types of Estimates
ESTIMATING THE ACTIVITIES 69
© American Management Association. All rights reserved.
http://www.amanet.org/
Copyright2015.AMASelf-Study.
Allrightsreserved.Maynotbereproducedinanyformwithoutpermissionfromthepublisher,exceptfairusespermittedunderU.S.orapplicablecopyrightlaw.
EBSCO Publishing : eBook Collection (EBSCOhost) - printed on 10/19/2019 3:57 PM via UNIVERSIDAD NACIONAL ABIERTA Y A DISTANCIA - UNAD
AN: 1520886 ; Dobson, Michael Singer.; Successful Project Management : How to Complete Projects on Time, on Budget, and on Target
Account: ns145102.main.eds
Program Evaluation and Review Technique (PERT)
In our brief discussion of the history and evolution of project management in
Chapter 1, we mentioned the Program Evaluation and Review Technique
(PERT), which grew out of the Polaris submarine project in the 1950s. Polaris
was at the time the most complex engineering project ever undertaken, and
much of what the engineers and designers had to do had never been done be-
fore. This, of course, makes meaningful estimating problematic, and the proj-
ect planners had to invent a new approach to keep the project on track in spite
of the inherent uncertainty in the work.
The PERT method was based on the concept of three-point estimating. If
someone asks you for an estimate of how long something will take or how
much it will cost, and there’s a range, most people will provide their most likely
estimate. That seems reasonable enough, but in practice when you use most
likely estimates for individual activities, you’ll almost always end up late and
over budget.
To understand why this is, let’s look at two other potential estimates. The
optimistic estimate is the best-case scenario. It assumes that everything goes per-
fectly. The pessimistic estimate assumes the opposite: bad things will happen.
(Both of these estimates cover possibilities with a minimum of a 1% proba-
bility.) Notice that the difference between most likely and optimistic is usually
less than the difference between most likely and pessimistic. There’s only so
good it can get, but bad covers a much wider range. That makes a “most likely”
schedule extremely unlikely to meet its goals.
Because computing power in the 1950s was extremely limited, the PERT
planners were forced to come up with “quick and dirty” techniques to inte-
grate the three estimates into something that could be used in practice. Exhibit
4–1 shows the basic PERT formulas.
The PERT estimate, as you can see, is a weighted average of all three es-
timates, with “most likely” counting for more than either extreme. The Greek
letter 𝞼 (sigma) represents the standard deviation.
70 SUCCESSFUL PROJECT MANAGEMENT
© American Management Association. All rights reserved.
http://www.amanet.org/
𝐸 = 𝑂 + (4∗𝑀) + 𝑃6
𝞼 = 𝑃 − 𝑂/6
Where:
E = PERT Estimate
O = Optimistic Estimate
M = Most Likely Estimate
P = Pessimistic Estimate
𝞼 = Standard Deviation
xhibit 4–1
PERT Formulas
Copyright2015.AMASelf-Study.
Allrightsreserved.Maynotbereproducedinanyformwithoutpermissionfromthepublisher,exceptfairusespermittedunderU.S.orapplicablecopyrightlaw.
EBSCO Publishing : eBook Collection (EBSCOhost) - printed on 10/19/2019 3:57 PM via UNIVERSIDAD NACIONAL ABIERTA Y A DISTANCIA - UNAD
AN: 1520886 ; Dobson, Michael Singer.; Successful Project Management : How to Complete Projects on Time, on Budget, and on Target
Account: ns145102.main.eds
The standard deviation helps you determine the probability of your actual
result meeting a given target. Exhibit 4–2 shows how the standard deviation
relates to the PERT estimate. Exhibit 4–3 provides a helpful “Z table” showing
your probability of meeting a given deadline or budget when expressed in stan-
dard deviations from the PERT estimate.
PERT calculations can be made for both time and cost. If the optimistic
estimate for an activity is $500, the most likely $750, and the pessimistic
$1,500, the PERT estimate will be ($500 + (4 * $750) + $1,500)/6, or $833.33,
and the standard deviation will be ($1,500 – $500)/6, or $166.67.
With time, there’s one additional fact you should know. If you want to know
the standard deviation for a series of activities, you have to square each of the
standard deviations, add them together, and take the square root of the sum.
Example: Take the path sequence A→B→C. A has a standard deviation
of 2 days, B has a standard deviation of 3 days, and C has a standard deviation
of 1 day. 22
+ 32
+ 12
= 4 + 9 + 1 = 14. The standard deviation of A→B→C is
the square root of 14, or about 3.74, which we’ll round to 4.
Instructions: Use the PERT formulas and Z table to answer the following questions. Round all num-
bers to the nearest integer.
1. For Activity A, the optimistic estimate is 10 days, the most likely estimate is 12 days, and the
pessimistic estimate is 25 days. What is the PERT estimate and standard deviation?
2. For Activity A, the optimistic cost estimate is $5,000, the most likely estimate is $15,000, and
the pessimistic estimate is $21,000. What is the PERT estimate and standard deviation?
3. You are given a deadline of 15 days and a budget of $13,000 for Activity A. What is the proba-
bility that you will achieve the time and cost objectives?
4. For the path A→B→C, if the standard deviations are A = 4, B = 5, and C = 7, what is the stan-
dard deviation of the path?
Exercise 4–2
Calculating PERT Estimates
ESTIMATING THE ACTIVITIES 71
© American Management Association. All rights reserved.
http://www.amanet.org/
Credit: Standard deviation diagram, based on an original graph by Jeremy Kemp, 2005. Licensed under the Creative Commons Attribution 2.5 Generic
license; downloaded from Wikimedia Commons on 1 August 2013.
xhibit 4–2
Standard Deviation Diagram
Copyright2015.AMASelf-Study.
Allrightsreserved.Maynotbereproducedinanyformwithoutpermissionfromthepublisher,exceptfairusespermittedunderU.S.orapplicablecopyrightlaw.
EBSCO Publishing : eBook Collection (EBSCOhost) - printed on 10/19/2019 3:57 PM via UNIVERSIDAD NACIONAL ABIERTA Y A DISTANCIA - UNAD
AN: 1520886 ; Dobson, Michael Singer.; Successful Project Management : How to Complete Projects on Time, on Budget, and on Target
Account: ns145102.main.eds
72 SUCCESSFUL PROJECT MANAGEMENT
© American Management Association. All rights reserved.
http://www.amanet.org/
This table, called a “Z table” in statistics, gives you the statistical probability of achieving a given
cost or time goal expressed in terms of the PERT estimate and the standard deviation.
Example 1: Your PERT estimate for a given activity is 10 days, and the standard deviation is 3
days.Your probability of meeting the goal in 10 days (E + 0𝞼) is 50%. Meeting the goal in 13 days
(E + 1𝞼) is 84.13%.Your probability of meeting the goal in 7 days (E – 1𝞼), however, is only 15.87%.
Example 2:Your PERT estimate for the activity is $15,000, and the standard deviation is $3,000.
If you are given a $16,000 budget, that’s $1,000 more than E, which is a third (0.3) of the standard
deviation. E + 0.3𝞼 is 61.79%. If you are given $14,000, the chance is now E – 0.3𝞼, or 38.21%.
xhibit 4–3
Z Table
𝞼 Probability 𝞼 Probability
-3 0.13% 0 50.00%
-2.9 0.19% 0.1 53.98%
-2.8 0.26% 0.2 57.93%
-2.7 0.35% 0.3 61.79%
-2.6 0.47% 0.4 65.54%
-2.5 0.62% 0.5 69.15%
-2.4 0.82% 0.6 72.57%
-2.3 1.07% 0.7 75.80%
-2.2 1.39% 0.8 78.81%
-2.1 1.79% 0.9 81.59%
-2 2.28% 1 84.13%
-1.9 2.87% 1.1 86.43%
-1.8 3.59% 1.2 88.49%
-1.7 4.46% 1.3 90.32%
-1.6 5.48% 1.4 91.92%
-1.5 6.68% 1.5 93.32%
-1.4 8.08% 1.6 94.52%
-1.3 9.68% 1.7 95.54%
-1.2 11.51% 1.8 96.41%
-1.1 13.57% 1.9 97.13%
-1 15.87% 2 97.72%
-0.9 18.41% 2.1 98.21%
-0.8 21.19% 2.2 98.61%
-0.7 24.20% 2.3 98.93%
-0.6 27.43% 2.4 99.18%
-0.5 30.85% 2.5 99.38%
-0.4 34.46% 2.6 99.53%
-0.3 38.21% 2.7 99.65%
-0.2 42.07% 2.8 99.74%
-0.1 46.02% 2.9 99.81%
0 50.00% 3 99.87%
Copyright2015.AMASelf-Study.
Allrightsreserved.Maynotbereproducedinanyformwithoutpermissionfromthepublisher,exceptfairusespermittedunderU.S.orapplicablecopyrightlaw.
EBSCO Publishing : eBook Collection (EBSCOhost) - printed on 10/19/2019 3:57 PM via UNIVERSIDAD NACIONAL ABIERTA Y A DISTANCIA - UNAD
AN: 1520886 ; Dobson, Michael Singer.; Successful Project Management : How to Complete Projects on Time, on Budget, and on Target
Account: ns145102.main.eds
Monte Carlo Simulation
If you’ve studied statistics, you will have noticed that our formulas for the standard
deviation are not what you learned. The reason is the limits to computers at the
time PERT was invented. PERT works well enough, but today’s project managers
have access to far more computing resources than the Polaris planners.
The Monte Carlo simulation technique uses the same three-point esti-
mates as PERT, but instead of applying the PERT formula, those numbers
get entered into a Monte Carlo program. There are many different Monte
Carlo simulators for project management on the market, and they usually
come in the form of a plug-in to various commercial software packages. There
are several Monte Carlo simulators for Microsoft Project®, and versions for
all the popular software packages.
When you install your Monte Carlo simulator and open your project man-
agement software, you’ll have the opportunity to enter the three-point estimates
for each activity. Some versions allow you to adjust the numbers and distribution
patterns. Once you’ve entered the data, simply run the program. Go get a cup
of coffee; this might take a while depending on the size of the project.
Starting with the first activity, the Monte Carlo simulator generates a
random number based on the three estimates and their weighting, and uses
that as the duration of the activity. If it’s earlier or later than scheduled, other
activities are moved forward or backward in the schedule based on their de-
pendencies. The program now goes to the next activity, repeats the process,
and so on until it reaches the end of the project. It stores how long it took to
complete the project (and how much was spent, if you’ve set it up that way),
then goes back to the first activity and does it again. And again, and again,
until it’s simulated the project several thousand times and generated a range
of finish dates and final costs. You can read the output to figure out the prob-
ability of meeting any particular deadline or budget.
The Monte Carlo method is both easier and more accurate than PERT,
but requires you to use a project management software program and a com-
patible Monte Carlo program. More and more, project managers are aban-
doning the traditional PERT method for the new technology.
Not every project or every organization will receive enough benefit from PERT or Monte Carlo to
justify the time and effort involved, but in some cases it’s extremely valuable. Do these techniques
have a place in your organization’s projects? Under what circumstances would you want to use
these tools?
Think About It . . . Managing Uncertainty
ESTIMATING THE ACTIVITIES 73
© American Management Association. All rights reserved.
http://www.amanet.org/
Copyright2015.AMASelf-Study.
Allrightsreserved.Maynotbereproducedinanyformwithoutpermissionfromthepublisher,exceptfairusespermittedunderU.S.orapplicablecopyrightlaw.
EBSCO Publishing : eBook Collection (EBSCOhost) - printed on 10/19/2019 3:57 PM via UNIVERSIDAD NACIONAL ABIERTA Y A DISTANCIA - UNAD
AN: 1520886 ; Dobson, Michael Singer.; Successful Project Management : How to Complete Projects on Time, on Budget, and on Target
Account: ns145102.main.eds
ISSUES IN ESTIMATING
Pretty much by definition, estimates aren’t the same thing as reality: your
mileage may vary. A healthy dose of skepticism about estimates is recom-
mended.
Overoptimism
Although some projects do come in ahead of their estimates, by far the more
common outcome is that projects tend to be late and over budget. There’s a
general bias toward optimism in the estimating process. People tend to over-
estimate how productive they are likely to be, underestimate the number of
interruptions and distractions, and fail to account for emergencies. According
to the annual Standish Group CHAOS Report on large corporate IT projects,
only 32% of projects actually meet their goals of time, cost, and performance
(Gruebl and Welch, 13).
Parkinson’s Law
Some project management authorities recommend adding a contingency al-
lowance to the time and cost estimates to account for poor estimating. Though
this has some virtues, it runs afoul of a well-known management principle
called Parkinson’s Law: work expands so as to fill the time available for its
completion (Parkinson, 1958).
If you have a comfortable amount of time in which to accomplish an ac-
tivity, there’s not a lot of urgency to get started, and there are almost always
various other issues that are calling for your attention. Adding contingency
to activities may in fact make them take longer, and the project will still be
late and over budget.
A project management technique known as critical chain project management
(CCPM) suggests that you should take the contingency allowance away from
individual activities and add them to the network diagram in the form of buffers
(Goldratt, 1997). This reduces the incentive for procrastination.
Rolling Wave Estimating
Another problem related to estimating is the extent to which knowledge and
understanding evolves in the course of a long project. If you’re looking at a
four or five year time horizon, your estimates of activity duration toward the
end of the project are highly speculative—little better than WAGs. As the
project moves forward, the experience and information you get will allow you
to improve and tighten estimates. Your initial plan might only be able to pro-
vide ROM-level estimates, but as time goes forward they can become prelim-
inary and eventually definitive. This process is known as rolling wave estimating,
an estimate iterated during the project life cycle as more information becomes
available.
74 SUCCESSFUL PROJECT MANAGEMENT
© American Management Association. All rights reserved.
http://www.amanet.org/
Copyright2015.AMASelf-Study.
Allrightsreserved.Maynotbereproducedinanyformwithoutpermissionfromthepublisher,exceptfairusespermittedunderU.S.orapplicablecopyrightlaw.
EBSCO Publishing : eBook Collection (EBSCOhost) - printed on 10/19/2019 3:57 PM via UNIVERSIDAD NACIONAL ABIERTA Y A DISTANCIA - UNAD
AN: 1520886 ; Dobson, Michael Singer.; Successful Project Management : How to Complete Projects on Time, on Budget, and on Target
Account: ns145102.main.eds
Instructions: For your PMO project, you will need to make some estimates. For each estimate re-
quired, explain what technique or methodology you would use from the ones described in this
chapter, and where you might get any information necessary to develop those estimates. These
questions assume you’re using the network diagram from the Answer Key for Exercise 3–5.
1. How would you estimate the time required for Activity 1 (“Research”)?
2. How would you estimate the time required for Activity 3 (“Obtain Feedback”)?
3. How would you estimate the likely price of Activity 8 (“Obtain Outside Trainer”)?
4. How would you estimate the time required for Activity 6 (“Recruit PMO Head”)?
5. How would you estimate how much it will cost for Activity 11 (“Prepare Stockholder Presentation”)?
Exercise 4–3
Estimating Review
ESTIMATING THE ACTIVITIES 75
© American Management Association. All rights reserved.
http://www.amanet.org/
Copyright2015.AMASelf-Study.
Allrightsreserved.Maynotbereproducedinanyformwithoutpermissionfromthepublisher,exceptfairusespermittedunderU.S.orapplicablecopyrightlaw.
EBSCO Publishing : eBook Collection (EBSCOhost) - printed on 10/19/2019 3:57 PM via UNIVERSIDAD NACIONAL ABIERTA Y A DISTANCIA - UNAD
AN: 1520886 ; Dobson, Michael Singer.; Successful Project Management : How to Complete Projects on Time, on Budget, and on Target
Account: ns145102.main.eds
The first iteration of a project plan is an important milestone,
but not the end of the process. Normally, you should expect
to develop a lot of additional information and detail to flesh
out the plan and address issues.
Because there is often a great deal of uncertainty in a
project, we must normally develop estimates of time, cost, and
resources. Estimates come in varying degrees of accuracy,
ranging from rough order of magnitude (ROM) to progres-
sively more accurate preliminary and definitive estimates. Be-
sides the traditional Wildly Aimed Guess (WAG) method, other estimating
methodologies include analogous estimating, expert judgment and Delphi es-
timating, parametric estimating, and bottom-up estimating.
In project management, three-point estimates (optimistic, most likely,
and pessimistic estimates) are the basis of the Program Evaluation and Review
Technique (PERT) and the Monte Carlo simulation. The PERT method uses
statistical calculations to establish estimates and the range of likely outcomes.
Although it’s important for project managers to understand the PERT ap-
proach, the Monte Carlo method, which uses a software package to simulate
the project repeatedly, is more accurate and easier.
It’s much more common for projects to exceed their estimates rather than
meet them. Overoptimism and the failure to account for interruptions and
emergencies are common reasons. Some project management authorities rec-
ommend adding a contingency allowance, but that may trigger Parkinson’s
Law: the tendency of work to expand to fill the time available. The discipline
of critical chain project management suggests using buffers to hold contin-
gency rather than allocate it to individual activities or work packages.
In long projects, the availability of information increases over time, so
initial estimates are generally less meaningful than estimates prepared closer
to the start of the activity. Rolling wave estimating evolves the quality of the
estimate over the life cycle of the project as new and better information be-
comes available.
76 SUCCESSFUL PROJECT MANAGEMENT
© American Management Association. All rights reserved.
http://www.amanet.org/
Copyright2015.AMASelf-Study.
Allrightsreserved.Maynotbereproducedinanyformwithoutpermissionfromthepublisher,exceptfairusespermittedunderU.S.orapplicablecopyrightlaw.
EBSCO Publishing : eBook Collection (EBSCOhost) - printed on 10/19/2019 3:57 PM via UNIVERSIDAD NACIONAL ABIERTA Y A DISTANCIA - UNAD
AN: 1520886 ; Dobson, Michael Singer.; Successful Project Management : How to Complete Projects on Time, on Budget, and on Target
Account: ns145102.main.eds
A preliminary estimate has an expected accuracy of: 1. (d)1.
-25%, +100%.(a)
-25%, +75%.(b)
-5%, +10%.(c)
-10%, +25%.(d)
One reason why projects are more frequently late and over budget 2. (a)2.
than early and under budget is:
overoptimism in the estimating process.(a)
changes in scope requested by customers.(b)
using rough order of magnitude rather than preliminary estimates.(c)
incorrect calculations of the critical path.(d)
Which of these is a potential danger in developing a bottom-up estimate? 3. (d)3.
Flaws in the parametric model that is used(a)
Failure to use the Delphi method(b)
Relationship of the analogous project to the one being estimated(c)
Some team members may pad their estimates(d)
If you decide the quickest an activity can be completed is six weeks, 4. (c)4.
the worst case is 24 weeks, and the most likely time is 12 weeks, what
is the PERT estimate and the standard deviation?
E = 7, 𝞼 = 3(a)
E = 13, 𝞼 = 18(b)
E = 13, 𝞼 = 3(c)
E = 12, 𝞼 = 2(d)
CALCULATION: The formula for the PERT estimate is (O + 4M + P)/6, or (6 + (4 * 12) +
24)/6 = 13. The formula for the standard deviation (𝞼) is (P – O)/6, or (24 – 6)/6 = 3.
In a PERT analysis, what is the probability that an activity will be 5. (c)5.
completed no later than one standard deviation from the estimate?
68.2%(a)
50.00%(b)
84.13%(c)
15.87%(d)
Review Questions
ESTIMATING THE ACTIVITIES 77
© American Management Association. All rights reserved.
http://www.amanet.org/
Copyright2015.AMASelf-Study.
Allrightsreserved.Maynotbereproducedinanyformwithoutpermissionfromthepublisher,exceptfairusespermittedunderU.S.orapplicablecopyrightlaw.
EBSCO Publishing : eBook Collection (EBSCOhost) - printed on 10/19/2019 3:57 PM via UNIVERSIDAD NACIONAL ABIERTA Y A DISTANCIA - UNAD
AN: 1520886 ; Dobson, Michael Singer.; Successful Project Management : How to Complete Projects on Time, on Budget, and on Target
Account: ns145102.main.eds
This page intentionally left blank
Copyright2015.AMASelf-Study.
Allrightsreserved.Maynotbereproducedinanyformwithoutpermissionfromthepublisher,exceptfairusespermittedunderU.S.orapplicablecopyrightlaw.
EBSCO Publishing : eBook Collection (EBSCOhost) - printed on 10/19/2019 3:57 PM via UNIVERSIDAD NACIONAL ABIERTA Y A DISTANCIA - UNAD
AN: 1520886 ; Dobson, Michael Singer.; Successful Project Management : How to Complete Projects on Time, on Budget, and on Target
Account: ns145102.main.eds
5PreparingaProjectPlan
Learning Objectives
By the end of this chapter, you should be able to:
• Describe the process of progressively elabo-
rating the initial project plan.
• Identify staffing and resource requirements
for a project.
• Describe how to build the project team and
prepare a responsibility assignment matrix
(RAM).
• Explain the concepts of loading and leveling
a project schedule.
• Describe the roles of outsourcing and pro-
curement planning.
• Perform critical path method (CPM) calcu-
lations and explain the circumstances in
which they are appropriate.
• Develop a communications and stakeholder
management plan.
Estimated timing for this chapter:
Reading 55 minutes
Exercises 2 hours
Review Questions 10 minutes
Total Time 3 hours 5 minutes
© American Management Association. All rights reserved.
http://www.amanet.org/ 79
Copyright2015.AMASelf-Study.
Allrightsreserved.Maynotbereproducedinanyformwithoutpermissionfromthepublisher,exceptfairusespermittedunderU.S.orapplicablecopyrightlaw.
EBSCO Publishing : eBook Collection (EBSCOhost) - printed on 10/19/2019 3:57 PM via UNIVERSIDAD NACIONAL ABIERTA Y A DISTANCIA - UNAD
AN: 1520886 ; Dobson, Michael Singer.; Successful Project Management : How to Complete Projects on Time, on Budget, and on Target
Account: ns145102.main.eds
PROGRESSIVE ELABORATION AND THE
PROJECT PLAN
A project plan consists of far more than simply a schedule. You need a budget,
a staffing plan, a procurement plan for any outsourcing or purchasing, a com-
munications plan to manage stakeholders, and plans for ensuring quality and
managing risk.
In our planning process so far, we began with a statement of work (SOW),
which we developed into a work breakdown structure (WBS). From the WBS,
we developed an activity list and prepared a network diagram and Gantt chart.
That constitutes a preliminary project plan.
In Chapter 4, we developed the plan by creating estimates for activities and
using those estimates, developed confidence measures using PERTand Monte
Carlo to see whether we would be able to meet the time and cost constraints.
In this chapter, we’ll continue to flesh out the components of the project
plan, including human resources, procurement, and communications plan-
ning. On the way, we’ll look at using the critical path method (CPM) as a tool
to balance scope and schedule. In the next chapter, we’ll address managing
quality and risk.
It’s important to note here that as you move forward in the planning
process, you normally learn information that will change some of your earlier
ideas. The SOW, WBS, network diagram, and estimates can and should
evolve—it’s the iterative nature of project planning in action. If you find that
your real-world planning process sometimes feels like “two steps forward, one
step back,” that’s probably a sign that you’re doing it right.
STAFFING AND RESOURCE REQUIREMENTS
In estimating, we figure out how long a project will take and how much it will
cost, but these are not the only considerations. How about people? How many
do we need, when do we need them, and what skills do they need to have?
Will our project require access to specialized tools and equipment?
In the real world, we’re often told how many people we get, and frequently
told who they are, even before we begin the planning process. Even so, we still
need to allocate people to different activities and make sure all the work is cov-
ered. If we have missing skills or too few (or too many) people, we may need
to go back to our project sponsor and see if we can modify the situation.
BUILDING THE PROJECT TEAM
In planning, the first step is to compare the team you have with the team you
need. There are three characteristics about your team you need to assess: the
number, the work maturity, and the skill set.
Number. Consider both the raw number of people available to your proj-
ect and the percentage time commitment of each. Two people available
only half the time counts the same as one full-time person. Some people
will be committed to your project from beginning to end, and others may
80 SUCCESSFUL PROJECT MANAGEMENT
© American Management Association. All rights reserved.
http://www.amanet.org/
Copyright2015.AMASelf-Study.
Allrightsreserved.Maynotbereproducedinanyformwithoutpermissionfromthepublisher,exceptfairusespermittedunderU.S.orapplicablecopyrightlaw.
EBSCO Publishing : eBook Collection (EBSCOhost) - printed on 10/19/2019 3:57 PM via UNIVERSIDAD NACIONAL ABIERTA Y A DISTANCIA - UNAD
AN: 1520886 ; Dobson, Michael Singer.; Successful Project Management : How to Complete Projects on Time, on Budget, and on Target
Account: ns145102.main.eds
be available only for particular phases. That may be completely sensible,
as projects often have different work requirements at different times.
Workmaturity.Work maturity encompasses level of experience, attitude
toward the organization and the project, ability to work independently
or with little direction, and other considerations. A person of low work
maturity isn’t necessarily a bad performer, but may simply be a relatively
fresh hire. Some people with lots of experience but bad attitudes might
be considered as having even lower work maturity.
Skillset. With some activities, it doesn’t matter which team member you
assign because they all possess the necessary skills. In other cases, you
may be very limited in who you can assign to a particular activity.
To find out whether your team is sufficient for your project, you must
assign team members to work packages or activities to see if there are any
problems. In addition to making sure that each activity is covered, you also
need to check that you haven’t inadvertently double-booked people on par-
allel activities. For the first, you’ll begin with a responsibility assignment ma-
trix (RAM), and for the second, we’ll look at resource loading and leveling.
Responsibility Assignment Matrix (RAM)
A responsibility assignment matrix, or RAM, is a tool that links resources to
activities. (You may also see this referred to as a RACI matrix.) To build a
RAM, you must first look at your project to see what skills are required to ac-
complish the work. Exhibit 5–1 takes the network diagram from the pharma-
ceutical project we developed in Exhibit 3–6 and lists the skills we need to
perform this project. Exercise 5–1 allows you to apply this tool to the PMO
case study project.
Instructions: For the PMO case study project, analyze the network diagram you developed in Ex-
ercise 3–5 and list the skills your team needs to accomplish the work.
Exhibit 5–1 shows that we need one or more writers, at least one editor,
and one or more people in data management. Although project management
is involved throughout the project, the project manager has primary respon-
sibilities in such activities as assigning the team and in overseeing the review
process and completion of the final package.
Notice that we’ve listed “technical and management reviewing” as a skill
required to accomplish this project, but it’s pretty clear that those technical
and management reviewers aren’t part of our project team in any normal
sense. But they are part of the team in the sense that we can’t get the project
done without their input. The project manager doesn’t only have to manage
Exercise 5–1
Skill Requirements
PREPARING A PROJECT PLAN 81
© American Management Association. All rights reserved.
http://www.amanet.org/
Copyright2015.AMASelf-Study.
Allrightsreserved.Maynotbereproducedinanyformwithoutpermissionfromthepublisher,exceptfairusespermittedunderU.S.orapplicablecopyrightlaw.
EBSCO Publishing : eBook Collection (EBSCOhost) - printed on 10/19/2019 3:57 PM via UNIVERSIDAD NACIONAL ABIERTA Y A DISTANCIA - UNAD
AN: 1520886 ; Dobson, Michael Singer.; Successful Project Management : How to Complete Projects on Time, on Budget, and on Target
Account: ns145102.main.eds
the official team, but also has to “manage up” (Dobson and Dobson, 2000). In
this case, the project manager needs to identify the reviewers, make sure they
schedule the necessary time, make sure they get the information they need,
and follow up to make sure it all gets done.
The next step is to link those required skills to the skills possessed by
your team, which we’ve done in Exhibit 5–2. (We don’t need to assess the re-
viewers, so they don’t go on this list.) In Exercise 5–2, you will prepare your
own team skill assessment.
Instructions: As project manager, we assume that you have project management skills. You may
choose three of the following five candidates to complete your team.
Nguyen: Five years’ experience with the company in staff-level roles, BS degree in
Information Management. Skilled with PowerPoint.
Susan: Human resources generalist with four years’ experience.
Gemma: Three years with the company in management, MBA.
Exercise 5–2
Skill List
82 SUCCESSFUL PROJECT MANAGEMENT
© American Management Association. All rights reserved.
http://www.amanet.org/
Skills required:
Writing (Activities 5, 7, 9, 11)
Editing (Activities 5, 7, 9, 11)
Data Management (Activities 2, 3, 4, 13)
Project Management (Activities 1, 6, 8, 10, 12, 13)
Technical and Management Reviewing (Activities 6, 8, 10, 12)
xhibit 5–1
Skill Requirements
Start
FInish
1.
Assign
Team
2. Obtain
Raw
Data
3.
ezinagrO
Data
4.
Prepare
Index
5. Write
Summary
Sections
6. Review
Summary
Sections
7. Draft
Overall
Summary
8.
Review
1st Draft
9.
Rewrite
Summary
10.
Review
2nd Draft
11. Write
Final
12. Final
Signoff
13. Print
Data
14.
Submit
0 weeks
0 weeks
1 weeks
4 weeks 12 weeks
4 weeks 8 weeks
3 weeks
2 weeks 6 weeks 2 weeks 6 weeks 2 weeks
3 weeks
6 weeks
1 weeks
Total Time = 60 weeks
Critical Path = 44 weeks
Slack/Float = 6 weeks
Slack/Float = 3 weeks
Exercise 5–2 continues on next page.
Copyright2015.AMASelf-Study.
Allrightsreserved.Maynotbereproducedinanyformwithoutpermissionfromthepublisher,exceptfairusespermittedunderU.S.orapplicablecopyrightlaw.
EBSCO Publishing : eBook Collection (EBSCOhost) - printed on 10/19/2019 3:57 PM via UNIVERSIDAD NACIONAL ABIERTA Y A DISTANCIA - UNAD
AN: 1520886 ; Dobson, Michael Singer.; Successful Project Management : How to Complete Projects on Time, on Budget, and on Target
Account: ns145102.main.eds
Jurgen: Three years in shareholder relations and two years in corporate
communications, MBA.
Sean: Edits company newsletter while serving as human resources manager for one
of the divisions, BA, four years’ experience.
Now, we need to put this together into the final RAM table, shown in
Exhibit 5–3. For simplicity, we’ll add two reviewers: Yuri, the project sponsor,
and Maria, the technical reviewer. The project manager is Aliverdi. Exercise
5–3 gives you the opportunity to develop your own RAM.
Team
Member
Research
Policy
Development
Writing
Project
Management
Procurement
Org.
Devel.
HR Presentation
Nguyen
Susan
Gemma
Jurgen
Sean
PREPARING A PROJECT PLAN 83
© American Management Association. All rights reserved.
http://www.amanet.org/
Work maturity/skill level codes: N (Novice), A (Average), E (Expert)
xhibit 5–2
Team Skills
Team
Member
Writing Editing
Data
Management
Project
Management
Harry A N A N
Sally E E A N
François E A A A
Mariko A N E A
Aliverdi A A N E
Exercise 5–2 continued from previous page.
Copyright2015.AMASelf-Study.
Allrightsreserved.Maynotbereproducedinanyformwithoutpermissionfromthepublisher,exceptfairusespermittedunderU.S.orapplicablecopyrightlaw.
EBSCO Publishing : eBook Collection (EBSCOhost) - printed on 10/19/2019 3:57 PM via UNIVERSIDAD NACIONAL ABIERTA Y A DISTANCIA - UNAD
AN: 1520886 ; Dobson, Michael Singer.; Successful Project Management : How to Complete Projects on Time, on Budget, and on Target
Account: ns145102.main.eds
Instructions: Prepare a RAM for the PMO case study project based on your network diagram and
the information you developed in Exercises 5–1 and 5–2.
Exercise 5–3
Responsibility Assignment Matrix
Activity Responsible Consulted Informed Approval
84 SUCCESSFUL PROJECT MANAGEMENT
© American Management Association. All rights reserved.
http://www.amanet.org/
xhibit 5–3
Responsibility Assignment Matrix
Activity Responsible Consulted Informed Approval
Assign Team Aliverdi Team Yuri
Obtain Raw Data Mariko Harry
Organize Raw Data Mariko Harry Maria
Prepare Index Sally Mariko
Harry,
François
Aliverdi
Write Summary Sections François Sally Sally
Review Summary Sections Aliverdi Sally Yuri Maria
Draft Overall Summary François Sally
Review 1st Draft Maria Aliverdi Yuri Maria
Rewrite Summary François Sally
Review 2nd Draft Maria Aliverdi Yuri Maria
Write Final François Sally Yuri, Maria Aliverdi
Final Signoff Maria, Yuri Aliverdi Yuri
Print Aliverdi Mariko, Sally Yuri
Submittal Aliverdi Mariko, Sally Maria Yuri
Exercise 5–3 continues on next page.
Copyright2015.AMASelf-Study.
Allrightsreserved.Maynotbereproducedinanyformwithoutpermissionfromthepublisher,exceptfairusespermittedunderU.S.orapplicablecopyrightlaw.
EBSCO Publishing : eBook Collection (EBSCOhost) - printed on 10/19/2019 3:57 PM via UNIVERSIDAD NACIONAL ABIERTA Y A DISTANCIA - UNAD
AN: 1520886 ; Dobson, Michael Singer.; Successful Project Management : How to Complete Projects on Time, on Budget, and on Target
Account: ns145102.main.eds
LOADING AND LEVELING THE SCHEDULE
When we map our assignments to the network diagram (known as loading the
schedule), we notice that Sally is responsible for preparing the index (4) and
for overseeing/editing the writing of the summary sections (5). Because these
tasks are on parallel paths, there’s a possibility that Sally may end up being
booked for two jobs simultaneously. We need to look closely at the schedule
to see if there’s a problem, and solve it if necessary.
Because Organize Data (3) takes 12 weeks, it looks like François and Sally
will be done long before the index must be prepared, so we don’t have a prob-
lem. But what if we did? In that case, we would have to level the schedule, or bal-
ance the workload and the resources available to do it. There are several ways.
The first way is to delay one of the double-booked activities. If Sally has not
finished editing François’s first draft when she’s supposed to start indexing,
you could delay the start of the indexing task until she’s available. This may
push out the schedule.
Another way to solve the problem is to reassign one of Sally’s jobs, either
by finding another editor for the writing job, or by finding another indexer
for the indexing job. Both of these run the risk of simply transferring the over-
load to another team member.
Third, rather than reassigning one of Sally’s jobs to another team member,
we could ask for another person to join our team. We could look for another
skilled writer/editor, or for another indexer. Notice we might not require that
new position for the life of the project.
Activity Responsible Consulted Informed Approval
PREPARING A PROJECT PLAN 85
© American Management Association. All rights reserved.
http://www.amanet.org/
Exercise 5–3 continued from previous page.
Copyright2015.AMASelf-Study.
Allrightsreserved.Maynotbereproducedinanyformwithoutpermissionfromthepublisher,exceptfairusespermittedunderU.S.orapplicablecopyrightlaw.
EBSCO Publishing : eBook Collection (EBSCOhost) - printed on 10/19/2019 3:57 PM via UNIVERSIDAD NACIONAL ABIERTA Y A DISTANCIA - UNAD
AN: 1520886 ; Dobson, Michael Singer.; Successful Project Management : How to Complete Projects on Time, on Budget, and on Target
Account: ns145102.main.eds
Have you encountered situations in which a staff member was “double booked” for project activi-
ties? At what point did you realize it? Could you have found the problem earlier, and if so, what
might you have done differently?
OUTSOURCING
We also don’t necessarily have to confine ourselves to resources on hand.
Maybe we don’t have people with all the necessary skills, or perhaps we have
so much going on that everybody’s fully booked with other work. In that case,
we could consider outsourcing.
Almost any aspect of a project can, at least in theory, be handed off to some-
one else. If you have to make widgets, you can hire a manufacturer to make
them for you, or an engineering firm to design them. If you need writers, editors,
or indexers, you can hire them as consultants. If you’ve got to organize 100,000
pages of raw data, there are consulting firms that specialize in just that service.
Make or buy decisions are a powerful tool in the project manager’s arsenal.
Depending on your organizational circumstances, sometimes doing it yourself
is the best option, and sometimes it’s better to hire it out. Such factors as qual-
ity, speed, relative experience or capabilities, and what else internal resources
could do instead of that work can influence the decision. The best time for
make or buy decisions is early in the planning process, because they will have
a significant effect on the final project plan.
Procurement Planning
As you decide what you will be procuring as part of managing your project, you
need to start a procurement process. You need to define what you want to buy,
and identify one or more vendors who can supply your need. You will have to
get bids or proposals, evaluate them, choose your supplier, and negotiate nec-
essary contracts. Throughout the procurement process, you will need to make
sure that the vendor is performing on schedule and meeting requirements. You
will need to receive, inspect, and approve what you bought, and you will need
to pay invoices. All of these are activities that belong in your project plan.
The procurement process can turn into a major part of a project man-
ager’s responsibilities. A comprehensive study of procurement is, however, a
bit beyond the scope of this course. Many resources are available on this topic,
both in print and online.
Think About It . . . Loading and Leveling
86 SUCCESSFUL PROJECT MANAGEMENT
© American Management Association. All rights reserved.
http://www.amanet.org/
Copyright2015.AMASelf-Study.
Allrightsreserved.Maynotbereproducedinanyformwithoutpermissionfromthepublisher,exceptfairusespermittedunderU.S.orapplicablecopyrightlaw.
EBSCO Publishing : eBook Collection (EBSCOhost) - printed on 10/19/2019 3:57 PM via UNIVERSIDAD NACIONAL ABIERTA Y A DISTANCIA - UNAD
AN: 1520886 ; Dobson, Michael Singer.; Successful Project Management : How to Complete Projects on Time, on Budget, and on Target
Account: ns145102.main.eds
How do you make “make or buy” decisions on your projects?
CRITICAL PATH METHOD (CPM)
ANALYSIS
Resources and time are often linked. More people and equipment can, in
many cases, accomplish activities in less time, but at the cost of more dollars.
Critical path method (CPM) analysis provides a methodology for balancing
time, cost, and resources for optimal project results.
The Northridge Overpass Disaster
In Los Angeles’s 1994 Northridge earthquake, an overpass collapse closed In-
terstate 10, a critically important transportation link. This was hugely destruc-
tive to the area, with a community impact estimated at about $1 million per
day. The California Department of Transportation and the Federal Highway
Management Administration expedited contracts and offered a $200,000 per
day completion bonus for the reconstruction. It only took 74 days for the con-
tractor to finish the job—winning a $14.8 million bonus in the process
(USDOT, 1994).
By the standards of large highway interchange construction, this is re-
markably fast, but a $200,000/day bonus is quite an incentive. From the city
of Los Angeles’s point of view, though, it wasn’t excessively generous. If the
city is losing $1 million per day, every day the project finishes ahead of sched-
ule is a net $800,000 benefit—$59.2 million in total. That puts the $14.8 mil-
lion bonus in perspective.
Implications for Project Planning
The general project management lesson to take from the Northridge case is
the observation that in many cases, there is a financial benefit to finishing
early (and a corresponding cost of being late). At the very minimum, finishing
early cuts the overhead cost of running the project.
The second lesson is that there is often a tradeoff between what you
spend to accomplish a work package and how long it takes. If you want to
build a brick wall of a certain dimension, you can calculate how long it would
take a single bricklayer. If you added a bricklayer, you’d cut the time in half,
Think About It . . . Make or Buy
PREPARING A PROJECT PLAN 87
© American Management Association. All rights reserved.
http://www.amanet.org/
Copyright2015.AMASelf-Study.
Allrightsreserved.Maynotbereproducedinanyformwithoutpermissionfromthepublisher,exceptfairusespermittedunderU.S.orapplicablecopyrightlaw.
EBSCO Publishing : eBook Collection (EBSCOhost) - printed on 10/19/2019 3:57 PM via UNIVERSIDAD NACIONAL ABIERTA Y A DISTANCIA - UNAD
AN: 1520886 ; Dobson, Michael Singer.; Successful Project Management : How to Complete Projects on Time, on Budget, and on Target
Account: ns145102.main.eds
but you’d be paying two people. Add more people, and you’ll continue to re-
duce the total time, up until some point of diminishing returns, where another
body doesn’t save you very much (or worse, the bricklayers start tripping over
one another).
It should be noted that extra resources don’t always produce a time ben-
efit. The classic project management example is that it take one woman nine
months to have a baby, but it doesn’t follow that nine women could get the
job done in one. In addition, there are some tasks that are highly uncertain,
and you cannot predict the value of adding people. If you want to develop a
new concept design, two people might get the job done faster than one, but
they could get mired in an argument and actually take longer.
Critical Path Method
Insights like these led to the development of the critical path method (CPM),
a scheduling technique with a number of similarities to PERT. It was devel-
oped by DuPont and Remington Rand in the 1950s. We take the idea of the
critical path from CPM, as well as the term “slack.” (“Float” came from PERT,
but the two words refer to the same basic concept.)
Where the systems differ is the particular problem they address. PERT
is a planning tool designed for projects with a high degree of uncertainty.
CPM focuses on the kind of project where extra resources have a reliable,
measurable effect on scheduling.
Let’s go back to Interstate 10. In this project, we’ve been offered an in-
centive of $200,000 a day. In order to speed up the project, we will have to
add resources, so our costs will go up. If our target is, say, to keep $50,000 of
that bonus as profit, that gives us $150,000 per day to spend on additional re-
sources. But we can’t just throw that money around; we have to target it. CPM
analysis shows us how to target the money.
Crashing a Project
Under normal conditions, we’d spend a certain amount of money to get a job
done is a normal amount of time. If we crash the project, we add resources.
The crash duration, in CPM, is the shortest possible time in which an activity
can be completed, and the crash cost is how much you have to spend to achieve
it. The value of early completion is how much it’s worth to get it done early.
Since the goal of spending this extra money is to speed up project com-
pletion, it only makes sense to crash activities on the critical path. Crashing
noncritical activities just creates more slack. Using the network diagram in
Exhibit 5–4, we’ll demonstrate a step-by-step crashing of a project. In Exercise
5–4, you’ll do your own.
Let’s assume that the value of early completion is $250,000 per week.
Clearly, it makes sense to crash Activity A ($200,000 per week), but not Ac-
tivity H ($260,000 per week, more than the value of early completion). We
spend an extra $1 million, but get $1.25 million in early completion value, for
a net savings of $250,000.
Crashing any of the noncritical activities doesn’t give us any benefit. On
the critical path, we start with the cheapest crash (Activity F, save 1 week and
88 SUCCESSFUL PROJECT MANAGEMENT
© American Management Association. All rights reserved.
http://www.amanet.org/
Copyright2015.AMASelf-Study.
Allrightsreserved.Maynotbereproducedinanyformwithoutpermissionfromthepublisher,exceptfairusespermittedunderU.S.orapplicablecopyrightlaw.
EBSCO Publishing : eBook Collection (EBSCOhost) - printed on 10/19/2019 3:57 PM via UNIVERSIDAD NACIONAL ABIERTA Y A DISTANCIA - UNAD
AN: 1520886 ; Dobson, Michael Singer.; Successful Project Management : How to Complete Projects on Time, on Budget, and on Target
Account: ns145102.main.eds
$150,000). Next, we crash Activity B, saving 3 weeks and $300,000. (Our proj-
ect expenditure, however, increased by $550,000.)
Before we start on Activity D, let’s go back and look at the critical path
again. In the original project, B D F = 32 weeks, and C E G = 28 weeks.
(We only count normal time for the initial calculation.) We’ve now crashed
B D F by a total of four weeks, meaning that both paths are now 28 weeks,
and critical! Even though there’s still the opportunity to crash Activity D,
doing so won’t speed up our completion any more.
But we’re not done yet. We can continue crashing, but now we have to
crash both paths at the same time to get any more schedule benefit. The only
crashable activity on the top route is Activity D, with a crash cost per week of
$165,000. Of the three noncritical activities, the cheapest to crash is Activity
E, at $50,000. There are two days in Activity E, so we only crash Activity D
by the same two days. It costs us $165,000 + $50,000 per week, or $215,000,
and we pick up another two days and save an additional $70,000.
Are we done yet? The next cheapest pair is Activity D (which is now 13,
8) and Activity G. The combined crash cost of these activities is $245,000.
This is very close to our limit. Depending on how confident we are of our
numbers, we might or might not take this. If we do, we can take another three
days out of Activity D and three out of Activity G for a net savings of $10,000.
Activity D still has two days of potential crash left, and Activity C has
three. But the cost of crashing both has now reached $265,000, above our
PREPARING A PROJECT PLAN 89
© American Management Association. All rights reserved.
http://www.amanet.org/
Key:
“11, 8” = Normal time, Crash time (in weeks)
$150 = Cost per week of crashing (in thousands)
Critical path activities in black; noncritical activities in gray
Value of early completion = $250,000 per week
xhibit 5–4
Crashing a Project Using CPM
Activity A
10, 5
$200
Activity B
11, 8
$150
Activity C
9, 6
$100
Activity D
15, 8
$165
Activity E
11, 9
$50
Activity F
6, 5
$100
Activity G
8, 5
$80
Activity H
5, 3
$260
Copyright2015.AMASelf-Study.
Allrightsreserved.Maynotbereproducedinanyformwithoutpermissionfromthepublisher,exceptfairusespermittedunderU.S.orapplicablecopyrightlaw.
EBSCO Publishing : eBook Collection (EBSCOhost) - printed on 10/19/2019 3:57 PM via UNIVERSIDAD NACIONAL ABIERTA Y A DISTANCIA - UNAD
AN: 1520886 ; Dobson, Michael Singer.; Successful Project Management : How to Complete Projects on Time, on Budget, and on Target
Account: ns145102.main.eds
$250,000 value. Therefore, we won’t crash those last two activities. Exhibit
5–5 summarizes what we did.
If this sounds a little too good to be true, notice we spent an additional
$2,715,000 to achieve a time savings of 14 weeks. The gross benefit of being
14 weeks early is $3,500,000. Subtract those extra costs to get a net benefit of
$785,000.
Instructions: Perform a CPM analysis of the following project. Critical path activities are shown in
black and noncritical activities are shown in gray. The value of early completion is $250 per day.
COMMUNICATIONS AND STAKEHOLDER
MANAGEMENT PLAN
We’ve already emphasized the importance of stakeholder management and
communication in project management. In the planning stage, you should
think about exactly what you need to do to achieve your goals in these areas.
Do you need to have regular meetings with stakeholders? Do you need
to give them reports or briefings? Do they need to be in the loop in specific
decisions or on specific issues? Are they entitled to certain project informa-
tion? Is there information that should not be provided to them?
It’s important to get this down in writing in some organized form. With
numerous stakeholders and different information requirements, it’s all too
easy to forget who is supposed to know what, when, and how often.
Exercise 5–4
CPM Analysis
Activity A
0, 0
$0
Activity B
15, 10
$100
Activity D
21, 18
$125
Activity C
11, 9
$150
Activity E
9, 7
$175
Activity F
8, 1
$200
Activity G
12, 5
$100
Activity H
2, 1
$50
Critical Path = 0 + 15 + 21 + 8 + 2 = 46
Slack = 46 - (0 + 11 + 9 + 12 + 2) = 46 - 34 = 12
90 SUCCESSFUL PROJECT MANAGEMENT
© American Management Association. All rights reserved.
http://www.amanet.org/
Copyright2015.AMASelf-Study.
Allrightsreserved.Maynotbereproducedinanyformwithoutpermissionfromthepublisher,exceptfairusespermittedunderU.S.orapplicablecopyrightlaw.
EBSCO Publishing : eBook Collection (EBSCOhost) - printed on 10/19/2019 3:57 PM via UNIVERSIDAD NACIONAL ABIERTA Y A DISTANCIA - UNAD
AN: 1520886 ; Dobson, Michael Singer.; Successful Project Management : How to Complete Projects on Time, on Budget, and on Target
Account: ns145102.main.eds
One way to prepare a communications and stakeholder plan is to organize
it in a chart form, such as the one in Exhibit 5–6. In Exercise 5–5, you’ll de-
velop one for the PMO case study project.
Instructions: Complete the communications and stakeholder management plan for four stakehold-
ers of your choice.
Exercise 5–5
Communications and Stakeholder Management Plan
Stakeholder What the stakeholder
needs/wants from us
What we need/want
from the stakeholder
Communications
Strategy
Responsible
Person
PREPARING A PROJECT PLAN 91
© American Management Association. All rights reserved.
http://www.amanet.org/
xhibit 5–5
Summary of Crashing Activities
Crash Activities Time Saved Money Saved
Cumulative
Time Saved
Cumulative
Money Saved
1 A 5 weeks $250,000 5 weeks $250,000
2 F 1 week $150,000 6 weeks $400,000
3 B 3 weeks $300,000 9 weeks $700,000
4 D, E 2 weeks $70,000 11 weeks $770,000
5 D, G 3 weeks $15,000 14 weeks $785,000
Exercise 5-5 continues on next page.
Copyright2015.AMASelf-Study.
Allrightsreserved.Maynotbereproducedinanyformwithoutpermissionfromthepublisher,exceptfairusespermittedunderU.S.orapplicablecopyrightlaw.
EBSCO Publishing : eBook Collection (EBSCOhost) - printed on 10/19/2019 3:57 PM via UNIVERSIDAD NACIONAL ABIERTA Y A DISTANCIA - UNAD
AN: 1520886 ; Dobson, Michael Singer.; Successful Project Management : How to Complete Projects on Time, on Budget, and on Target
Account: ns145102.main.eds
92 SUCCESSFUL PROJECT MANAGEMENT
© American Management Association. All rights reserved.
http://www.amanet.org/
xhibit 5–6
Communications and Stakeholder Management Plan Template
Stakeholder What the stakeholder
needs/wants from us
What we need/want
from the stakeholder
Communications
Strategy
Responsible
Person
Customer Successful outcome,
updates on progress,
major issues
Continued support,
satisfied with outcome,
feels informed
Weekly status
summary, monthly
meeting, inform about
major issues
Project
manager
Project
sponsor
Successful outcome,
detailed progress
information, major
issues and decisions
Approvals, support,
resources, money,
understanding
Weekly status report
and meeting, escalate
issues as needed, give
early warning of
potential issues
Project
manager
Project team
members
Successful outcome,
knowing overall status,
having clear direction
and support
Hard work, results,
early warning of
issues, creative
problem-solving,
teamwork
Daily check-in, weekly
status meeting, regular
praise for achievements
Project
manager
Project
manager
Successful outcome,
detailed knowledge of
what’s going on, active
support from other
stakeholders, clear
goals
Leadership, problem-
solving, running
interference, providing
support
Daily check-in and
weekly status meeting
with team, weekly
meeting with sponsor,
monthly meeting with
customer
Team,
Sponsor,
Customer
Exercise 5–5 continued from previous page.
Copyright2015.AMASelf-Study.
Allrightsreserved.Maynotbereproducedinanyformwithoutpermissionfromthepublisher,exceptfairusespermittedunderU.S.orapplicablecopyrightlaw.
EBSCO Publishing : eBook Collection (EBSCOhost) - printed on 10/19/2019 3:57 PM via UNIVERSIDAD NACIONAL ABIERTA Y A DISTANCIA - UNAD
AN: 1520886 ; Dobson, Michael Singer.; Successful Project Management : How to Complete Projects on Time, on Budget, and on Target
Account: ns145102.main.eds
The first iteration of a project plan is an important milestone,
but not the end of the process. Normally, you should expect
to develop a lot of additional information and detail to flesh
out the plan and address issues.
Staffing and developing the project team must involve
determining the skills your project requires and the skills that
team members bring to the table. You may need to negotiate
(or renegotiate) team size based on this analysis. A responsibility assignment
matrix (RAM) is often used for this purpose. When you assign team members
to activities in your network diagram (known as loading the schedule), you
may discover that you have booked the same team member on simultaneous
activities. To resolve the problem, you must level the schedule, either by mov-
ing the start date of tasks to allow the same person to complete both, or by
obtaining additional resources to cover the overlap. In addition to in-house
resources, outsourcing may be an option.
Make or buy decisions are used to determine whether it is best to do par-
ticular project activities in-house or procure them elsewhere. Such decisions
should be made as early in the project planning process as feasible. Procure-
ment requires active management and will likely alter your list of activities,
network diagram, and other project planning documents.
The critical path method (CPM) takes advantage of the fact that there is
often a financial benefit to finish a project early, and that additional resources
can speed up many activities. As long as you spend less in additional resources
than the time savings is worth, you end up with a project that is both faster
and cheaper. In crashing a project, you focus on critical path activities, because
shortening them will shorten project duration, whereas shortening noncritical
activities only increases the amount of slack.
A communications and stakeholder management plan allows you to de-
fine the specific communications strategies and activities you will follow, so
that you can add them to the work of the project.
PREPARING A PROJECT PLAN 93
© American Management Association. All rights reserved.
http://www.amanet.org/
Copyright2015.AMASelf-Study.
Allrightsreserved.Maynotbereproducedinanyformwithoutpermissionfromthepublisher,exceptfairusespermittedunderU.S.orapplicablecopyrightlaw.
EBSCO Publishing : eBook Collection (EBSCOhost) - printed on 10/19/2019 3:57 PM via UNIVERSIDAD NACIONAL ABIERTA Y A DISTANCIA - UNAD
AN: 1520886 ; Dobson, Michael Singer.; Successful Project Management : How to Complete Projects on Time, on Budget, and on Target
Account: ns145102.main.eds
Why should you prepare a communications and stakeholder 1. (d)1.
management plan?
To keep the CEO and top executives up to date on project progress(a)
To ensure that project team members know the activities for which(b)
they are responsible
To keep stock analysts informed of major projects(c)
To avoid forgetting who is supposed to know what, when, and how often(d)
The value of critical path analysis is: 2. (a)2.
to determine when spending additional resources to speed up an(a)
activity is profitable.
to manage the effects of uncertainty in a project plan.(b)
to determine the total duration of a project with parallel activities.(c)
to manage loading and leveling of the schedule.(d)
If John is assigned to two parallel activities with schedule dates that 3. (d)3.
overlap, one solution is to:
tell John to do the activities and not be late, or there will be(a)
consequences.
stop the project because it cannot be accomplished.(b)
document the problem in your regular progress report.(c)
find another person to do one of the activities.(d)
What is the difference between PERT and CPM? 4. (c)4.
CPM is designed to help plan projects with high uncertainty;(a)
PERT is designed to determine when extra resources will
profitably speed the schedule.
PERT is designed to help plan projects with complex technical(b)
activities; CPM is designed to plan projects with large numbers of
team members.
PERT is designed to help plan projects with high uncertainty;(c)
CPM is designed to determine when extra resources will
profitably speed the schedule.
PERT is designed to plan projects using a lot of contracting and(d)
outsourcing; CPM is designed to plan projects when in-house
resources will be used.
What is a responsibility assignment matrix? 5. (c)5.
A list of skills required to complete project activities(a)
A tool to ensure that all communications and stakeholder management(b)
activities have owners
A tool that links resources to activities(c)
A list of skills possessed by your team members(d)
Review Questions
94 SUCCESSFUL PROJECT MANAGEMENT
© American Management Association. All rights reserved.
http://www.amanet.org/
Copyright2015.AMASelf-Study.
Allrightsreserved.Maynotbereproducedinanyformwithoutpermissionfromthepublisher,exceptfairusespermittedunderU.S.orapplicablecopyrightlaw.
EBSCO Publishing : eBook Collection (EBSCOhost) - printed on 10/19/2019 3:57 PM via UNIVERSIDAD NACIONAL ABIERTA Y A DISTANCIA - UNAD
AN: 1520886 ; Dobson, Michael Singer.; Successful Project Management : How to Complete Projects on Time, on Budget, and on Target
Account: ns145102.main.eds
Dobson michael pag 52 106

More Related Content

Similar to Dobson michael pag 52 106

2Project_management. Ghjjkkutfghuuijkpdf
2Project_management. Ghjjkkutfghuuijkpdf2Project_management. Ghjjkkutfghuuijkpdf
2Project_management. GhjjkkutfghuuijkpdfRedietWegene
 
MGT 3302, Introduction to Project Management 1 Cou.docx
MGT 3302, Introduction to Project Management 1 Cou.docxMGT 3302, Introduction to Project Management 1 Cou.docx
MGT 3302, Introduction to Project Management 1 Cou.docxadkinspaige22
 
Primavera Project Management P6 Course session 4
Primavera Project Management P6 Course session 4Primavera Project Management P6 Course session 4
Primavera Project Management P6 Course session 4Mohamed Adel
 
ms-project-presentation.pptx
ms-project-presentation.pptxms-project-presentation.pptx
ms-project-presentation.pptxSunilHotkar2
 
dokumen.tips_ms-project-presentation.pptx
dokumen.tips_ms-project-presentation.pptxdokumen.tips_ms-project-presentation.pptx
dokumen.tips_ms-project-presentation.pptxSunilHotkar2
 
Critical Path MethodIntroductionOnce you have the network diag.docx
Critical Path MethodIntroductionOnce you have the network diag.docxCritical Path MethodIntroductionOnce you have the network diag.docx
Critical Path MethodIntroductionOnce you have the network diag.docxannettsparrow
 
12 lecture project scheduling 4
12 lecture project scheduling 412 lecture project scheduling 4
12 lecture project scheduling 4Ahmad Basim Hamza
 
MS Project Presentation
MS Project PresentationMS Project Presentation
MS Project PresentationKhem Singh
 
Ms project presentation
Ms project presentationMs project presentation
Ms project presentationKhem Singh
 
[Guide] How to create a realistic project schedule
[Guide] How to create a realistic project schedule[Guide] How to create a realistic project schedule
[Guide] How to create a realistic project scheduleDmitriy Nizhebetskiy
 
MGT 3302, Introduction to Project Management 1 Cou.docx
MGT 3302, Introduction to Project Management 1 Cou.docxMGT 3302, Introduction to Project Management 1 Cou.docx
MGT 3302, Introduction to Project Management 1 Cou.docxtarifarmarie
 
PMGT 510Principles of Project ManagementGroup Assign.docx
PMGT 510Principles of Project ManagementGroup Assign.docxPMGT 510Principles of Project ManagementGroup Assign.docx
PMGT 510Principles of Project ManagementGroup Assign.docxstilliegeorgiana
 
Project NameCommunication PlanOverviewEffective and .docx
Project NameCommunication PlanOverviewEffective and .docxProject NameCommunication PlanOverviewEffective and .docx
Project NameCommunication PlanOverviewEffective and .docxwkyra78
 
Taming an Unruly Schedule with the 14 Point Schedule Assessment
Taming an Unruly Schedule with the 14 Point Schedule AssessmentTaming an Unruly Schedule with the 14 Point Schedule Assessment
Taming an Unruly Schedule with the 14 Point Schedule AssessmentAcumen
 
44259126 ms-project-presentation
44259126 ms-project-presentation44259126 ms-project-presentation
44259126 ms-project-presentationFarrukh Raja
 
Project TimeIST4055Chapter 6Now that you have the Sc.docx
Project TimeIST4055Chapter 6Now that you have the Sc.docxProject TimeIST4055Chapter 6Now that you have the Sc.docx
Project TimeIST4055Chapter 6Now that you have the Sc.docxbriancrawford30935
 
Chapter 12(cpm pert)
Chapter 12(cpm pert)Chapter 12(cpm pert)
Chapter 12(cpm pert)Debanjan15
 
Module OverviewPERT stands for Program Evaluation and Review Tec.docx
Module OverviewPERT stands for Program Evaluation and Review Tec.docxModule OverviewPERT stands for Program Evaluation and Review Tec.docx
Module OverviewPERT stands for Program Evaluation and Review Tec.docxgilpinleeanna
 

Similar to Dobson michael pag 52 106 (20)

2Project_management. Ghjjkkutfghuuijkpdf
2Project_management. Ghjjkkutfghuuijkpdf2Project_management. Ghjjkkutfghuuijkpdf
2Project_management. Ghjjkkutfghuuijkpdf
 
MGT 3302, Introduction to Project Management 1 Cou.docx
MGT 3302, Introduction to Project Management 1 Cou.docxMGT 3302, Introduction to Project Management 1 Cou.docx
MGT 3302, Introduction to Project Management 1 Cou.docx
 
Pmp6
Pmp6Pmp6
Pmp6
 
Lecture 2 PERT-CPM.pdf
Lecture 2 PERT-CPM.pdfLecture 2 PERT-CPM.pdf
Lecture 2 PERT-CPM.pdf
 
Primavera Project Management P6 Course session 4
Primavera Project Management P6 Course session 4Primavera Project Management P6 Course session 4
Primavera Project Management P6 Course session 4
 
ms-project-presentation.pptx
ms-project-presentation.pptxms-project-presentation.pptx
ms-project-presentation.pptx
 
dokumen.tips_ms-project-presentation.pptx
dokumen.tips_ms-project-presentation.pptxdokumen.tips_ms-project-presentation.pptx
dokumen.tips_ms-project-presentation.pptx
 
Critical Path MethodIntroductionOnce you have the network diag.docx
Critical Path MethodIntroductionOnce you have the network diag.docxCritical Path MethodIntroductionOnce you have the network diag.docx
Critical Path MethodIntroductionOnce you have the network diag.docx
 
12 lecture project scheduling 4
12 lecture project scheduling 412 lecture project scheduling 4
12 lecture project scheduling 4
 
MS Project Presentation
MS Project PresentationMS Project Presentation
MS Project Presentation
 
Ms project presentation
Ms project presentationMs project presentation
Ms project presentation
 
[Guide] How to create a realistic project schedule
[Guide] How to create a realistic project schedule[Guide] How to create a realistic project schedule
[Guide] How to create a realistic project schedule
 
MGT 3302, Introduction to Project Management 1 Cou.docx
MGT 3302, Introduction to Project Management 1 Cou.docxMGT 3302, Introduction to Project Management 1 Cou.docx
MGT 3302, Introduction to Project Management 1 Cou.docx
 
PMGT 510Principles of Project ManagementGroup Assign.docx
PMGT 510Principles of Project ManagementGroup Assign.docxPMGT 510Principles of Project ManagementGroup Assign.docx
PMGT 510Principles of Project ManagementGroup Assign.docx
 
Project NameCommunication PlanOverviewEffective and .docx
Project NameCommunication PlanOverviewEffective and .docxProject NameCommunication PlanOverviewEffective and .docx
Project NameCommunication PlanOverviewEffective and .docx
 
Taming an Unruly Schedule with the 14 Point Schedule Assessment
Taming an Unruly Schedule with the 14 Point Schedule AssessmentTaming an Unruly Schedule with the 14 Point Schedule Assessment
Taming an Unruly Schedule with the 14 Point Schedule Assessment
 
44259126 ms-project-presentation
44259126 ms-project-presentation44259126 ms-project-presentation
44259126 ms-project-presentation
 
Project TimeIST4055Chapter 6Now that you have the Sc.docx
Project TimeIST4055Chapter 6Now that you have the Sc.docxProject TimeIST4055Chapter 6Now that you have the Sc.docx
Project TimeIST4055Chapter 6Now that you have the Sc.docx
 
Chapter 12(cpm pert)
Chapter 12(cpm pert)Chapter 12(cpm pert)
Chapter 12(cpm pert)
 
Module OverviewPERT stands for Program Evaluation and Review Tec.docx
Module OverviewPERT stands for Program Evaluation and Review Tec.docxModule OverviewPERT stands for Program Evaluation and Review Tec.docx
Module OverviewPERT stands for Program Evaluation and Review Tec.docx
 

More from alextm76

Project management, planning and control
Project management, planning and control Project management, planning and control
Project management, planning and control alextm76
 
Dobson michael pag 41 54
Dobson michael pag 41  54Dobson michael pag 41  54
Dobson michael pag 41 54alextm76
 
Enfoque estructuralista
Enfoque estructuralistaEnfoque estructuralista
Enfoque estructuralistaalextm76
 
Articulos prensa
Articulos prensaArticulos prensa
Articulos prensaalextm76
 
Coliseo iván de bedout dhad
Coliseo iván de bedout dhadColiseo iván de bedout dhad
Coliseo iván de bedout dhadalextm76
 
Zulma20[1]
Zulma20[1]Zulma20[1]
Zulma20[1]alextm76
 
proceso unificado de software
proceso unificado de softwareproceso unificado de software
proceso unificado de softwarealextm76
 

More from alextm76 (7)

Project management, planning and control
Project management, planning and control Project management, planning and control
Project management, planning and control
 
Dobson michael pag 41 54
Dobson michael pag 41  54Dobson michael pag 41  54
Dobson michael pag 41 54
 
Enfoque estructuralista
Enfoque estructuralistaEnfoque estructuralista
Enfoque estructuralista
 
Articulos prensa
Articulos prensaArticulos prensa
Articulos prensa
 
Coliseo iván de bedout dhad
Coliseo iván de bedout dhadColiseo iván de bedout dhad
Coliseo iván de bedout dhad
 
Zulma20[1]
Zulma20[1]Zulma20[1]
Zulma20[1]
 
proceso unificado de software
proceso unificado de softwareproceso unificado de software
proceso unificado de software
 

Recently uploaded

(8264348440) 🔝 Call Girls In Mahipalpur 🔝 Delhi NCR
(8264348440) 🔝 Call Girls In Mahipalpur 🔝 Delhi NCR(8264348440) 🔝 Call Girls In Mahipalpur 🔝 Delhi NCR
(8264348440) 🔝 Call Girls In Mahipalpur 🔝 Delhi NCRsoniya singh
 
BEST Call Girls In BELLMONT HOTEL ✨ 9773824855 ✨ Escorts Service In Delhi Ncr,
BEST Call Girls In BELLMONT HOTEL ✨ 9773824855 ✨ Escorts Service In Delhi Ncr,BEST Call Girls In BELLMONT HOTEL ✨ 9773824855 ✨ Escorts Service In Delhi Ncr,
BEST Call Girls In BELLMONT HOTEL ✨ 9773824855 ✨ Escorts Service In Delhi Ncr,noida100girls
 
Islamabad Escorts | Call 03274100048 | Escort Service in Islamabad
Islamabad Escorts | Call 03274100048 | Escort Service in IslamabadIslamabad Escorts | Call 03274100048 | Escort Service in Islamabad
Islamabad Escorts | Call 03274100048 | Escort Service in IslamabadAyesha Khan
 
Tech Startup Growth Hacking 101 - Basics on Growth Marketing
Tech Startup Growth Hacking 101  - Basics on Growth MarketingTech Startup Growth Hacking 101  - Basics on Growth Marketing
Tech Startup Growth Hacking 101 - Basics on Growth MarketingShawn Pang
 
A.I. Bot Summit 3 Opening Keynote - Perry Belcher
A.I. Bot Summit 3 Opening Keynote - Perry BelcherA.I. Bot Summit 3 Opening Keynote - Perry Belcher
A.I. Bot Summit 3 Opening Keynote - Perry BelcherPerry Belcher
 
CATALOG cáp điện Goldcup (bảng giá) 1.4.2024.PDF
CATALOG cáp điện Goldcup (bảng giá) 1.4.2024.PDFCATALOG cáp điện Goldcup (bảng giá) 1.4.2024.PDF
CATALOG cáp điện Goldcup (bảng giá) 1.4.2024.PDFOrient Homes
 
Lowrate Call Girls In Laxmi Nagar Delhi ❤️8860477959 Escorts 100% Genuine Ser...
Lowrate Call Girls In Laxmi Nagar Delhi ❤️8860477959 Escorts 100% Genuine Ser...Lowrate Call Girls In Laxmi Nagar Delhi ❤️8860477959 Escorts 100% Genuine Ser...
Lowrate Call Girls In Laxmi Nagar Delhi ❤️8860477959 Escorts 100% Genuine Ser...lizamodels9
 
Lowrate Call Girls In Sector 18 Noida ❤️8860477959 Escorts 100% Genuine Servi...
Lowrate Call Girls In Sector 18 Noida ❤️8860477959 Escorts 100% Genuine Servi...Lowrate Call Girls In Sector 18 Noida ❤️8860477959 Escorts 100% Genuine Servi...
Lowrate Call Girls In Sector 18 Noida ❤️8860477959 Escorts 100% Genuine Servi...lizamodels9
 
Progress Report - Oracle Database Analyst Summit
Progress  Report - Oracle Database Analyst SummitProgress  Report - Oracle Database Analyst Summit
Progress Report - Oracle Database Analyst SummitHolger Mueller
 
RE Capital's Visionary Leadership under Newman Leech
RE Capital's Visionary Leadership under Newman LeechRE Capital's Visionary Leadership under Newman Leech
RE Capital's Visionary Leadership under Newman LeechNewman George Leech
 
Investment analysis and portfolio management
Investment analysis and portfolio managementInvestment analysis and portfolio management
Investment analysis and portfolio managementJunaidKhan750825
 
Call Girls In ⇛⇛Chhatarpur⇚⇚. Brings Offer Delhi Contact Us 8377877756
Call Girls In ⇛⇛Chhatarpur⇚⇚. Brings Offer Delhi Contact Us 8377877756Call Girls In ⇛⇛Chhatarpur⇚⇚. Brings Offer Delhi Contact Us 8377877756
Call Girls In ⇛⇛Chhatarpur⇚⇚. Brings Offer Delhi Contact Us 8377877756dollysharma2066
 
Call Girls In Connaught Place Delhi ❤️88604**77959_Russian 100% Genuine Escor...
Call Girls In Connaught Place Delhi ❤️88604**77959_Russian 100% Genuine Escor...Call Girls In Connaught Place Delhi ❤️88604**77959_Russian 100% Genuine Escor...
Call Girls In Connaught Place Delhi ❤️88604**77959_Russian 100% Genuine Escor...lizamodels9
 
Call Girls In Sikandarpur Gurgaon ❤️8860477959_Russian 100% Genuine Escorts I...
Call Girls In Sikandarpur Gurgaon ❤️8860477959_Russian 100% Genuine Escorts I...Call Girls In Sikandarpur Gurgaon ❤️8860477959_Russian 100% Genuine Escorts I...
Call Girls In Sikandarpur Gurgaon ❤️8860477959_Russian 100% Genuine Escorts I...lizamodels9
 
Vip Dewas Call Girls #9907093804 Contact Number Escorts Service Dewas
Vip Dewas Call Girls #9907093804 Contact Number Escorts Service DewasVip Dewas Call Girls #9907093804 Contact Number Escorts Service Dewas
Vip Dewas Call Girls #9907093804 Contact Number Escorts Service Dewasmakika9823
 
(8264348440) 🔝 Call Girls In Keshav Puram 🔝 Delhi NCR
(8264348440) 🔝 Call Girls In Keshav Puram 🔝 Delhi NCR(8264348440) 🔝 Call Girls In Keshav Puram 🔝 Delhi NCR
(8264348440) 🔝 Call Girls In Keshav Puram 🔝 Delhi NCRsoniya singh
 
(8264348440) 🔝 Call Girls In Hauz Khas 🔝 Delhi NCR
(8264348440) 🔝 Call Girls In Hauz Khas 🔝 Delhi NCR(8264348440) 🔝 Call Girls In Hauz Khas 🔝 Delhi NCR
(8264348440) 🔝 Call Girls In Hauz Khas 🔝 Delhi NCRsoniya singh
 
Lean: From Theory to Practice — One City’s (and Library’s) Lean Story… Abridged
Lean: From Theory to Practice — One City’s (and Library’s) Lean Story… AbridgedLean: From Theory to Practice — One City’s (and Library’s) Lean Story… Abridged
Lean: From Theory to Practice — One City’s (and Library’s) Lean Story… AbridgedKaiNexus
 

Recently uploaded (20)

KestrelPro Flyer Japan IT Week 2024 (English)
KestrelPro Flyer Japan IT Week 2024 (English)KestrelPro Flyer Japan IT Week 2024 (English)
KestrelPro Flyer Japan IT Week 2024 (English)
 
(8264348440) 🔝 Call Girls In Mahipalpur 🔝 Delhi NCR
(8264348440) 🔝 Call Girls In Mahipalpur 🔝 Delhi NCR(8264348440) 🔝 Call Girls In Mahipalpur 🔝 Delhi NCR
(8264348440) 🔝 Call Girls In Mahipalpur 🔝 Delhi NCR
 
Enjoy ➥8448380779▻ Call Girls In Sector 18 Noida Escorts Delhi NCR
Enjoy ➥8448380779▻ Call Girls In Sector 18 Noida Escorts Delhi NCREnjoy ➥8448380779▻ Call Girls In Sector 18 Noida Escorts Delhi NCR
Enjoy ➥8448380779▻ Call Girls In Sector 18 Noida Escorts Delhi NCR
 
BEST Call Girls In BELLMONT HOTEL ✨ 9773824855 ✨ Escorts Service In Delhi Ncr,
BEST Call Girls In BELLMONT HOTEL ✨ 9773824855 ✨ Escorts Service In Delhi Ncr,BEST Call Girls In BELLMONT HOTEL ✨ 9773824855 ✨ Escorts Service In Delhi Ncr,
BEST Call Girls In BELLMONT HOTEL ✨ 9773824855 ✨ Escorts Service In Delhi Ncr,
 
Islamabad Escorts | Call 03274100048 | Escort Service in Islamabad
Islamabad Escorts | Call 03274100048 | Escort Service in IslamabadIslamabad Escorts | Call 03274100048 | Escort Service in Islamabad
Islamabad Escorts | Call 03274100048 | Escort Service in Islamabad
 
Tech Startup Growth Hacking 101 - Basics on Growth Marketing
Tech Startup Growth Hacking 101  - Basics on Growth MarketingTech Startup Growth Hacking 101  - Basics on Growth Marketing
Tech Startup Growth Hacking 101 - Basics on Growth Marketing
 
A.I. Bot Summit 3 Opening Keynote - Perry Belcher
A.I. Bot Summit 3 Opening Keynote - Perry BelcherA.I. Bot Summit 3 Opening Keynote - Perry Belcher
A.I. Bot Summit 3 Opening Keynote - Perry Belcher
 
CATALOG cáp điện Goldcup (bảng giá) 1.4.2024.PDF
CATALOG cáp điện Goldcup (bảng giá) 1.4.2024.PDFCATALOG cáp điện Goldcup (bảng giá) 1.4.2024.PDF
CATALOG cáp điện Goldcup (bảng giá) 1.4.2024.PDF
 
Lowrate Call Girls In Laxmi Nagar Delhi ❤️8860477959 Escorts 100% Genuine Ser...
Lowrate Call Girls In Laxmi Nagar Delhi ❤️8860477959 Escorts 100% Genuine Ser...Lowrate Call Girls In Laxmi Nagar Delhi ❤️8860477959 Escorts 100% Genuine Ser...
Lowrate Call Girls In Laxmi Nagar Delhi ❤️8860477959 Escorts 100% Genuine Ser...
 
Lowrate Call Girls In Sector 18 Noida ❤️8860477959 Escorts 100% Genuine Servi...
Lowrate Call Girls In Sector 18 Noida ❤️8860477959 Escorts 100% Genuine Servi...Lowrate Call Girls In Sector 18 Noida ❤️8860477959 Escorts 100% Genuine Servi...
Lowrate Call Girls In Sector 18 Noida ❤️8860477959 Escorts 100% Genuine Servi...
 
Progress Report - Oracle Database Analyst Summit
Progress  Report - Oracle Database Analyst SummitProgress  Report - Oracle Database Analyst Summit
Progress Report - Oracle Database Analyst Summit
 
RE Capital's Visionary Leadership under Newman Leech
RE Capital's Visionary Leadership under Newman LeechRE Capital's Visionary Leadership under Newman Leech
RE Capital's Visionary Leadership under Newman Leech
 
Investment analysis and portfolio management
Investment analysis and portfolio managementInvestment analysis and portfolio management
Investment analysis and portfolio management
 
Call Girls In ⇛⇛Chhatarpur⇚⇚. Brings Offer Delhi Contact Us 8377877756
Call Girls In ⇛⇛Chhatarpur⇚⇚. Brings Offer Delhi Contact Us 8377877756Call Girls In ⇛⇛Chhatarpur⇚⇚. Brings Offer Delhi Contact Us 8377877756
Call Girls In ⇛⇛Chhatarpur⇚⇚. Brings Offer Delhi Contact Us 8377877756
 
Call Girls In Connaught Place Delhi ❤️88604**77959_Russian 100% Genuine Escor...
Call Girls In Connaught Place Delhi ❤️88604**77959_Russian 100% Genuine Escor...Call Girls In Connaught Place Delhi ❤️88604**77959_Russian 100% Genuine Escor...
Call Girls In Connaught Place Delhi ❤️88604**77959_Russian 100% Genuine Escor...
 
Call Girls In Sikandarpur Gurgaon ❤️8860477959_Russian 100% Genuine Escorts I...
Call Girls In Sikandarpur Gurgaon ❤️8860477959_Russian 100% Genuine Escorts I...Call Girls In Sikandarpur Gurgaon ❤️8860477959_Russian 100% Genuine Escorts I...
Call Girls In Sikandarpur Gurgaon ❤️8860477959_Russian 100% Genuine Escorts I...
 
Vip Dewas Call Girls #9907093804 Contact Number Escorts Service Dewas
Vip Dewas Call Girls #9907093804 Contact Number Escorts Service DewasVip Dewas Call Girls #9907093804 Contact Number Escorts Service Dewas
Vip Dewas Call Girls #9907093804 Contact Number Escorts Service Dewas
 
(8264348440) 🔝 Call Girls In Keshav Puram 🔝 Delhi NCR
(8264348440) 🔝 Call Girls In Keshav Puram 🔝 Delhi NCR(8264348440) 🔝 Call Girls In Keshav Puram 🔝 Delhi NCR
(8264348440) 🔝 Call Girls In Keshav Puram 🔝 Delhi NCR
 
(8264348440) 🔝 Call Girls In Hauz Khas 🔝 Delhi NCR
(8264348440) 🔝 Call Girls In Hauz Khas 🔝 Delhi NCR(8264348440) 🔝 Call Girls In Hauz Khas 🔝 Delhi NCR
(8264348440) 🔝 Call Girls In Hauz Khas 🔝 Delhi NCR
 
Lean: From Theory to Practice — One City’s (and Library’s) Lean Story… Abridged
Lean: From Theory to Practice — One City’s (and Library’s) Lean Story… AbridgedLean: From Theory to Practice — One City’s (and Library’s) Lean Story… Abridged
Lean: From Theory to Practice — One City’s (and Library’s) Lean Story… Abridged
 

Dobson michael pag 52 106

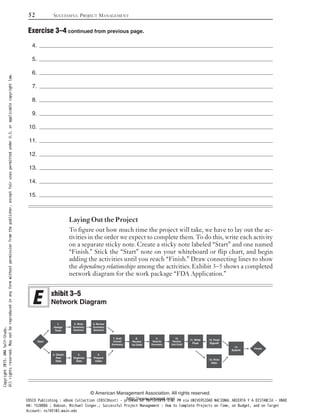
  • 1. 4. 5. 6. 7. 8. 9. 10. 11. 12. 13. 14. 15. Laying Out the Project To figure out how much time the project will take, we have to lay out the ac- tivities in the order we expect to complete them. To do this, write each activity on a separate sticky note. Create a sticky note labeled “Start” and one named “Finish.” Stick the “Start” note on your whiteboard or flip chart, and begin adding the activities until you reach “Finish.” Draw connecting lines to show the dependency relationships among the activities. Exhibit 3–5 shows a completed network diagram for the work package “FDA Application.” 52 SUCCESSFUL PROJECT MANAGEMENT © American Management Association. All rights reserved. http://www.amanet.org/ xhibit 3–5 Network Diagram Start FInish 1. Assign Team 2. Obtain Raw Data 3. ezinagrO Data 4. Prepare Index 5. Write Summary Sections 6. Review Summary Sections 7. Draft Overall Summary 8. Review 1st Draft 9. Rewrite Summary 10. Review 2nd Draft 11. Write Final 12. Final Signoff 13. Print Data 14. Submit Exercise 3–4 continued from previous page. Copyright2015.AMASelf-Study. Allrightsreserved.Maynotbereproducedinanyformwithoutpermissionfromthepublisher,exceptfairusespermittedunderU.S.orapplicablecopyrightlaw. EBSCO Publishing : eBook Collection (EBSCOhost) - printed on 10/19/2019 3:57 PM via UNIVERSIDAD NACIONAL ABIERTA Y A DISTANCIA - UNAD AN: 1520886 ; Dobson, Michael Singer.; Successful Project Management : How to Complete Projects on Time, on Budget, and on Target Account: ns145102.main.eds
  • 2. Instructions: Take the items from the activity list you prepared in Exercise 3–4. Write the activities on sticky notes, with one activity per note. Add two additional notes for “Start” and “Finish.” Use these notes to prepare a network diagram for the PMO project. Determining the Critical Path When two or more activities take place during the same time period (parallel activities), only the longest path of activities (known as the critical path) deter- mines how long the project will take. In Exhibit 3–6, we’ve assigned time estimates to each activity. Notice that the path Start 2 3 4 7 takes 0 + 4 + 12 + 3 + 2, or 21, weeks. The par- allel path Start 1 5 6 7 takes 0 + 1 + 4 + 8 + 2, or 15, weeks. We say that Start 2 3 4 7 is part of the critical path, which means we expect that part of the project to take 21 weeks to accomplish. If any of those critical path activities run longer than expected, the whole project will take longer to ac- complish. What if Activities 1, 5, or 6 take longer than expected? As long as their combined lateness doesn’t exceed six weeks, our project is still on schedule! We say that the path segment 1 5 6 has six weeks of slack or float. (“Slack” and “float” are synonyms. One term comes from CPM and the other from PERT, but they both describe the same thing.) Knowing the critical path tells you two things: first, how long the project is expected to take, and second, which activities have to stay on schedule in order to achieve that time estimate. Because you have extra time to complete activities with slack or float, you can worry less about them. In some cases, Exercise 3–5 Network Diagram PLANNING THE ACTIVITIES 53 © American Management Association. All rights reserved. http://www.amanet.org/ Critical activities are shown in solid black; noncritical activities (those with slack or float) are shown in gray. xhibit 3–6 Critical Path Start FInish 1. Assign Team 2. Obtain Raw Data 3. ezinagrO Data 4. Prepare Index 5. Write Summary Sections 6. Review Summary Sections 7. Draft Overall Summary 8. Review 1st Draft 9. Rewrite Summary 10. Review 2nd Draft 11. Write Final 12. Final Signoff 13. Print Data 14. Submit 0 weeks 0 weeks 1 weeks 4 weeks 12 weeks 4 weeks 8 weeks 3 weeks 2 weeks 6 weeks 2 weeks 6 weeks 2 weeks 3 weeks 6 weeks 1 weeks Total Time = 60 weeks Critical Path = 44 weeks Slack/Float = 6 weeks Slack/Float = 3 weeks Copyright2015.AMASelf-Study. Allrightsreserved.Maynotbereproducedinanyformwithoutpermissionfromthepublisher,exceptfairusespermittedunderU.S.orapplicablecopyrightlaw. EBSCO Publishing : eBook Collection (EBSCOhost) - printed on 10/19/2019 3:57 PM via UNIVERSIDAD NACIONAL ABIERTA Y A DISTANCIA - UNAD AN: 1520886 ; Dobson, Michael Singer.; Successful Project Management : How to Complete Projects on Time, on Budget, and on Target Account: ns145102.main.eds
  • 3. you can even move resources from an activity with lots of slack to an activity on the critical path as a way to make sure you stay on schedule. Remember that cost isn’t affected by the critical path. If you spend extra money on a noncritical activity, it has the same effect as if you spend extra money on a critical one. Although we haven’t yet estimated the duration of the various activities on the PMO project, what is your current feeling about the time constraint based on your current network diagram? Is it com- fortable, tight, or impossible? What makes you think so? Additional Scheduling Relationships All the relationships in our existing network diagram are of the type known as “finish to start” (FS), which means that the successor activity can’t start until the predecessor activity is finished. That’s by far the most common type of relationship, but it isn’t the only one. Finish to finish (FF) relationships describe situations in which one activity can’t finish until its predecessor activity has finished. In cooking Thanksgiving dinner, you don’t want to start the potatoes as soon as you put the turkey in the oven, but rather time the potatoes so that they finish at the same time. Start to start relationships (SS) say that an activity can’t start until its pred- ecessor has started. Let’s say you want to make a hundred widgets and put them in boxes. You don’t have to have all the widgets done before you put the first one in a box, but you do need some of them. Lag is additional time added to a relationship. In our widget example, you could start boxing the widgets two days after you start making them. That’s a start-to-start relationship with a two-day lag. Lead is when you overlap two activities. You could start making the pota- toes an hour before you finish cooking the turkey. Instead of a finish-to-finish relationship, this is now a finish-to-start relationship with a one-hour lead. Imposed dates are conditions when an outside date overrules a relationship. If you’re putting a swimming pool in the back yard and order a truckload of concrete, it doesn’t matter if you finish digging the hole early—the truck won’t come until it’s scheduled. If you finish the hole a day late, the consequences are much greater than a single day; you have to wait until the truck can come back and you may have to pay for the unused concrete. Think About It . . . Will You Make the Deadline? 54 SUCCESSFUL PROJECT MANAGEMENT © American Management Association. All rights reserved. http://www.amanet.org/ Copyright2015.AMASelf-Study. Allrightsreserved.Maynotbereproducedinanyformwithoutpermissionfromthepublisher,exceptfairusespermittedunderU.S.orapplicablecopyrightlaw. EBSCO Publishing : eBook Collection (EBSCOhost) - printed on 10/19/2019 3:57 PM via UNIVERSIDAD NACIONAL ABIERTA Y A DISTANCIA - UNAD AN: 1520886 ; Dobson, Michael Singer.; Successful Project Management : How to Complete Projects on Time, on Budget, and on Target Account: ns145102.main.eds
  • 4. Forward and Backward Pass For a lot of projects, it’s easy enough to find the critical path with a little in- spection. In Exhibit 3–6, there are only two short segments where there are multiple paths, and all you have to do is to compare the length of the top and bottom segments. For large projects, you’ll most likely use scheduling software, such as Mi- crosoft Project®. It will automatically determine the critical path once you’ve entered the duration and predecessor(s) of each activity. However, sometimes you’ll have a project that falls somewhere in between, so it’s useful to know how to calculate the critical path by hand. For that, you need to know how to perform a forward and backward pass. Exhibit 3–7 shows a sample project without any task names so you can just watch the numbers and learn how this process works. Forward Pass If an activity has slack or float, there is flexibility in the start and finish dates. The early start is the earliest the activity can start considering its predecessors, and the early finish is simply the early start plus the duration. The late finish is the latest date an activity can finish without affecting the critical path, and the late start is the late finish minus the duration. The forward pass calculates early start and early finish; the backward pass calculates late start and late finish. An activity is critical if the early/late start and early/late finish are the same. If there’s a difference, the amount of the difference is how much slack or float exists for that activity. Exhibit 3–7 shows a forward pass calculation. The top center number in each box is the duration. The top left number is the early start; the top right number is the early finish. PLANNING THE ACTIVITIES 55 © American Management Association. All rights reserved. http://www.amanet.org/ Source: Adapted from Managing Multiple Projects by Dobson and Dobson ©2011. Used by permission of the publisher, AMACOM Books, a division of American Management Association, New York, New York. All rights reserved. www.amacombooks.org xhibit 3–7 Forward Pass Copyright2015.AMASelf-Study. Allrightsreserved.Maynotbereproducedinanyformwithoutpermissionfromthepublisher,exceptfairusespermittedunderU.S.orapplicablecopyrightlaw. EBSCO Publishing : eBook Collection (EBSCOhost) - printed on 10/19/2019 3:57 PM via UNIVERSIDAD NACIONAL ABIERTA Y A DISTANCIA - UNAD AN: 1520886 ; Dobson, Michael Singer.; Successful Project Management : How to Complete Projects on Time, on Budget, and on Target Account: ns145102.main.eds
  • 5. Start with the first activity, “Activity A,” which always has an early start of zero. Its duration is zero; it finishes at zero. (An activity with a duration of zero is called a milestone.) Activities B and C are both dependent on A; they can’t start until A is finished. Because A is a milestone, B and C both start at zero as well. Because B has a duration of 15 days, its early finish is 15; C’s early finish is 11. Activity D is dependent on both B and C. Its early start is the latest of the early finishes of its predecessors. It therefore starts at 15, and 15 + 21 = 36, its early finish. E, on the other hand, only requires that C be finished, so its early start is 11, add 9, and its early finish is 20. Activity F only needs D. It starts at 36, adds 8, and ends at 44. G needs both D and E, so it begins at 36 (the later of the two predecessors) and ends at 48 (36 + 12). The last activity, H, needs both F and G. It takes the G finish of 48, adds 2, and now we know the duration of the project: 50 days. Exhibit 3–8 summarizes all these numbers. Backward Pass For the backward pass, we start with the end of the project and work backward to the start, figuring out the late finish and late start of each activity. Exhibit 3–9 shows how it works. The numbers are summarized in Exhibit 3–10. 56 SUCCESSFUL PROJECT MANAGEMENT © American Management Association. All rights reserved. http://www.amanet.org/ xhibit 3–8 Forward Pass Summary Activity Takes Early Start from Early Finish of: Early Start (plus) Duration = Early Finish A N/A 0 0 0 B A 0 15 15 C A 0 11 11 D Larger of C or D 15 21 36 E C 11 9 20 F D 36 8 44 G Larger of D or E 36 12 48 H Larger of F or G 48 2 50 Copyright2015.AMASelf-Study. Allrightsreserved.Maynotbereproducedinanyformwithoutpermissionfromthepublisher,exceptfairusespermittedunderU.S.orapplicablecopyrightlaw. EBSCO Publishing : eBook Collection (EBSCOhost) - printed on 10/19/2019 3:57 PM via UNIVERSIDAD NACIONAL ABIERTA Y A DISTANCIA - UNAD AN: 1520886 ; Dobson, Michael Singer.; Successful Project Management : How to Complete Projects on Time, on Budget, and on Target Account: ns145102.main.eds
  • 6. PLANNING THE ACTIVITIES 57 © American Management Association. All rights reserved. http://www.amanet.org/ Source: Adapted from Managing Multiple Projects by Dobson and Dobson ©2011. Used by permission of the publisher, AMACOM Books, a division of American Management Association, New York, New York. All rights reserved. www.amacombooks.org xhibit 3–9 Backward Pass xhibit 3–10 Backward Pass Summary Activity Takes Late Finish from Late Start of Late Finish (minus) Duration Late Start H Early Finish of H 50 2 48 G H 48 12 36 F H 48 8 40 E G 36 9 27 D Lesser of F or G 36 21 15 C Lesser of D or E 15 11 4 B D 15 15 0 A Lesser of B or C 0 0 0 Copyright2015.AMASelf-Study. Allrightsreserved.Maynotbereproducedinanyformwithoutpermissionfromthepublisher,exceptfairusespermittedunderU.S.orapplicablecopyrightlaw. EBSCO Publishing : eBook Collection (EBSCOhost) - printed on 10/19/2019 3:57 PM via UNIVERSIDAD NACIONAL ABIERTA Y A DISTANCIA - UNAD AN: 1520886 ; Dobson, Michael Singer.; Successful Project Management : How to Complete Projects on Time, on Budget, and on Target Account: ns145102.main.eds
  • 7. For Activity H, the late finish is 50 days, and so the late start is 50 – 2, or 48. That number becomes the late finish for both F and G. For F, take the late finish of 48, subtract 8, and the late start is 40. For G, 48 – 12 = 36. Going backward, you pretend as if the arrows are reversed. If you have more than one activity feeding a predecessor, this time you pass the lowest number. Activity D’s late finish is governed by G’s 36, rather than F’s 40, and 36 – 21 = 15. E only cares about G, so its late finish is 36 and its early finish is 27. However, it’s the late start of D that matters to both B and C. Both ac- tivities have a late finish of 15; B’s late start is zero and C’s late start is 4. The milestone, Activity A, ends up with a late finish and a late start of zero. Critical Path and Float Exhibit 3–11 puts all the numbers in their proper places. Now, we’ll determine the critical path and float. To start, let’s compare the late and early figures for each activity. The difference is zero for Activities A, B, D, G, and H. Those activities make up the critical path. Activities C, E, and F have float. For C, it’s four days (4 – 0 = 4). For E, 27 – 11 = 16 days of float. F has four days of float (40 – 36) as well. The num- bers are summarized in Exhibit 3–12. By the way, there’s a difference between total float, which is what we’ve just calculated, and free float. Let’s imagine that Activity C uses its float, and ends on day 15. Activity D, on the critical path, is unaffected. Activity E, with 16 days of float available, is also in good shape, but notice that because C is late, E has lost four of those 16 days even before it starts. C’s float is not free float, because it eats up some of E’s float. Activity F, on the other hand, has four 58 SUCCESSFUL PROJECT MANAGEMENT © American Management Association. All rights reserved. http://www.amanet.org/ Source: Adapted from Managing Multiple Projects by Dobson and Dobson ©2011. Used by permission of the publisher, AMACOM Books, a division of American Management Association, New York, New York. All rights reserved. www.amacombooks.org xhibit 3–11 Critical Path and Float Copyright2015.AMASelf-Study. Allrightsreserved.Maynotbereproducedinanyformwithoutpermissionfromthepublisher,exceptfairusespermittedunderU.S.orapplicablecopyrightlaw. EBSCO Publishing : eBook Collection (EBSCOhost) - printed on 10/19/2019 3:57 PM via UNIVERSIDAD NACIONAL ABIERTA Y A DISTANCIA - UNAD AN: 1520886 ; Dobson, Michael Singer.; Successful Project Management : How to Complete Projects on Time, on Budget, and on Target Account: ns145102.main.eds
  • 8. days of float, but if it uses all four days, Activity H still starts when scheduled. Because none of Activity F’s float comes from H, it is considered free float. Notice that in the case of Activity C, it can start as early as day 0 but can start as late as day 4. It has four days of total float; extra time before lateness jeopardizes the project deadline. However, if Activity C uses any of its float, the float available for Activity E is reduced because E will no longer start on Day 11. The float is shared, not free. The float in E and F, however, is free float, be- cause no other activity is affected if those activities use their available float. Ex- ercise 3–6 gives you an opportunity to practice the forward and backward pass. Instructions: Perform a forward and backward pass on the following figure. Determine the critical path and identify available float. Exercise 3–6 Identify Critical Path and Float PLANNING THE ACTIVITIES 59 © American Management Association. All rights reserved. http://www.amanet.org/ Exercise 3–6 continues on next page. Note that you will get the same answers if you use “Late Finish” and “Early Finish” instead. xhibit 3–12 Critical Path and Float Summary Activity Late Start (minus) Early Start Float Critical? A 0 0 0 Critical B 0 0 0 Critical C 4 0 4 Noncritical D 15 15 0 Critical E 27 11 16 Noncritical F 40 36 4 Noncritical G 36 36 0 Critical H 48 48 0 Critical Copyright2015.AMASelf-Study. Allrightsreserved.Maynotbereproducedinanyformwithoutpermissionfromthepublisher,exceptfairusespermittedunderU.S.orapplicablecopyrightlaw. EBSCO Publishing : eBook Collection (EBSCOhost) - printed on 10/19/2019 3:57 PM via UNIVERSIDAD NACIONAL ABIERTA Y A DISTANCIA - UNAD AN: 1520886 ; Dobson, Michael Singer.; Successful Project Management : How to Complete Projects on Time, on Budget, and on Target Account: ns145102.main.eds
  • 9. Source: Adapted from Managing Multiple Projects by Dobson and Dobson ©2011. Used by permission of the publisher, AMACOM Books, a division of American Management Association, New York, New York. All rights reserved. www.amacombooks.org GANTT CHART A Gantt chart is a timeline of project activities drawn as a bar chart over a calendar grid. Exhibit 3–13 shows a simple Gantt chart. As we mentioned earlier, a Gantt chart is very easy to produce if you have already done a network diagram. Create a table with a list of the activi- ties, the duration of each, and the predecessor or predecessors of each. Exhibit 3–14 shows you such a table, as developed from the network diagram in Ex- hibit 3–11. To build a Gantt chart using project management software, you simply enter this information in the appropriate columns and you’re done. To build a Gantt chart by hand, create a calendar grid and draw each activity as a straight line or bar from its start (determined by its predecessors) to its end (determined by its duration). If the duration of an activity is zero, it’s a mile- stone. The traditional symbol for a milestone in project management is a di- amond ( ). The sample Gantt chart in Exhibit 3–13 shows arrows connecting the end of each line to the activity that’s dependent on it. This is optional. Exhibit 3–15 shows a Gantt chart built from the table in Exhibit 3–14. 60 SUCCESSFUL PROJECT MANAGEMENT © American Management Association. All rights reserved. http://www.amanet.org/ Exercise 3–6 continued from previous page. Copyright2015.AMASelf-Study. Allrightsreserved.Maynotbereproducedinanyformwithoutpermissionfromthepublisher,exceptfairusespermittedunderU.S.orapplicablecopyrightlaw. EBSCO Publishing : eBook Collection (EBSCOhost) - printed on 10/19/2019 3:57 PM via UNIVERSIDAD NACIONAL ABIERTA Y A DISTANCIA - UNAD AN: 1520886 ; Dobson, Michael Singer.; Successful Project Management : How to Complete Projects on Time, on Budget, and on Target Account: ns145102.main.eds
  • 10. PLANNING THE ACTIVITIES 61 © American Management Association. All rights reserved. http://www.amanet.org/ Credit: Gantt chart created using MindView Business Edition, authored by V. Heilman in 2011. Used under the Creative Commons Attribution-Share Alike 3.0 Unported license. Retrieved from http://commons.wikimedia.org/wiki/File:Gantt_chart_example.png, 5 August 2013. xhibit 3–13 Gantt Chart xhibit 3–14 Gantt Chart Data Source: Adapted from Managing Multiple Projects by Dobson and Dobson ©2011. Used by permission of the publisher, AMACOM Books, a division of American Management Association, New York, New York. All rights reserved. www.amacombooks.org xhibit 3–15 Completed Gantt Chart Task Dur. Pred. 1 2 3 4 5 6 7 8 9 10 11 12 13 14 15 16 17 18 19 20 21 22 23 24 25 26 27 28 29 30 31 32 33 34 35 36 37 38 39 40 41 42 43 44 45 46 47 48 49 50 Task A 0d — Task B 15d A Task C 11d A Task D 21d B,C Task E 9d C Task F 8d D Task G 12d D,E Task H 2d F,G GANTT CHART Activity Duration Predecessor(s) A 0 N/A B 15d A C 11d A D 21d B, C E 9d C F 8d D G 12d E, G H 2d F, G Copyright2015.AMASelf-Study. Allrightsreserved.Maynotbereproducedinanyformwithoutpermissionfromthepublisher,exceptfairusespermittedunderU.S.orapplicablecopyrightlaw. EBSCO Publishing : eBook Collection (EBSCOhost) - printed on 10/19/2019 3:57 PM via UNIVERSIDAD NACIONAL ABIERTA Y A DISTANCIA - UNAD AN: 1520886 ; Dobson, Michael Singer.; Successful Project Management : How to Complete Projects on Time, on Budget, and on Target Account: ns145102.main.eds
  • 11. Instructions: Take the network diagram from Exercise 3–6 and turn it into a Gantt chart. Activity Duration Predecessor(s) Exercise 3–7 Draw a Gantt Chart Task 1 2 3 4 5 6 7 8 9 10 11 12 13 14 15 16 17 18 19 20 21 62 SUCCESSFUL PROJECT MANAGEMENT © American Management Association. All rights reserved. http://www.amanet.org/ Copyright2015.AMASelf-Study. Allrightsreserved.Maynotbereproducedinanyformwithoutpermissionfromthepublisher,exceptfairusespermittedunderU.S.orapplicablecopyrightlaw. EBSCO Publishing : eBook Collection (EBSCOhost) - printed on 10/19/2019 3:57 PM via UNIVERSIDAD NACIONAL ABIERTA Y A DISTANCIA - UNAD AN: 1520886 ; Dobson, Michael Singer.; Successful Project Management : How to Complete Projects on Time, on Budget, and on Target Account: ns145102.main.eds
  • 12. Project planning is an iterative process. You need an initial draft of a project plan in order to develop a final one. The process begins by developing a project statement of work (SOW), a narrative description of the project. In technology and construction projects, you often need to prepare a re- quirements document and requirements traceability matrix, but this is not required in all cases. The work breakdown structure (WBS) is at the core of effective project management. Whether done in an org chart or outline format, it decomposes the project into manageable components and organizes the work of the project to make it easier to manage. Both top-down and bottom-up approaches are used in developing a project WBS. The WBS can be organized by department or skill area, phase, or many other ways; there is seldom only one right WBS for a given project. Follow the 100% rule and make sure that each level of de- composition includes 100% of the scope needed for each higher level. If something isn’t in the WBS, it won’t be in the project. Although Gantt charts are more frequently used for project scheduling, a network diagram is easier to create and can be turned into a Gantt chart when finalized. To build a network diagram, you must create an activity list from your WBS, then arrange the activities in the order you plan to perform them. Activities can be dependent on other activities or parallel to them, de- pending on the nature of the work and your choices. Most activity relation- ships are “finish to start” (the successor activity can’t start until the predecessor activity is finished), but “start to start” and “finish to finish” relationships are also possible. Relationships can be adjusted by adding lag time or subtracting lead time. Some project activities have “imposed dates” that override normal activity relationships. The critical path is the longest path from the project start to the project finish. If any activity on the critical path is delayed, the deadline is jeopardized. Other parallel activities may have slack or float, or extra time to complete them before they, too, become critical. In simple projects, it’s usually easy to spot the critical path. In very com- plex projects, use project management software to find the critical path and identify slack or float. You can determine the critical path, slack, and float manually by using the forward and backward pass technique. PLANNING THE ACTIVITIES 63 © American Management Association. All rights reserved. http://www.amanet.org/ Copyright2015.AMASelf-Study. Allrightsreserved.Maynotbereproducedinanyformwithoutpermissionfromthepublisher,exceptfairusespermittedunderU.S.orapplicablecopyrightlaw. EBSCO Publishing : eBook Collection (EBSCOhost) - printed on 10/19/2019 3:57 PM via UNIVERSIDAD NACIONAL ABIERTA Y A DISTANCIA - UNAD AN: 1520886 ; Dobson, Michael Singer.; Successful Project Management : How to Complete Projects on Time, on Budget, and on Target Account: ns145102.main.eds
  • 13. To prepare a WBS, you should: 1. (d)1. use a top-down approach.(a) make sure each category has the same number of levels.(b) organize the project scope into an outline structure.(c) decompose the total project scope into a hierarchy.(d) An example of a nonfunctional requirement is: 2. (b)2. the type of material to be used.(a) ease of use of the final product.(b) a maintenance manual for the product.(c) mean time between failures.(d) What is a parallel activity? 3. (a)3. An activity performed at the same time as another activity(a) An activity that is necessary but outside the scope of the project(b) An activity that must directly follow another activity(c) An activity that contains slack or float(d) The project statement of work (SOW) is: 4. (b)4. the hierarchical decomposition of the project work.(a) a narrative description of the project scope.(b) an activity list of the work that must be completed.(c) the requirements traceability matrix for the project.(d) What is the late finish of an activity? 5. (a)5. The latest an activity can finish without delaying a critical(a) path activity An activity that has missed its deadline(b) The latest an activity can start based on its relationship(c) to predecessor activities The date a parallel activity can begin(d) Review Questions 64 SUCCESSFUL PROJECT MANAGEMENT © American Management Association. All rights reserved. http://www.amanet.org/ Copyright2015.AMASelf-Study. Allrightsreserved.Maynotbereproducedinanyformwithoutpermissionfromthepublisher,exceptfairusespermittedunderU.S.orapplicablecopyrightlaw. EBSCO Publishing : eBook Collection (EBSCOhost) - printed on 10/19/2019 3:57 PM via UNIVERSIDAD NACIONAL ABIERTA Y A DISTANCIA - UNAD AN: 1520886 ; Dobson, Michael Singer.; Successful Project Management : How to Complete Projects on Time, on Budget, and on Target Account: ns145102.main.eds
  • 14. 4EstimatingtheActivities Learning Objectives By the end of this chapter, you should be able to: • Describe the process of progressively elabo- rating the initial project plan. • Define the difference between rough order of magnitude, preliminary, and definitive esti- mates and give circumstances in which each is appropriate. • Explain standard estimating techniques of analogous estimating, expert judgment esti- mating, Delphi method estimating, paramet- ric estimating, and bottom-up estimating. • Define three-point estimating and the two methods that use it; perform PERT calcula- tions using three-point estimates. • List common issues in estimating, including overoptimism, the role of contingency al- lowances, and the use of rolling wave esti- mates. Estimated timing for this chapter: Reading 45 minutes Exercises 1 hour 15 minutes Review Questions 10 minutes Total Time 2 hours 10 minutes © American Management Association. All rights reserved. http://www.amanet.org/ 65 Copyright2015.AMASelf-Study. Allrightsreserved.Maynotbereproducedinanyformwithoutpermissionfromthepublisher,exceptfairusespermittedunderU.S.orapplicablecopyrightlaw. EBSCO Publishing : eBook Collection (EBSCOhost) - printed on 10/19/2019 3:57 PM via UNIVERSIDAD NACIONAL ABIERTA Y A DISTANCIA - UNAD AN: 1520886 ; Dobson, Michael Singer.; Successful Project Management : How to Complete Projects on Time, on Budget, and on Target Account: ns145102.main.eds
  • 15. UNCERTAINTY IN PROJECT PLANNING Our first version of a network diagram is an important milestone in develop- ing a comprehensive and workable project management approach, but it’s hardly the end of the process. How long will these activities take? How much will they cost? Sometimes we know exactly how long an activity will take and exactly what it will cost. If you sign up to take a three-day seminar, it will take three days—not two, and not four. If the seminar has a firm, fixed price of $1,250, then it will cost $1,250. Of course, there may be secondary considerations. If you have to travel to another city and rent a car and a hotel room, you’ll incur those costs, and they may vary depending on when and where you go, or how far in advance you book. And if you’re traveling, you’ll probably need to leave at least a day earlier, and may need to stay over an extra day, depending on flights. With a little research, you can probably firm up those extra costs and travel times, but in other cases you may be looking at a great deal more un- certainty. At the beginning of this chapter, there’s a time estimate for how long we expect it will take you to complete it. The reading time is based on the word count and the average reading speed, which is 200 words per minute. “Average,” of course, recognizes that some people read faster and others slower. If you’re already familiar with project management, you may need less time to absorb the concepts than if they are entirely new to you. If you are supposed to gather user needs for a new IT system, the actual time will be affected by how many users you survey, how willing they are to provide you with information, how much information you ask for, and many other variables. So how long will it take? In this case, you have a choice. You could establish a quality goal—how much information, how many users, what level of depth—and the time to ac- complish it may vary. On the other hand, you could establish a time constraint, say, two weeks, and do as much as you can within that two-week period. That way you can guarantee you’ll make the deadline, but there’s a potential impact on quality. You might use the hierarchy of constraints to help you choose the best (or least worst) option, but the uncertainty remains. It’s simply shifted position. What are some elements of projects in your organization that have uncertain durations and costs? To what extent can you predict or control that uncertainty? Think About It . . . Uncertainties on Your Project 66 SUCCESSFUL PROJECT MANAGEMENT © American Management Association. All rights reserved. http://www.amanet.org/ Copyright2015.AMASelf-Study. Allrightsreserved.Maynotbereproducedinanyformwithoutpermissionfromthepublisher,exceptfairusespermittedunderU.S.orapplicablecopyrightlaw. EBSCO Publishing : eBook Collection (EBSCOhost) - printed on 10/19/2019 3:57 PM via UNIVERSIDAD NACIONAL ABIERTA Y A DISTANCIA - UNAD AN: 1520886 ; Dobson, Michael Singer.; Successful Project Management : How to Complete Projects on Time, on Budget, and on Target Account: ns145102.main.eds
  • 16. ESTIMATING METHODOLOGIES The basic estimating methodology is known as a WAG, or Wildly Aimed Guess. (It’s also defined in a less family-friendly way.) That’s distinct from a SWAG, or Scientific Wildly Aimed Guess, which is delivered with a calm and confident air, as if you know what you’re talking about. Sometimes, guesses are the best we can do, and as long as we label them for what they are, they can have some value in the planning process. Estimates, unlike guesses, have history: they are based on some real data and use some real methodology. That doesn’t always make them superior to guesses; some people’s WAGs are better than other people’s detailed and documented estimates. Different estimates are used for different purposes, and are based on dif- ferent levels of understanding about a project. A rough order of magnitude (ROM) estimate is used by decision-makers to decide if a project will be undertaken at all. The estimator starts with very little knowledge about the project. “How much would a new office building cost?” Obviously, that will vary by how large the building is, whether it has any special characteristics, where it will be built, and many other factors. But if none of that has been decided yet, you can only come up with a very general number. ROM estimates are considered accurate if the project comes in within -25% to +100% of the number provided. A preliminary estimate is based on a written statement of work (SOW), so you have more information to work with, but a detailed plan has not yet been created. Preliminary estimates are often used as the basis of a budget request or a proposal bid, and are considered accurate within a range of -10% to +25%. A definitive estimate requires a complete plan, so it’s used as the project baseline. Because reality never quite lines up with the plan, a definitive estimate still has some variance. It’s considered accurate in the range of -5% to +10%. If you’re asked to provide an estimate, you should always specify the type of estimate you’re providing, and offer the estimate as a range, rather than as a single number. STANDARD ESTIMATING TECHNIQUES Depending on the detail available and the accuracy required, several common estimating techniques are widely used: analogous estimating, expert judgment or Delphi estimating, parametric estimating, and bottom-up estimating. Analogous Estimating An analogous estimate uses the real numbers from another similar project, and adjusts them based on any known difference. How much does a new office building cost? Well, that new five-story building over on Main Street was built two years ago and cost $15 million. It holds 200 people. If you know you’re going to need space for 500 people, you could multiply $15 million by 150%, and offer an analogous estimate of $22.5 million. Notice that this type of es- timate is a ROM, which suggests a range between $16.875 million (25% less) and $45 million (100% more). ESTIMATING THE ACTIVITIES 67 © American Management Association. All rights reserved. http://www.amanet.org/ Copyright2015.AMASelf-Study. Allrightsreserved.Maynotbereproducedinanyformwithoutpermissionfromthepublisher,exceptfairusespermittedunderU.S.orapplicablecopyrightlaw. EBSCO Publishing : eBook Collection (EBSCOhost) - printed on 10/19/2019 3:57 PM via UNIVERSIDAD NACIONAL ABIERTA Y A DISTANCIA - UNAD AN: 1520886 ; Dobson, Michael Singer.; Successful Project Management : How to Complete Projects on Time, on Budget, and on Target Account: ns145102.main.eds
  • 17. Expert Judgment and Delphi Estimating If you want a good estimate, you could ask an expert. Experts bring extensive experience and deep understanding to the table, and their numbers are often quite accurate. There are several potential concerns, however. First, is the expert actually an expert in the particular type of project or activity? Some experts hate to disappoint the questioner, and will offer an “ex- pert” opinion for which they are no more qualified than the average person. Second, does the expert have a bias? If the expert has an economic inter- est in the project, the estimate may be less reliable, regardless of the actual knowledge of the expert. This isn’t always lying on the expert’s part: some- times people tend to be optimistic when they are part of the project. Third, is there a potential for “groupthink”? If you gather together a group of experts and ask each in turn for an estimate, people who are asked later tend to avoid violating the group consensus, and skew their answer to- ward the others given. The solution for groupthink is known as the Delphi method. In Delphi, you give each expert an estimating worksheet with information and questions, and have each complete it simultaneously. This keeps one person’s opinion from being influenced by another. The average of the expert judgments is often far more accurate than any individual’s estimate. Depending on the questions asked and the information provided, expert judgment estimates can fall into ROM, preliminary, or even definitive levels of accuracy. Parametric Estimating A parametric estimate is one that uses a statistical model. If you ask a commercial real estate person how much office space in your area costs, you’ll normally get a cost-per-square-foot number. If office space goes for $35 a square foot, and you need 1,200 square feet, the estimated annual rent is $42,000, or about $3,500/month. Of course, the price of office space varies, but if a particular landlord quotes a figure much higher or much lower than $3,500/month, it should raise questions. Perhaps the difference is completely appropriate, but you want to understand why. That’s a simple parametric. A more complex parametric is one you’ve encountered if you’ve purchased life insurance. An agent interviews you: your age, your health history, whether you smoke, and many other factors. The model queries a large statistical database and calculates what your premium should be. Depending on the sophistication of the model and the data available, parametric estimates can be produced in all three categories of accuracy. Bottom-Up Estimating To prepare a bottom-up estimate, you need a comprehensive and complete proj- ect plan, along with all the necessary supporting data. In a bottom-up estimate, you begin by estimating each activity separately, rolling them up into WBS work packages, then to control accounts, until you get to the final figure. Be- 68 SUCCESSFUL PROJECT MANAGEMENT © American Management Association. All rights reserved. http://www.amanet.org/ Copyright2015.AMASelf-Study. Allrightsreserved.Maynotbereproducedinanyformwithoutpermissionfromthepublisher,exceptfairusespermittedunderU.S.orapplicablecopyrightlaw. EBSCO Publishing : eBook Collection (EBSCOhost) - printed on 10/19/2019 3:57 PM via UNIVERSIDAD NACIONAL ABIERTA Y A DISTANCIA - UNAD AN: 1520886 ; Dobson, Michael Singer.; Successful Project Management : How to Complete Projects on Time, on Budget, and on Target Account: ns145102.main.eds
  • 18. cause a bottom-up estimate is based on the most detailed planning informa- tion available, it constitutes a definitive estimate, which usually becomes the baseline used to monitor project progress. The potential danger with a bottom-up estimate is the tendency to pad the numbers for safety. There’s nothing wrong with adjusting estimates based on risk—we’ll learn how to do that in the next chapter—but padding is usually just adding a WAG to the base number. Sometimes, the higher levels of the WBS will add their own padding, and pretty soon your bottom-up estimate is of no value. Although it’s not uncommon for project managers to pad esti- mates, we strongly discourage the practice. Adjusting for risk is based on analysis, not WAGs, and accomplishes the legitimate goal of ensuring you have a reasonably good estimate without making up numbers. Instructions: For the following estimates, list the estimating methodology (WAG, analogous, expert, Delphi, parametric, bottom-up) used and classify the expected accuracy (ROM, preliminary, budg- etary, variable) of the number. Estimate Basis Type Accuracy 1. The president says we’ll go to the moon in 10 years. ____________ ____________ 2. We surveyed ten people and used the average. ____________ ____________ 3. Joe has done this kind of thing a lot. ____________ ____________ 4. We did something like this a few years back. ____________ ____________ 5. When we added it all together, it came to $1 million. ____________ ____________ 6. We ran the specs through our job cost program. ____________ ____________ 7. Six weeks sounds reasonable. ____________ ____________ 8. Research says 10–15K lines of code per year is average. ____________ ____________ 9. Six months sounds about right. ____________ ____________ THREE-POINT ESTIMATING In addition to these common estimating techniques, project management has two unique estimating methodologies: PERT and Monte Carlo simulation. Both are built on what are known as three-point estimates. This estimating tech- nique is useful on projects that have a high degree of inherent uncertainty and a need for accurate predictions. Because it’s a fair amount of work, you should evaluate whether these techniques are appropriate for your project. Even if you don’t need the infor- mation right now, you may in the future. And if you plan to take the PMP® ex- amination, you’ll need to have a grasp of the basic concepts of these methods. Exercise 4–1 Types of Estimates ESTIMATING THE ACTIVITIES 69 © American Management Association. All rights reserved. http://www.amanet.org/ Copyright2015.AMASelf-Study. Allrightsreserved.Maynotbereproducedinanyformwithoutpermissionfromthepublisher,exceptfairusespermittedunderU.S.orapplicablecopyrightlaw. EBSCO Publishing : eBook Collection (EBSCOhost) - printed on 10/19/2019 3:57 PM via UNIVERSIDAD NACIONAL ABIERTA Y A DISTANCIA - UNAD AN: 1520886 ; Dobson, Michael Singer.; Successful Project Management : How to Complete Projects on Time, on Budget, and on Target Account: ns145102.main.eds
  • 19. Program Evaluation and Review Technique (PERT) In our brief discussion of the history and evolution of project management in Chapter 1, we mentioned the Program Evaluation and Review Technique (PERT), which grew out of the Polaris submarine project in the 1950s. Polaris was at the time the most complex engineering project ever undertaken, and much of what the engineers and designers had to do had never been done be- fore. This, of course, makes meaningful estimating problematic, and the proj- ect planners had to invent a new approach to keep the project on track in spite of the inherent uncertainty in the work. The PERT method was based on the concept of three-point estimating. If someone asks you for an estimate of how long something will take or how much it will cost, and there’s a range, most people will provide their most likely estimate. That seems reasonable enough, but in practice when you use most likely estimates for individual activities, you’ll almost always end up late and over budget. To understand why this is, let’s look at two other potential estimates. The optimistic estimate is the best-case scenario. It assumes that everything goes per- fectly. The pessimistic estimate assumes the opposite: bad things will happen. (Both of these estimates cover possibilities with a minimum of a 1% proba- bility.) Notice that the difference between most likely and optimistic is usually less than the difference between most likely and pessimistic. There’s only so good it can get, but bad covers a much wider range. That makes a “most likely” schedule extremely unlikely to meet its goals. Because computing power in the 1950s was extremely limited, the PERT planners were forced to come up with “quick and dirty” techniques to inte- grate the three estimates into something that could be used in practice. Exhibit 4–1 shows the basic PERT formulas. The PERT estimate, as you can see, is a weighted average of all three es- timates, with “most likely” counting for more than either extreme. The Greek letter 𝞼 (sigma) represents the standard deviation. 70 SUCCESSFUL PROJECT MANAGEMENT © American Management Association. All rights reserved. http://www.amanet.org/ 𝐸 = 𝑂 + (4∗𝑀) + 𝑃6 𝞼 = 𝑃 − 𝑂/6 Where: E = PERT Estimate O = Optimistic Estimate M = Most Likely Estimate P = Pessimistic Estimate 𝞼 = Standard Deviation xhibit 4–1 PERT Formulas Copyright2015.AMASelf-Study. Allrightsreserved.Maynotbereproducedinanyformwithoutpermissionfromthepublisher,exceptfairusespermittedunderU.S.orapplicablecopyrightlaw. EBSCO Publishing : eBook Collection (EBSCOhost) - printed on 10/19/2019 3:57 PM via UNIVERSIDAD NACIONAL ABIERTA Y A DISTANCIA - UNAD AN: 1520886 ; Dobson, Michael Singer.; Successful Project Management : How to Complete Projects on Time, on Budget, and on Target Account: ns145102.main.eds
  • 20. The standard deviation helps you determine the probability of your actual result meeting a given target. Exhibit 4–2 shows how the standard deviation relates to the PERT estimate. Exhibit 4–3 provides a helpful “Z table” showing your probability of meeting a given deadline or budget when expressed in stan- dard deviations from the PERT estimate. PERT calculations can be made for both time and cost. If the optimistic estimate for an activity is $500, the most likely $750, and the pessimistic $1,500, the PERT estimate will be ($500 + (4 * $750) + $1,500)/6, or $833.33, and the standard deviation will be ($1,500 – $500)/6, or $166.67. With time, there’s one additional fact you should know. If you want to know the standard deviation for a series of activities, you have to square each of the standard deviations, add them together, and take the square root of the sum. Example: Take the path sequence A→B→C. A has a standard deviation of 2 days, B has a standard deviation of 3 days, and C has a standard deviation of 1 day. 22 + 32 + 12 = 4 + 9 + 1 = 14. The standard deviation of A→B→C is the square root of 14, or about 3.74, which we’ll round to 4. Instructions: Use the PERT formulas and Z table to answer the following questions. Round all num- bers to the nearest integer. 1. For Activity A, the optimistic estimate is 10 days, the most likely estimate is 12 days, and the pessimistic estimate is 25 days. What is the PERT estimate and standard deviation? 2. For Activity A, the optimistic cost estimate is $5,000, the most likely estimate is $15,000, and the pessimistic estimate is $21,000. What is the PERT estimate and standard deviation? 3. You are given a deadline of 15 days and a budget of $13,000 for Activity A. What is the proba- bility that you will achieve the time and cost objectives? 4. For the path A→B→C, if the standard deviations are A = 4, B = 5, and C = 7, what is the stan- dard deviation of the path? Exercise 4–2 Calculating PERT Estimates ESTIMATING THE ACTIVITIES 71 © American Management Association. All rights reserved. http://www.amanet.org/ Credit: Standard deviation diagram, based on an original graph by Jeremy Kemp, 2005. Licensed under the Creative Commons Attribution 2.5 Generic license; downloaded from Wikimedia Commons on 1 August 2013. xhibit 4–2 Standard Deviation Diagram Copyright2015.AMASelf-Study. Allrightsreserved.Maynotbereproducedinanyformwithoutpermissionfromthepublisher,exceptfairusespermittedunderU.S.orapplicablecopyrightlaw. EBSCO Publishing : eBook Collection (EBSCOhost) - printed on 10/19/2019 3:57 PM via UNIVERSIDAD NACIONAL ABIERTA Y A DISTANCIA - UNAD AN: 1520886 ; Dobson, Michael Singer.; Successful Project Management : How to Complete Projects on Time, on Budget, and on Target Account: ns145102.main.eds
  • 21. 72 SUCCESSFUL PROJECT MANAGEMENT © American Management Association. All rights reserved. http://www.amanet.org/ This table, called a “Z table” in statistics, gives you the statistical probability of achieving a given cost or time goal expressed in terms of the PERT estimate and the standard deviation. Example 1: Your PERT estimate for a given activity is 10 days, and the standard deviation is 3 days.Your probability of meeting the goal in 10 days (E + 0𝞼) is 50%. Meeting the goal in 13 days (E + 1𝞼) is 84.13%.Your probability of meeting the goal in 7 days (E – 1𝞼), however, is only 15.87%. Example 2:Your PERT estimate for the activity is $15,000, and the standard deviation is $3,000. If you are given a $16,000 budget, that’s $1,000 more than E, which is a third (0.3) of the standard deviation. E + 0.3𝞼 is 61.79%. If you are given $14,000, the chance is now E – 0.3𝞼, or 38.21%. xhibit 4–3 Z Table 𝞼 Probability 𝞼 Probability -3 0.13% 0 50.00% -2.9 0.19% 0.1 53.98% -2.8 0.26% 0.2 57.93% -2.7 0.35% 0.3 61.79% -2.6 0.47% 0.4 65.54% -2.5 0.62% 0.5 69.15% -2.4 0.82% 0.6 72.57% -2.3 1.07% 0.7 75.80% -2.2 1.39% 0.8 78.81% -2.1 1.79% 0.9 81.59% -2 2.28% 1 84.13% -1.9 2.87% 1.1 86.43% -1.8 3.59% 1.2 88.49% -1.7 4.46% 1.3 90.32% -1.6 5.48% 1.4 91.92% -1.5 6.68% 1.5 93.32% -1.4 8.08% 1.6 94.52% -1.3 9.68% 1.7 95.54% -1.2 11.51% 1.8 96.41% -1.1 13.57% 1.9 97.13% -1 15.87% 2 97.72% -0.9 18.41% 2.1 98.21% -0.8 21.19% 2.2 98.61% -0.7 24.20% 2.3 98.93% -0.6 27.43% 2.4 99.18% -0.5 30.85% 2.5 99.38% -0.4 34.46% 2.6 99.53% -0.3 38.21% 2.7 99.65% -0.2 42.07% 2.8 99.74% -0.1 46.02% 2.9 99.81% 0 50.00% 3 99.87% Copyright2015.AMASelf-Study. Allrightsreserved.Maynotbereproducedinanyformwithoutpermissionfromthepublisher,exceptfairusespermittedunderU.S.orapplicablecopyrightlaw. EBSCO Publishing : eBook Collection (EBSCOhost) - printed on 10/19/2019 3:57 PM via UNIVERSIDAD NACIONAL ABIERTA Y A DISTANCIA - UNAD AN: 1520886 ; Dobson, Michael Singer.; Successful Project Management : How to Complete Projects on Time, on Budget, and on Target Account: ns145102.main.eds
  • 22. Monte Carlo Simulation If you’ve studied statistics, you will have noticed that our formulas for the standard deviation are not what you learned. The reason is the limits to computers at the time PERT was invented. PERT works well enough, but today’s project managers have access to far more computing resources than the Polaris planners. The Monte Carlo simulation technique uses the same three-point esti- mates as PERT, but instead of applying the PERT formula, those numbers get entered into a Monte Carlo program. There are many different Monte Carlo simulators for project management on the market, and they usually come in the form of a plug-in to various commercial software packages. There are several Monte Carlo simulators for Microsoft Project®, and versions for all the popular software packages. When you install your Monte Carlo simulator and open your project man- agement software, you’ll have the opportunity to enter the three-point estimates for each activity. Some versions allow you to adjust the numbers and distribution patterns. Once you’ve entered the data, simply run the program. Go get a cup of coffee; this might take a while depending on the size of the project. Starting with the first activity, the Monte Carlo simulator generates a random number based on the three estimates and their weighting, and uses that as the duration of the activity. If it’s earlier or later than scheduled, other activities are moved forward or backward in the schedule based on their de- pendencies. The program now goes to the next activity, repeats the process, and so on until it reaches the end of the project. It stores how long it took to complete the project (and how much was spent, if you’ve set it up that way), then goes back to the first activity and does it again. And again, and again, until it’s simulated the project several thousand times and generated a range of finish dates and final costs. You can read the output to figure out the prob- ability of meeting any particular deadline or budget. The Monte Carlo method is both easier and more accurate than PERT, but requires you to use a project management software program and a com- patible Monte Carlo program. More and more, project managers are aban- doning the traditional PERT method for the new technology. Not every project or every organization will receive enough benefit from PERT or Monte Carlo to justify the time and effort involved, but in some cases it’s extremely valuable. Do these techniques have a place in your organization’s projects? Under what circumstances would you want to use these tools? Think About It . . . Managing Uncertainty ESTIMATING THE ACTIVITIES 73 © American Management Association. All rights reserved. http://www.amanet.org/ Copyright2015.AMASelf-Study. Allrightsreserved.Maynotbereproducedinanyformwithoutpermissionfromthepublisher,exceptfairusespermittedunderU.S.orapplicablecopyrightlaw. EBSCO Publishing : eBook Collection (EBSCOhost) - printed on 10/19/2019 3:57 PM via UNIVERSIDAD NACIONAL ABIERTA Y A DISTANCIA - UNAD AN: 1520886 ; Dobson, Michael Singer.; Successful Project Management : How to Complete Projects on Time, on Budget, and on Target Account: ns145102.main.eds
  • 23. ISSUES IN ESTIMATING Pretty much by definition, estimates aren’t the same thing as reality: your mileage may vary. A healthy dose of skepticism about estimates is recom- mended. Overoptimism Although some projects do come in ahead of their estimates, by far the more common outcome is that projects tend to be late and over budget. There’s a general bias toward optimism in the estimating process. People tend to over- estimate how productive they are likely to be, underestimate the number of interruptions and distractions, and fail to account for emergencies. According to the annual Standish Group CHAOS Report on large corporate IT projects, only 32% of projects actually meet their goals of time, cost, and performance (Gruebl and Welch, 13). Parkinson’s Law Some project management authorities recommend adding a contingency al- lowance to the time and cost estimates to account for poor estimating. Though this has some virtues, it runs afoul of a well-known management principle called Parkinson’s Law: work expands so as to fill the time available for its completion (Parkinson, 1958). If you have a comfortable amount of time in which to accomplish an ac- tivity, there’s not a lot of urgency to get started, and there are almost always various other issues that are calling for your attention. Adding contingency to activities may in fact make them take longer, and the project will still be late and over budget. A project management technique known as critical chain project management (CCPM) suggests that you should take the contingency allowance away from individual activities and add them to the network diagram in the form of buffers (Goldratt, 1997). This reduces the incentive for procrastination. Rolling Wave Estimating Another problem related to estimating is the extent to which knowledge and understanding evolves in the course of a long project. If you’re looking at a four or five year time horizon, your estimates of activity duration toward the end of the project are highly speculative—little better than WAGs. As the project moves forward, the experience and information you get will allow you to improve and tighten estimates. Your initial plan might only be able to pro- vide ROM-level estimates, but as time goes forward they can become prelim- inary and eventually definitive. This process is known as rolling wave estimating, an estimate iterated during the project life cycle as more information becomes available. 74 SUCCESSFUL PROJECT MANAGEMENT © American Management Association. All rights reserved. http://www.amanet.org/ Copyright2015.AMASelf-Study. Allrightsreserved.Maynotbereproducedinanyformwithoutpermissionfromthepublisher,exceptfairusespermittedunderU.S.orapplicablecopyrightlaw. EBSCO Publishing : eBook Collection (EBSCOhost) - printed on 10/19/2019 3:57 PM via UNIVERSIDAD NACIONAL ABIERTA Y A DISTANCIA - UNAD AN: 1520886 ; Dobson, Michael Singer.; Successful Project Management : How to Complete Projects on Time, on Budget, and on Target Account: ns145102.main.eds
  • 24. Instructions: For your PMO project, you will need to make some estimates. For each estimate re- quired, explain what technique or methodology you would use from the ones described in this chapter, and where you might get any information necessary to develop those estimates. These questions assume you’re using the network diagram from the Answer Key for Exercise 3–5. 1. How would you estimate the time required for Activity 1 (“Research”)? 2. How would you estimate the time required for Activity 3 (“Obtain Feedback”)? 3. How would you estimate the likely price of Activity 8 (“Obtain Outside Trainer”)? 4. How would you estimate the time required for Activity 6 (“Recruit PMO Head”)? 5. How would you estimate how much it will cost for Activity 11 (“Prepare Stockholder Presentation”)? Exercise 4–3 Estimating Review ESTIMATING THE ACTIVITIES 75 © American Management Association. All rights reserved. http://www.amanet.org/ Copyright2015.AMASelf-Study. Allrightsreserved.Maynotbereproducedinanyformwithoutpermissionfromthepublisher,exceptfairusespermittedunderU.S.orapplicablecopyrightlaw. EBSCO Publishing : eBook Collection (EBSCOhost) - printed on 10/19/2019 3:57 PM via UNIVERSIDAD NACIONAL ABIERTA Y A DISTANCIA - UNAD AN: 1520886 ; Dobson, Michael Singer.; Successful Project Management : How to Complete Projects on Time, on Budget, and on Target Account: ns145102.main.eds
  • 25. The first iteration of a project plan is an important milestone, but not the end of the process. Normally, you should expect to develop a lot of additional information and detail to flesh out the plan and address issues. Because there is often a great deal of uncertainty in a project, we must normally develop estimates of time, cost, and resources. Estimates come in varying degrees of accuracy, ranging from rough order of magnitude (ROM) to progres- sively more accurate preliminary and definitive estimates. Be- sides the traditional Wildly Aimed Guess (WAG) method, other estimating methodologies include analogous estimating, expert judgment and Delphi es- timating, parametric estimating, and bottom-up estimating. In project management, three-point estimates (optimistic, most likely, and pessimistic estimates) are the basis of the Program Evaluation and Review Technique (PERT) and the Monte Carlo simulation. The PERT method uses statistical calculations to establish estimates and the range of likely outcomes. Although it’s important for project managers to understand the PERT ap- proach, the Monte Carlo method, which uses a software package to simulate the project repeatedly, is more accurate and easier. It’s much more common for projects to exceed their estimates rather than meet them. Overoptimism and the failure to account for interruptions and emergencies are common reasons. Some project management authorities rec- ommend adding a contingency allowance, but that may trigger Parkinson’s Law: the tendency of work to expand to fill the time available. The discipline of critical chain project management suggests using buffers to hold contin- gency rather than allocate it to individual activities or work packages. In long projects, the availability of information increases over time, so initial estimates are generally less meaningful than estimates prepared closer to the start of the activity. Rolling wave estimating evolves the quality of the estimate over the life cycle of the project as new and better information be- comes available. 76 SUCCESSFUL PROJECT MANAGEMENT © American Management Association. All rights reserved. http://www.amanet.org/ Copyright2015.AMASelf-Study. Allrightsreserved.Maynotbereproducedinanyformwithoutpermissionfromthepublisher,exceptfairusespermittedunderU.S.orapplicablecopyrightlaw. EBSCO Publishing : eBook Collection (EBSCOhost) - printed on 10/19/2019 3:57 PM via UNIVERSIDAD NACIONAL ABIERTA Y A DISTANCIA - UNAD AN: 1520886 ; Dobson, Michael Singer.; Successful Project Management : How to Complete Projects on Time, on Budget, and on Target Account: ns145102.main.eds
  • 26. A preliminary estimate has an expected accuracy of: 1. (d)1. -25%, +100%.(a) -25%, +75%.(b) -5%, +10%.(c) -10%, +25%.(d) One reason why projects are more frequently late and over budget 2. (a)2. than early and under budget is: overoptimism in the estimating process.(a) changes in scope requested by customers.(b) using rough order of magnitude rather than preliminary estimates.(c) incorrect calculations of the critical path.(d) Which of these is a potential danger in developing a bottom-up estimate? 3. (d)3. Flaws in the parametric model that is used(a) Failure to use the Delphi method(b) Relationship of the analogous project to the one being estimated(c) Some team members may pad their estimates(d) If you decide the quickest an activity can be completed is six weeks, 4. (c)4. the worst case is 24 weeks, and the most likely time is 12 weeks, what is the PERT estimate and the standard deviation? E = 7, 𝞼 = 3(a) E = 13, 𝞼 = 18(b) E = 13, 𝞼 = 3(c) E = 12, 𝞼 = 2(d) CALCULATION: The formula for the PERT estimate is (O + 4M + P)/6, or (6 + (4 * 12) + 24)/6 = 13. The formula for the standard deviation (𝞼) is (P – O)/6, or (24 – 6)/6 = 3. In a PERT analysis, what is the probability that an activity will be 5. (c)5. completed no later than one standard deviation from the estimate? 68.2%(a) 50.00%(b) 84.13%(c) 15.87%(d) Review Questions ESTIMATING THE ACTIVITIES 77 © American Management Association. All rights reserved. http://www.amanet.org/ Copyright2015.AMASelf-Study. Allrightsreserved.Maynotbereproducedinanyformwithoutpermissionfromthepublisher,exceptfairusespermittedunderU.S.orapplicablecopyrightlaw. EBSCO Publishing : eBook Collection (EBSCOhost) - printed on 10/19/2019 3:57 PM via UNIVERSIDAD NACIONAL ABIERTA Y A DISTANCIA - UNAD AN: 1520886 ; Dobson, Michael Singer.; Successful Project Management : How to Complete Projects on Time, on Budget, and on Target Account: ns145102.main.eds
  • 27. This page intentionally left blank Copyright2015.AMASelf-Study. Allrightsreserved.Maynotbereproducedinanyformwithoutpermissionfromthepublisher,exceptfairusespermittedunderU.S.orapplicablecopyrightlaw. EBSCO Publishing : eBook Collection (EBSCOhost) - printed on 10/19/2019 3:57 PM via UNIVERSIDAD NACIONAL ABIERTA Y A DISTANCIA - UNAD AN: 1520886 ; Dobson, Michael Singer.; Successful Project Management : How to Complete Projects on Time, on Budget, and on Target Account: ns145102.main.eds
  • 28. 5PreparingaProjectPlan Learning Objectives By the end of this chapter, you should be able to: • Describe the process of progressively elabo- rating the initial project plan. • Identify staffing and resource requirements for a project. • Describe how to build the project team and prepare a responsibility assignment matrix (RAM). • Explain the concepts of loading and leveling a project schedule. • Describe the roles of outsourcing and pro- curement planning. • Perform critical path method (CPM) calcu- lations and explain the circumstances in which they are appropriate. • Develop a communications and stakeholder management plan. Estimated timing for this chapter: Reading 55 minutes Exercises 2 hours Review Questions 10 minutes Total Time 3 hours 5 minutes © American Management Association. All rights reserved. http://www.amanet.org/ 79 Copyright2015.AMASelf-Study. Allrightsreserved.Maynotbereproducedinanyformwithoutpermissionfromthepublisher,exceptfairusespermittedunderU.S.orapplicablecopyrightlaw. EBSCO Publishing : eBook Collection (EBSCOhost) - printed on 10/19/2019 3:57 PM via UNIVERSIDAD NACIONAL ABIERTA Y A DISTANCIA - UNAD AN: 1520886 ; Dobson, Michael Singer.; Successful Project Management : How to Complete Projects on Time, on Budget, and on Target Account: ns145102.main.eds
  • 29. PROGRESSIVE ELABORATION AND THE PROJECT PLAN A project plan consists of far more than simply a schedule. You need a budget, a staffing plan, a procurement plan for any outsourcing or purchasing, a com- munications plan to manage stakeholders, and plans for ensuring quality and managing risk. In our planning process so far, we began with a statement of work (SOW), which we developed into a work breakdown structure (WBS). From the WBS, we developed an activity list and prepared a network diagram and Gantt chart. That constitutes a preliminary project plan. In Chapter 4, we developed the plan by creating estimates for activities and using those estimates, developed confidence measures using PERTand Monte Carlo to see whether we would be able to meet the time and cost constraints. In this chapter, we’ll continue to flesh out the components of the project plan, including human resources, procurement, and communications plan- ning. On the way, we’ll look at using the critical path method (CPM) as a tool to balance scope and schedule. In the next chapter, we’ll address managing quality and risk. It’s important to note here that as you move forward in the planning process, you normally learn information that will change some of your earlier ideas. The SOW, WBS, network diagram, and estimates can and should evolve—it’s the iterative nature of project planning in action. If you find that your real-world planning process sometimes feels like “two steps forward, one step back,” that’s probably a sign that you’re doing it right. STAFFING AND RESOURCE REQUIREMENTS In estimating, we figure out how long a project will take and how much it will cost, but these are not the only considerations. How about people? How many do we need, when do we need them, and what skills do they need to have? Will our project require access to specialized tools and equipment? In the real world, we’re often told how many people we get, and frequently told who they are, even before we begin the planning process. Even so, we still need to allocate people to different activities and make sure all the work is cov- ered. If we have missing skills or too few (or too many) people, we may need to go back to our project sponsor and see if we can modify the situation. BUILDING THE PROJECT TEAM In planning, the first step is to compare the team you have with the team you need. There are three characteristics about your team you need to assess: the number, the work maturity, and the skill set. Number. Consider both the raw number of people available to your proj- ect and the percentage time commitment of each. Two people available only half the time counts the same as one full-time person. Some people will be committed to your project from beginning to end, and others may 80 SUCCESSFUL PROJECT MANAGEMENT © American Management Association. All rights reserved. http://www.amanet.org/ Copyright2015.AMASelf-Study. Allrightsreserved.Maynotbereproducedinanyformwithoutpermissionfromthepublisher,exceptfairusespermittedunderU.S.orapplicablecopyrightlaw. EBSCO Publishing : eBook Collection (EBSCOhost) - printed on 10/19/2019 3:57 PM via UNIVERSIDAD NACIONAL ABIERTA Y A DISTANCIA - UNAD AN: 1520886 ; Dobson, Michael Singer.; Successful Project Management : How to Complete Projects on Time, on Budget, and on Target Account: ns145102.main.eds
  • 30. be available only for particular phases. That may be completely sensible, as projects often have different work requirements at different times. Workmaturity.Work maturity encompasses level of experience, attitude toward the organization and the project, ability to work independently or with little direction, and other considerations. A person of low work maturity isn’t necessarily a bad performer, but may simply be a relatively fresh hire. Some people with lots of experience but bad attitudes might be considered as having even lower work maturity. Skillset. With some activities, it doesn’t matter which team member you assign because they all possess the necessary skills. In other cases, you may be very limited in who you can assign to a particular activity. To find out whether your team is sufficient for your project, you must assign team members to work packages or activities to see if there are any problems. In addition to making sure that each activity is covered, you also need to check that you haven’t inadvertently double-booked people on par- allel activities. For the first, you’ll begin with a responsibility assignment ma- trix (RAM), and for the second, we’ll look at resource loading and leveling. Responsibility Assignment Matrix (RAM) A responsibility assignment matrix, or RAM, is a tool that links resources to activities. (You may also see this referred to as a RACI matrix.) To build a RAM, you must first look at your project to see what skills are required to ac- complish the work. Exhibit 5–1 takes the network diagram from the pharma- ceutical project we developed in Exhibit 3–6 and lists the skills we need to perform this project. Exercise 5–1 allows you to apply this tool to the PMO case study project. Instructions: For the PMO case study project, analyze the network diagram you developed in Ex- ercise 3–5 and list the skills your team needs to accomplish the work. Exhibit 5–1 shows that we need one or more writers, at least one editor, and one or more people in data management. Although project management is involved throughout the project, the project manager has primary respon- sibilities in such activities as assigning the team and in overseeing the review process and completion of the final package. Notice that we’ve listed “technical and management reviewing” as a skill required to accomplish this project, but it’s pretty clear that those technical and management reviewers aren’t part of our project team in any normal sense. But they are part of the team in the sense that we can’t get the project done without their input. The project manager doesn’t only have to manage Exercise 5–1 Skill Requirements PREPARING A PROJECT PLAN 81 © American Management Association. All rights reserved. http://www.amanet.org/ Copyright2015.AMASelf-Study. Allrightsreserved.Maynotbereproducedinanyformwithoutpermissionfromthepublisher,exceptfairusespermittedunderU.S.orapplicablecopyrightlaw. EBSCO Publishing : eBook Collection (EBSCOhost) - printed on 10/19/2019 3:57 PM via UNIVERSIDAD NACIONAL ABIERTA Y A DISTANCIA - UNAD AN: 1520886 ; Dobson, Michael Singer.; Successful Project Management : How to Complete Projects on Time, on Budget, and on Target Account: ns145102.main.eds
  • 31. the official team, but also has to “manage up” (Dobson and Dobson, 2000). In this case, the project manager needs to identify the reviewers, make sure they schedule the necessary time, make sure they get the information they need, and follow up to make sure it all gets done. The next step is to link those required skills to the skills possessed by your team, which we’ve done in Exhibit 5–2. (We don’t need to assess the re- viewers, so they don’t go on this list.) In Exercise 5–2, you will prepare your own team skill assessment. Instructions: As project manager, we assume that you have project management skills. You may choose three of the following five candidates to complete your team. Nguyen: Five years’ experience with the company in staff-level roles, BS degree in Information Management. Skilled with PowerPoint. Susan: Human resources generalist with four years’ experience. Gemma: Three years with the company in management, MBA. Exercise 5–2 Skill List 82 SUCCESSFUL PROJECT MANAGEMENT © American Management Association. All rights reserved. http://www.amanet.org/ Skills required: Writing (Activities 5, 7, 9, 11) Editing (Activities 5, 7, 9, 11) Data Management (Activities 2, 3, 4, 13) Project Management (Activities 1, 6, 8, 10, 12, 13) Technical and Management Reviewing (Activities 6, 8, 10, 12) xhibit 5–1 Skill Requirements Start FInish 1. Assign Team 2. Obtain Raw Data 3. ezinagrO Data 4. Prepare Index 5. Write Summary Sections 6. Review Summary Sections 7. Draft Overall Summary 8. Review 1st Draft 9. Rewrite Summary 10. Review 2nd Draft 11. Write Final 12. Final Signoff 13. Print Data 14. Submit 0 weeks 0 weeks 1 weeks 4 weeks 12 weeks 4 weeks 8 weeks 3 weeks 2 weeks 6 weeks 2 weeks 6 weeks 2 weeks 3 weeks 6 weeks 1 weeks Total Time = 60 weeks Critical Path = 44 weeks Slack/Float = 6 weeks Slack/Float = 3 weeks Exercise 5–2 continues on next page. Copyright2015.AMASelf-Study. Allrightsreserved.Maynotbereproducedinanyformwithoutpermissionfromthepublisher,exceptfairusespermittedunderU.S.orapplicablecopyrightlaw. EBSCO Publishing : eBook Collection (EBSCOhost) - printed on 10/19/2019 3:57 PM via UNIVERSIDAD NACIONAL ABIERTA Y A DISTANCIA - UNAD AN: 1520886 ; Dobson, Michael Singer.; Successful Project Management : How to Complete Projects on Time, on Budget, and on Target Account: ns145102.main.eds
  • 32. Jurgen: Three years in shareholder relations and two years in corporate communications, MBA. Sean: Edits company newsletter while serving as human resources manager for one of the divisions, BA, four years’ experience. Now, we need to put this together into the final RAM table, shown in Exhibit 5–3. For simplicity, we’ll add two reviewers: Yuri, the project sponsor, and Maria, the technical reviewer. The project manager is Aliverdi. Exercise 5–3 gives you the opportunity to develop your own RAM. Team Member Research Policy Development Writing Project Management Procurement Org. Devel. HR Presentation Nguyen Susan Gemma Jurgen Sean PREPARING A PROJECT PLAN 83 © American Management Association. All rights reserved. http://www.amanet.org/ Work maturity/skill level codes: N (Novice), A (Average), E (Expert) xhibit 5–2 Team Skills Team Member Writing Editing Data Management Project Management Harry A N A N Sally E E A N François E A A A Mariko A N E A Aliverdi A A N E Exercise 5–2 continued from previous page. Copyright2015.AMASelf-Study. Allrightsreserved.Maynotbereproducedinanyformwithoutpermissionfromthepublisher,exceptfairusespermittedunderU.S.orapplicablecopyrightlaw. EBSCO Publishing : eBook Collection (EBSCOhost) - printed on 10/19/2019 3:57 PM via UNIVERSIDAD NACIONAL ABIERTA Y A DISTANCIA - UNAD AN: 1520886 ; Dobson, Michael Singer.; Successful Project Management : How to Complete Projects on Time, on Budget, and on Target Account: ns145102.main.eds
  • 33. Instructions: Prepare a RAM for the PMO case study project based on your network diagram and the information you developed in Exercises 5–1 and 5–2. Exercise 5–3 Responsibility Assignment Matrix Activity Responsible Consulted Informed Approval 84 SUCCESSFUL PROJECT MANAGEMENT © American Management Association. All rights reserved. http://www.amanet.org/ xhibit 5–3 Responsibility Assignment Matrix Activity Responsible Consulted Informed Approval Assign Team Aliverdi Team Yuri Obtain Raw Data Mariko Harry Organize Raw Data Mariko Harry Maria Prepare Index Sally Mariko Harry, François Aliverdi Write Summary Sections François Sally Sally Review Summary Sections Aliverdi Sally Yuri Maria Draft Overall Summary François Sally Review 1st Draft Maria Aliverdi Yuri Maria Rewrite Summary François Sally Review 2nd Draft Maria Aliverdi Yuri Maria Write Final François Sally Yuri, Maria Aliverdi Final Signoff Maria, Yuri Aliverdi Yuri Print Aliverdi Mariko, Sally Yuri Submittal Aliverdi Mariko, Sally Maria Yuri Exercise 5–3 continues on next page. Copyright2015.AMASelf-Study. Allrightsreserved.Maynotbereproducedinanyformwithoutpermissionfromthepublisher,exceptfairusespermittedunderU.S.orapplicablecopyrightlaw. EBSCO Publishing : eBook Collection (EBSCOhost) - printed on 10/19/2019 3:57 PM via UNIVERSIDAD NACIONAL ABIERTA Y A DISTANCIA - UNAD AN: 1520886 ; Dobson, Michael Singer.; Successful Project Management : How to Complete Projects on Time, on Budget, and on Target Account: ns145102.main.eds
  • 34. LOADING AND LEVELING THE SCHEDULE When we map our assignments to the network diagram (known as loading the schedule), we notice that Sally is responsible for preparing the index (4) and for overseeing/editing the writing of the summary sections (5). Because these tasks are on parallel paths, there’s a possibility that Sally may end up being booked for two jobs simultaneously. We need to look closely at the schedule to see if there’s a problem, and solve it if necessary. Because Organize Data (3) takes 12 weeks, it looks like François and Sally will be done long before the index must be prepared, so we don’t have a prob- lem. But what if we did? In that case, we would have to level the schedule, or bal- ance the workload and the resources available to do it. There are several ways. The first way is to delay one of the double-booked activities. If Sally has not finished editing François’s first draft when she’s supposed to start indexing, you could delay the start of the indexing task until she’s available. This may push out the schedule. Another way to solve the problem is to reassign one of Sally’s jobs, either by finding another editor for the writing job, or by finding another indexer for the indexing job. Both of these run the risk of simply transferring the over- load to another team member. Third, rather than reassigning one of Sally’s jobs to another team member, we could ask for another person to join our team. We could look for another skilled writer/editor, or for another indexer. Notice we might not require that new position for the life of the project. Activity Responsible Consulted Informed Approval PREPARING A PROJECT PLAN 85 © American Management Association. All rights reserved. http://www.amanet.org/ Exercise 5–3 continued from previous page. Copyright2015.AMASelf-Study. Allrightsreserved.Maynotbereproducedinanyformwithoutpermissionfromthepublisher,exceptfairusespermittedunderU.S.orapplicablecopyrightlaw. EBSCO Publishing : eBook Collection (EBSCOhost) - printed on 10/19/2019 3:57 PM via UNIVERSIDAD NACIONAL ABIERTA Y A DISTANCIA - UNAD AN: 1520886 ; Dobson, Michael Singer.; Successful Project Management : How to Complete Projects on Time, on Budget, and on Target Account: ns145102.main.eds
  • 35. Have you encountered situations in which a staff member was “double booked” for project activi- ties? At what point did you realize it? Could you have found the problem earlier, and if so, what might you have done differently? OUTSOURCING We also don’t necessarily have to confine ourselves to resources on hand. Maybe we don’t have people with all the necessary skills, or perhaps we have so much going on that everybody’s fully booked with other work. In that case, we could consider outsourcing. Almost any aspect of a project can, at least in theory, be handed off to some- one else. If you have to make widgets, you can hire a manufacturer to make them for you, or an engineering firm to design them. If you need writers, editors, or indexers, you can hire them as consultants. If you’ve got to organize 100,000 pages of raw data, there are consulting firms that specialize in just that service. Make or buy decisions are a powerful tool in the project manager’s arsenal. Depending on your organizational circumstances, sometimes doing it yourself is the best option, and sometimes it’s better to hire it out. Such factors as qual- ity, speed, relative experience or capabilities, and what else internal resources could do instead of that work can influence the decision. The best time for make or buy decisions is early in the planning process, because they will have a significant effect on the final project plan. Procurement Planning As you decide what you will be procuring as part of managing your project, you need to start a procurement process. You need to define what you want to buy, and identify one or more vendors who can supply your need. You will have to get bids or proposals, evaluate them, choose your supplier, and negotiate nec- essary contracts. Throughout the procurement process, you will need to make sure that the vendor is performing on schedule and meeting requirements. You will need to receive, inspect, and approve what you bought, and you will need to pay invoices. All of these are activities that belong in your project plan. The procurement process can turn into a major part of a project man- ager’s responsibilities. A comprehensive study of procurement is, however, a bit beyond the scope of this course. Many resources are available on this topic, both in print and online. Think About It . . . Loading and Leveling 86 SUCCESSFUL PROJECT MANAGEMENT © American Management Association. All rights reserved. http://www.amanet.org/ Copyright2015.AMASelf-Study. Allrightsreserved.Maynotbereproducedinanyformwithoutpermissionfromthepublisher,exceptfairusespermittedunderU.S.orapplicablecopyrightlaw. EBSCO Publishing : eBook Collection (EBSCOhost) - printed on 10/19/2019 3:57 PM via UNIVERSIDAD NACIONAL ABIERTA Y A DISTANCIA - UNAD AN: 1520886 ; Dobson, Michael Singer.; Successful Project Management : How to Complete Projects on Time, on Budget, and on Target Account: ns145102.main.eds
  • 36. How do you make “make or buy” decisions on your projects? CRITICAL PATH METHOD (CPM) ANALYSIS Resources and time are often linked. More people and equipment can, in many cases, accomplish activities in less time, but at the cost of more dollars. Critical path method (CPM) analysis provides a methodology for balancing time, cost, and resources for optimal project results. The Northridge Overpass Disaster In Los Angeles’s 1994 Northridge earthquake, an overpass collapse closed In- terstate 10, a critically important transportation link. This was hugely destruc- tive to the area, with a community impact estimated at about $1 million per day. The California Department of Transportation and the Federal Highway Management Administration expedited contracts and offered a $200,000 per day completion bonus for the reconstruction. It only took 74 days for the con- tractor to finish the job—winning a $14.8 million bonus in the process (USDOT, 1994). By the standards of large highway interchange construction, this is re- markably fast, but a $200,000/day bonus is quite an incentive. From the city of Los Angeles’s point of view, though, it wasn’t excessively generous. If the city is losing $1 million per day, every day the project finishes ahead of sched- ule is a net $800,000 benefit—$59.2 million in total. That puts the $14.8 mil- lion bonus in perspective. Implications for Project Planning The general project management lesson to take from the Northridge case is the observation that in many cases, there is a financial benefit to finishing early (and a corresponding cost of being late). At the very minimum, finishing early cuts the overhead cost of running the project. The second lesson is that there is often a tradeoff between what you spend to accomplish a work package and how long it takes. If you want to build a brick wall of a certain dimension, you can calculate how long it would take a single bricklayer. If you added a bricklayer, you’d cut the time in half, Think About It . . . Make or Buy PREPARING A PROJECT PLAN 87 © American Management Association. All rights reserved. http://www.amanet.org/ Copyright2015.AMASelf-Study. Allrightsreserved.Maynotbereproducedinanyformwithoutpermissionfromthepublisher,exceptfairusespermittedunderU.S.orapplicablecopyrightlaw. EBSCO Publishing : eBook Collection (EBSCOhost) - printed on 10/19/2019 3:57 PM via UNIVERSIDAD NACIONAL ABIERTA Y A DISTANCIA - UNAD AN: 1520886 ; Dobson, Michael Singer.; Successful Project Management : How to Complete Projects on Time, on Budget, and on Target Account: ns145102.main.eds
  • 37. but you’d be paying two people. Add more people, and you’ll continue to re- duce the total time, up until some point of diminishing returns, where another body doesn’t save you very much (or worse, the bricklayers start tripping over one another). It should be noted that extra resources don’t always produce a time ben- efit. The classic project management example is that it take one woman nine months to have a baby, but it doesn’t follow that nine women could get the job done in one. In addition, there are some tasks that are highly uncertain, and you cannot predict the value of adding people. If you want to develop a new concept design, two people might get the job done faster than one, but they could get mired in an argument and actually take longer. Critical Path Method Insights like these led to the development of the critical path method (CPM), a scheduling technique with a number of similarities to PERT. It was devel- oped by DuPont and Remington Rand in the 1950s. We take the idea of the critical path from CPM, as well as the term “slack.” (“Float” came from PERT, but the two words refer to the same basic concept.) Where the systems differ is the particular problem they address. PERT is a planning tool designed for projects with a high degree of uncertainty. CPM focuses on the kind of project where extra resources have a reliable, measurable effect on scheduling. Let’s go back to Interstate 10. In this project, we’ve been offered an in- centive of $200,000 a day. In order to speed up the project, we will have to add resources, so our costs will go up. If our target is, say, to keep $50,000 of that bonus as profit, that gives us $150,000 per day to spend on additional re- sources. But we can’t just throw that money around; we have to target it. CPM analysis shows us how to target the money. Crashing a Project Under normal conditions, we’d spend a certain amount of money to get a job done is a normal amount of time. If we crash the project, we add resources. The crash duration, in CPM, is the shortest possible time in which an activity can be completed, and the crash cost is how much you have to spend to achieve it. The value of early completion is how much it’s worth to get it done early. Since the goal of spending this extra money is to speed up project com- pletion, it only makes sense to crash activities on the critical path. Crashing noncritical activities just creates more slack. Using the network diagram in Exhibit 5–4, we’ll demonstrate a step-by-step crashing of a project. In Exercise 5–4, you’ll do your own. Let’s assume that the value of early completion is $250,000 per week. Clearly, it makes sense to crash Activity A ($200,000 per week), but not Ac- tivity H ($260,000 per week, more than the value of early completion). We spend an extra $1 million, but get $1.25 million in early completion value, for a net savings of $250,000. Crashing any of the noncritical activities doesn’t give us any benefit. On the critical path, we start with the cheapest crash (Activity F, save 1 week and 88 SUCCESSFUL PROJECT MANAGEMENT © American Management Association. All rights reserved. http://www.amanet.org/ Copyright2015.AMASelf-Study. Allrightsreserved.Maynotbereproducedinanyformwithoutpermissionfromthepublisher,exceptfairusespermittedunderU.S.orapplicablecopyrightlaw. EBSCO Publishing : eBook Collection (EBSCOhost) - printed on 10/19/2019 3:57 PM via UNIVERSIDAD NACIONAL ABIERTA Y A DISTANCIA - UNAD AN: 1520886 ; Dobson, Michael Singer.; Successful Project Management : How to Complete Projects on Time, on Budget, and on Target Account: ns145102.main.eds
  • 38. $150,000). Next, we crash Activity B, saving 3 weeks and $300,000. (Our proj- ect expenditure, however, increased by $550,000.) Before we start on Activity D, let’s go back and look at the critical path again. In the original project, B D F = 32 weeks, and C E G = 28 weeks. (We only count normal time for the initial calculation.) We’ve now crashed B D F by a total of four weeks, meaning that both paths are now 28 weeks, and critical! Even though there’s still the opportunity to crash Activity D, doing so won’t speed up our completion any more. But we’re not done yet. We can continue crashing, but now we have to crash both paths at the same time to get any more schedule benefit. The only crashable activity on the top route is Activity D, with a crash cost per week of $165,000. Of the three noncritical activities, the cheapest to crash is Activity E, at $50,000. There are two days in Activity E, so we only crash Activity D by the same two days. It costs us $165,000 + $50,000 per week, or $215,000, and we pick up another two days and save an additional $70,000. Are we done yet? The next cheapest pair is Activity D (which is now 13, 8) and Activity G. The combined crash cost of these activities is $245,000. This is very close to our limit. Depending on how confident we are of our numbers, we might or might not take this. If we do, we can take another three days out of Activity D and three out of Activity G for a net savings of $10,000. Activity D still has two days of potential crash left, and Activity C has three. But the cost of crashing both has now reached $265,000, above our PREPARING A PROJECT PLAN 89 © American Management Association. All rights reserved. http://www.amanet.org/ Key: “11, 8” = Normal time, Crash time (in weeks) $150 = Cost per week of crashing (in thousands) Critical path activities in black; noncritical activities in gray Value of early completion = $250,000 per week xhibit 5–4 Crashing a Project Using CPM Activity A 10, 5 $200 Activity B 11, 8 $150 Activity C 9, 6 $100 Activity D 15, 8 $165 Activity E 11, 9 $50 Activity F 6, 5 $100 Activity G 8, 5 $80 Activity H 5, 3 $260 Copyright2015.AMASelf-Study. Allrightsreserved.Maynotbereproducedinanyformwithoutpermissionfromthepublisher,exceptfairusespermittedunderU.S.orapplicablecopyrightlaw. EBSCO Publishing : eBook Collection (EBSCOhost) - printed on 10/19/2019 3:57 PM via UNIVERSIDAD NACIONAL ABIERTA Y A DISTANCIA - UNAD AN: 1520886 ; Dobson, Michael Singer.; Successful Project Management : How to Complete Projects on Time, on Budget, and on Target Account: ns145102.main.eds
  • 39. $250,000 value. Therefore, we won’t crash those last two activities. Exhibit 5–5 summarizes what we did. If this sounds a little too good to be true, notice we spent an additional $2,715,000 to achieve a time savings of 14 weeks. The gross benefit of being 14 weeks early is $3,500,000. Subtract those extra costs to get a net benefit of $785,000. Instructions: Perform a CPM analysis of the following project. Critical path activities are shown in black and noncritical activities are shown in gray. The value of early completion is $250 per day. COMMUNICATIONS AND STAKEHOLDER MANAGEMENT PLAN We’ve already emphasized the importance of stakeholder management and communication in project management. In the planning stage, you should think about exactly what you need to do to achieve your goals in these areas. Do you need to have regular meetings with stakeholders? Do you need to give them reports or briefings? Do they need to be in the loop in specific decisions or on specific issues? Are they entitled to certain project informa- tion? Is there information that should not be provided to them? It’s important to get this down in writing in some organized form. With numerous stakeholders and different information requirements, it’s all too easy to forget who is supposed to know what, when, and how often. Exercise 5–4 CPM Analysis Activity A 0, 0 $0 Activity B 15, 10 $100 Activity D 21, 18 $125 Activity C 11, 9 $150 Activity E 9, 7 $175 Activity F 8, 1 $200 Activity G 12, 5 $100 Activity H 2, 1 $50 Critical Path = 0 + 15 + 21 + 8 + 2 = 46 Slack = 46 - (0 + 11 + 9 + 12 + 2) = 46 - 34 = 12 90 SUCCESSFUL PROJECT MANAGEMENT © American Management Association. All rights reserved. http://www.amanet.org/ Copyright2015.AMASelf-Study. Allrightsreserved.Maynotbereproducedinanyformwithoutpermissionfromthepublisher,exceptfairusespermittedunderU.S.orapplicablecopyrightlaw. EBSCO Publishing : eBook Collection (EBSCOhost) - printed on 10/19/2019 3:57 PM via UNIVERSIDAD NACIONAL ABIERTA Y A DISTANCIA - UNAD AN: 1520886 ; Dobson, Michael Singer.; Successful Project Management : How to Complete Projects on Time, on Budget, and on Target Account: ns145102.main.eds
  • 40. One way to prepare a communications and stakeholder plan is to organize it in a chart form, such as the one in Exhibit 5–6. In Exercise 5–5, you’ll de- velop one for the PMO case study project. Instructions: Complete the communications and stakeholder management plan for four stakehold- ers of your choice. Exercise 5–5 Communications and Stakeholder Management Plan Stakeholder What the stakeholder needs/wants from us What we need/want from the stakeholder Communications Strategy Responsible Person PREPARING A PROJECT PLAN 91 © American Management Association. All rights reserved. http://www.amanet.org/ xhibit 5–5 Summary of Crashing Activities Crash Activities Time Saved Money Saved Cumulative Time Saved Cumulative Money Saved 1 A 5 weeks $250,000 5 weeks $250,000 2 F 1 week $150,000 6 weeks $400,000 3 B 3 weeks $300,000 9 weeks $700,000 4 D, E 2 weeks $70,000 11 weeks $770,000 5 D, G 3 weeks $15,000 14 weeks $785,000 Exercise 5-5 continues on next page. Copyright2015.AMASelf-Study. Allrightsreserved.Maynotbereproducedinanyformwithoutpermissionfromthepublisher,exceptfairusespermittedunderU.S.orapplicablecopyrightlaw. EBSCO Publishing : eBook Collection (EBSCOhost) - printed on 10/19/2019 3:57 PM via UNIVERSIDAD NACIONAL ABIERTA Y A DISTANCIA - UNAD AN: 1520886 ; Dobson, Michael Singer.; Successful Project Management : How to Complete Projects on Time, on Budget, and on Target Account: ns145102.main.eds
  • 41. 92 SUCCESSFUL PROJECT MANAGEMENT © American Management Association. All rights reserved. http://www.amanet.org/ xhibit 5–6 Communications and Stakeholder Management Plan Template Stakeholder What the stakeholder needs/wants from us What we need/want from the stakeholder Communications Strategy Responsible Person Customer Successful outcome, updates on progress, major issues Continued support, satisfied with outcome, feels informed Weekly status summary, monthly meeting, inform about major issues Project manager Project sponsor Successful outcome, detailed progress information, major issues and decisions Approvals, support, resources, money, understanding Weekly status report and meeting, escalate issues as needed, give early warning of potential issues Project manager Project team members Successful outcome, knowing overall status, having clear direction and support Hard work, results, early warning of issues, creative problem-solving, teamwork Daily check-in, weekly status meeting, regular praise for achievements Project manager Project manager Successful outcome, detailed knowledge of what’s going on, active support from other stakeholders, clear goals Leadership, problem- solving, running interference, providing support Daily check-in and weekly status meeting with team, weekly meeting with sponsor, monthly meeting with customer Team, Sponsor, Customer Exercise 5–5 continued from previous page. Copyright2015.AMASelf-Study. Allrightsreserved.Maynotbereproducedinanyformwithoutpermissionfromthepublisher,exceptfairusespermittedunderU.S.orapplicablecopyrightlaw. EBSCO Publishing : eBook Collection (EBSCOhost) - printed on 10/19/2019 3:57 PM via UNIVERSIDAD NACIONAL ABIERTA Y A DISTANCIA - UNAD AN: 1520886 ; Dobson, Michael Singer.; Successful Project Management : How to Complete Projects on Time, on Budget, and on Target Account: ns145102.main.eds
  • 42. The first iteration of a project plan is an important milestone, but not the end of the process. Normally, you should expect to develop a lot of additional information and detail to flesh out the plan and address issues. Staffing and developing the project team must involve determining the skills your project requires and the skills that team members bring to the table. You may need to negotiate (or renegotiate) team size based on this analysis. A responsibility assignment matrix (RAM) is often used for this purpose. When you assign team members to activities in your network diagram (known as loading the schedule), you may discover that you have booked the same team member on simultaneous activities. To resolve the problem, you must level the schedule, either by mov- ing the start date of tasks to allow the same person to complete both, or by obtaining additional resources to cover the overlap. In addition to in-house resources, outsourcing may be an option. Make or buy decisions are used to determine whether it is best to do par- ticular project activities in-house or procure them elsewhere. Such decisions should be made as early in the project planning process as feasible. Procure- ment requires active management and will likely alter your list of activities, network diagram, and other project planning documents. The critical path method (CPM) takes advantage of the fact that there is often a financial benefit to finish a project early, and that additional resources can speed up many activities. As long as you spend less in additional resources than the time savings is worth, you end up with a project that is both faster and cheaper. In crashing a project, you focus on critical path activities, because shortening them will shorten project duration, whereas shortening noncritical activities only increases the amount of slack. A communications and stakeholder management plan allows you to de- fine the specific communications strategies and activities you will follow, so that you can add them to the work of the project. PREPARING A PROJECT PLAN 93 © American Management Association. All rights reserved. http://www.amanet.org/ Copyright2015.AMASelf-Study. Allrightsreserved.Maynotbereproducedinanyformwithoutpermissionfromthepublisher,exceptfairusespermittedunderU.S.orapplicablecopyrightlaw. EBSCO Publishing : eBook Collection (EBSCOhost) - printed on 10/19/2019 3:57 PM via UNIVERSIDAD NACIONAL ABIERTA Y A DISTANCIA - UNAD AN: 1520886 ; Dobson, Michael Singer.; Successful Project Management : How to Complete Projects on Time, on Budget, and on Target Account: ns145102.main.eds
  • 43. Why should you prepare a communications and stakeholder 1. (d)1. management plan? To keep the CEO and top executives up to date on project progress(a) To ensure that project team members know the activities for which(b) they are responsible To keep stock analysts informed of major projects(c) To avoid forgetting who is supposed to know what, when, and how often(d) The value of critical path analysis is: 2. (a)2. to determine when spending additional resources to speed up an(a) activity is profitable. to manage the effects of uncertainty in a project plan.(b) to determine the total duration of a project with parallel activities.(c) to manage loading and leveling of the schedule.(d) If John is assigned to two parallel activities with schedule dates that 3. (d)3. overlap, one solution is to: tell John to do the activities and not be late, or there will be(a) consequences. stop the project because it cannot be accomplished.(b) document the problem in your regular progress report.(c) find another person to do one of the activities.(d) What is the difference between PERT and CPM? 4. (c)4. CPM is designed to help plan projects with high uncertainty;(a) PERT is designed to determine when extra resources will profitably speed the schedule. PERT is designed to help plan projects with complex technical(b) activities; CPM is designed to plan projects with large numbers of team members. PERT is designed to help plan projects with high uncertainty;(c) CPM is designed to determine when extra resources will profitably speed the schedule. PERT is designed to plan projects using a lot of contracting and(d) outsourcing; CPM is designed to plan projects when in-house resources will be used. What is a responsibility assignment matrix? 5. (c)5. A list of skills required to complete project activities(a) A tool to ensure that all communications and stakeholder management(b) activities have owners A tool that links resources to activities(c) A list of skills possessed by your team members(d) Review Questions 94 SUCCESSFUL PROJECT MANAGEMENT © American Management Association. All rights reserved. http://www.amanet.org/ Copyright2015.AMASelf-Study. Allrightsreserved.Maynotbereproducedinanyformwithoutpermissionfromthepublisher,exceptfairusespermittedunderU.S.orapplicablecopyrightlaw. EBSCO Publishing : eBook Collection (EBSCOhost) - printed on 10/19/2019 3:57 PM via UNIVERSIDAD NACIONAL ABIERTA Y A DISTANCIA - UNAD AN: 1520886 ; Dobson, Michael Singer.; Successful Project Management : How to Complete Projects on Time, on Budget, and on Target Account: ns145102.main.eds