SlideShare a Scribd company logo
1 of 105
Introduction to Computer Applications in Metal
Casting
-Computers are being increasingly applied for design of patterns and castings and
for other tasks in the casting industry;
computer modeling of phenomena associated with the solidification of molten
metals is common practice;
-This include: Modeling of Solidification Heat Transfer; Modeling of
Microstructural Evolution; Modeling of Combined Fluid Flow and Heat/Mass
Transfer;
-Modeling of Solidification Heat Transfer, describes the increase in computer
applications to what is now termed the macroscopic scale of modeling casting
solidification, that is, the movement of freezing fronts;
-Modeling of Microstructural Evolution, looks at a different, more recently
developed aspect--macro-microscopic modeling--from which the evolution of
microstructure can be deduced; without consideration of the free and forced
convection phenomena in zones of liquid or partially liquid metal;
Modeling of Fluid Flow, describes how the computer can be applied to study the
flow of metal through the gating system into the casting mold cavity;
- Modeling of Combined Fluid Flow and Heat/Mass Transfer, explains how the
combined action of the fluid flow and heat/mass transfer that occurs during the
pouring and filling of the castings can affect the initial temperature distribution of
the molten metal. 1
Advantages of Computer Modeling
-Computer-aided design (CAD), computer-aided manufacturing
(CAM), and-computer-aided engineering (CAE) offer a number of
advantages for castings. These include:
· Increased casting yield per pound of metal poured;
· Improved casting quality (absence of unsoundness);
· Enhanced productivity of casting system;
· Geometric models provide casting volume, weight, and surface area
data, allowing rapid cost-estimating and permitting efficient rigging
design;
· Automated enmeshment for general purpose heat transfer simulators
permits shorter design time;
· Automated machining of patterns, which in turn reduces costs;
· Fewer prototypes to be experimentally evaluated; shorter lead times
from design concept to product;
· Easier implementation and evaluation of engineering changes;
· Enhanced ability to deal with batch production of castings of different
design.
2
Modeling of Solidification Heat Transfer
• Geometric Description and Discretization
• The form of the differential equations describing the diffusion of heat into the
mold, together with the progress of freezing within the casting, is given for
modeling using computer since 1960’;
• To predict freezing history in complex industrial castings, the three-
dimensional form must be provided and the correct boundary conditions
specified. Even prior to this, there are several valid reasons for defining
accurately and unambiguously the geometry and topography of the casting
and its rigging:
· Performing the analysis to generate preliminary rigging design;
· Estimating the overall costs for casting production for the purpose of
quotation;
· Defining the melting capacity and molding equipment needs within the casting
plant;
· Generating the tapes or other information storage forms required to drive
machine tools needed for the fabrication of patterns and core boxes and the
sinking of wax pattern, permanent mold, and die casting dies;
3
-The need to provide this geometric representation and to link the
chosen form of representation with the process of discretization, that is,
the breaking up of the whole into discrete elements, has been
recognized as being of prime importance;
-Turning first to the problem of overall geometry, much can be gained
by examining the capabilities of the many geometric modelers now
available;
-The three most established types of geometric representation are :
· Constructive solid geometry (csg)
· Boundary re presentation (b-rep)
· Wireframe (wf)
4
Three types of three-
dimensional geometric
representation of a simple
casting. (a) Constructive
solid
geometry. (b) Boundary
representation. (c)
Wireframe
5
-The wireframe is not a true solid modeler, but because it normally
forms an important part of many preprocessing packages for
commercial finite-element method (FEM) computational codes, it is
sometimes listed as a form of geometric modeling;
- The csg and b-rep approaches are both often incorporated into
commercially developed computer-aided design (CAD) packages.
Figure 2 shows a csg-based model for a partial section of a casting in
the form of a thick-wall cylinder together with its rigging. -Many
contemporary modeling routines permit not only hidden-line removal
but also the use of color and shading;
- Figure 3 shows a representation of a small aerospace casting;
-Perhaps the true test of the utility of a geometric modeling package
lies in its ability to represent the full range of complex shapes
involved in commercial casting;
- A particular feature, which is likely to appear in most common
casting configurations, is that of fillets, which are a necessary
patternmaking expedient and something seen when one solid
6
Portion of a geometric model of a casting with
rigging, constructed using a csg geometric
modeler. F, feeder or riser; G, ingate location;
P, pouring basin; R, reaction chamber; RB,
runner bar; S, sprue; ST, slag trap.
A partially sectioned three-
dimensional geometric model
of a small aerospace casting
7
Blending together of surfaces using fillets in
preparation of models for patternmaking or
for simulation studies. (a) Normal blend with
edge limits. (b) Constant-radius blend
Although the surface-modeling
technique does not provide a
complete geometric description of
an object, it has been the basis of
one of the most successful
attempts thus far to link together
computer-aided design and
manufacture in the metal casting
industry. The DUCT program,
which originated at Cambridge
University is able to produce a
surface model from a given spine
and an orthogonal section set .
Such information can then be
conveyed to patternmaking and
core box fabricating machinery on
a routine basis.
8
Method by which a surface-modeling program
DUCT, is used to build a model from a spine
(dotted line) and a series of orthogonal sections.
The sections are joined by Bezier curves. This
technique has been used in the production of
automobile manifolds. (a) Single closed DUCT.
(b) Single open DUCT. (c) Combination of
several closed DUCTs
Before a model of any
description can be built
and a freezing simulation
entered into, the foundry
methods engineer must
have a reasonably
accurate picture of the
location and
dimensioning of the
various components of
the rigging system (the
gating and risering
subsystems) that are to be
employed during casting;
- Two approaches are
being followed as
alternatives to the age-
old art of cut and try;9
Cont’d
- These techniques are both computer based, and one in particular uses
(most effectively) the readily available personal computer rather than
the mainframe machine demanded by both geometric representational
(csg, b-rep, etc.) and numerical computational (FDM, FEM, etc.)
programs. The techniques can be referred to as:
· Special-purpose foundry rigging engineering programs
· Knowledge-based expert systems programs
-Special-Purpose Programs. Many programs fall under the category of
special-purpose programs ;
• One of the most versatile, the Novacast program , determines riser
sizes by using the well-known Chvorinov rule and locates them by
using various other empirically derived feeding range rules. The
program will also approximate the geometric features of the gating
system using the Bernoulli approximation, together with other
empirical axioms. This type of program has met with relatively wide
acceptance in foundries around the world. 10
Knowledge-Based Expert Systems. Microcomputer programs are often sufficient
for designing the rigging of castings of a less critical nature. However, for those cast
components that form parts of aerospace systems or for the safety features of
pressure vessels, and so on, further engineering measures are often necessary.
-In such cases, the need arises for a knowledge-based expert system and its
associated data base. In any particular organization, a vast amount of the expertise
involved in the art of foundry practice often disappears with the retirement of certain
employees. Although there is no unique solution to the problem of rigging a
particular casting, there are many valuable, although sometimes conflicting, opinions
available for consideration.
FEM Software. Turning to the question of discretization of space within and around
the casting (the mold cavity and the mold itself), a number of commercial FEM
packages are associated with preprocessing routines that perform the subdivision
involved, together with the parallel preparation of files describing that discretization
(numbering of elements and nodes, and so on). A simple example of the enmeshment
of both mold cavity and the mold itself is shown in fig. below ;
-No special attempt was made to vary mesh density in particular locations. It should
also be mentioned that the configuration in Fig. represents a two-dimensional object.
Nonetheless, Fig. serves to indicate how rapidly the file-keeping capacity of the
computer system will be occupied as the complexity of component design increases.
11
Discretization (enmeshment) of a plate casting and riser, together
with the mold into which they are to be cast
Figure also shows that a preponderance of elements (or nodes) exists within
the mold, per force of its enveloping nature with respect to the casting
12
The Computational System
• Many successful casting simulations have employed large-scale
commercially available, general-purpose programs;
• some research groups have chosen to build their own simulation programs
or solvers. The development of such a program, a dedicated special-
purpose FEM code, is used;
• This particular system--The Michigan Solidification Simulator (MSS)--
was written exclusively for modeling the general problems of steady-state
or transient energy transfer with nonlinear material properties, phase
change, and imposed bulk-flow velocity fields;
-Two-dimensional Cartesian and cylindrical, three-dimensional Cartesian
element types (including interfacial contact resistance elements), totaling
three coordinate systems and ten element types, can be supported;
- In solving the basic governing equations, the simulator permits the use of
the following boundary
• conditions:1. Temperature specified, 2. Heat flux specified,3. Radiative
heat transfer specified;4. Convection heat transfer specified
13
Cont’d
• Because heat transfer expressions for the third and fourth conditions
have the same mathematical form, only three expressions are
required to represent all four boundary conditions;
• Currently, a uniform initial temperature field must also be specified;
• The computations involve the use of the Galerkin method of
weighted residuals;
• The discretization of the geometry involved in the simulation uses
triangles, distorted bricks, and distorted rectangles according to
whether two- or three-dimensional castings are to be modeled;
• At present, the division of a particular domain is undertaken
manually. The validation of the program has been performed, first,
using cases where analytical solutions exist, principally for one-,
two-, and three-dimensional transient heat transfer with various
boundary conditions but without solidification; second, for a case
involving a latent heat source term but zero superheat, for which an
analytical solution exists; 14
Cont’d
finally, for a variety of axisymmetric and three-dimensional examples
involving the actual solidification of metals, where validation was
undertaken experimentally from thermocouple measurements or
sectioning .
The actual castings simulated were:
· A cylindrical gray iron casting poured in dry sand;
· A cylindrical Al-13Si casting poured in dry sand;
· A carbon steel rail wheel casting;
· An investment cast Alloy IN-100 plate;
-In the first three cases, very good agreement was obtained between
simulation and experiment.
• The rail wheel casting was chosen as an example of an industrial
casting ; There are no experimental thermocouple data available, but
radiographs and casting sections allow inference of cooling patterns
and analysis of defects;
15
Cross sectional view of a railwheel casting,
with dimensions given in inches. The casting
was poured in plain carbon steel
16
Cont’d
• The finite-element results for casting C are plotted as isotherms in Fig.
below. The isotherms are the liquidus (1515 °C) and the solidus (1485 °C).
The flange region has a pool of liquid metal that is cut off from the riser by
the solidified web. One would expect to see defects in the sectioned casting
near this point, and in fact there are defects
• in this region, as predicted by the numerical simulation .
Results of FEM simulation of railwheel
casting using configuration C for riser .
Pattern of liquidus and solidus isotherms
suggests that shrinkage will occur in the
The same simulation was run for casting
geometry F, which has 13 mm of
additional metal padding on each side of
the web. Isotherms from that simulation
are shown in Fig. below and indicate that
the casting should be sound due to the
directional solidification. Actual casting
sections of casting F showed no
shrinkage defects, thus validating the
simulation.
17
Cont’d
Results of FEM simulation of
railwheel casting using
configuration F for riser . Web
between
hub and rim has also been
thickened. Isotherms suggest that
the casting should be sound
The investment cast plate proved to be more
complex to simulate because the surroundings
of the investment play an important role. In
this case, the agreement was found to depend
on the condition assumed for radiation
exchange between the investment
shell/kaowool wrap and the surrounding
environment (an evacuated furnace). In
particular, the radiation view factors were seen
to be important .
The finite-element method is not the only
system in use for performing simulations of
shaped casting solidification. Many previous
models have been successfully run using the
finite-difference method, while more recently
publications have appeared describing the use
of the boundary-element method, the control
volume method, and new developments of the
finite-difference method ; 18
Cont’d
-At this time, the FEM-based techniques still possess the greatest
all around flexibility.
-Particular attention should be paid to the:
· Ability to handle complexities of external shape;
· Ability to handle totally enclosed portions of the mold, such as
coring;
· Speed of computation and type of computer on which the
simulation is run;
· Linkages provided with pre- and post processing packages, in
particular the existing commercially available;
• geometric modeler based CAD systems.
19
Modeling of Solidification Heat Transfer
The Data Base
-All mathematical models of the solidification process should possess :
· An accurate representation of geometry;
· An adequate treatment for evolution of latent heat;
· A sensitivity to the thermophysical properties of the materials involved
in this process;
-The thermophysical property data basenfor solidification modeling is a
vast but sometimes sparsely populated region. By considering the most
common molding material in shaped casting (bentonite-bonded silica
sand), particularly the relationship that its apparent (or effective) thermal
conductivity k has with temperature, one can appreciate part of the
problem associated with data base development or expansion. As shown
in Fig. below, k is a complex function of temperature.
20
Cont’d
In addition, one must specify the moisture content (even when
considering dried sand), ramming density, average grain fineness, and
the sand source . Recognizing the burgeoning number of mold materials,
which now include zircon, olivine, and chromite sands the potential for
data base depth seems almost limitless. A collection of such data has
been made that includes curve fitted relationships linking temperature
with thermal conductivity, specific heat, and other properties of molding
and casting media If such data were not found to be readily available,
estimates were made. This was especially true for the thermophysical
properties of metals and alloys above their melting points or ranges.
21
Variation of apparent thermal conductivity with temperature
for compacts of silica sand containing various binder
contents. 22
Apparent thermal conductivities of four types of clay-bonded molding
sands
It was mentioned earlier that in most modeling problems in this area,
where numerical analysis is used, the number of elements (or nodes)
located within the mold itself vastly outnumbers those within the casting;
23
Cont’d
-In recent years, there has been a determined effort on the part of several
workers to replace the mold in the simulation with either a heat flux data
map or a tabulated series of equivalent heat transfer coefficient values,
thus essentially changing the boundary;
- Figures below compare conventional (mold enmeshment constrained)
and these alternative (boundary heat flux or boundary curvature
governed) calculations.
Computed solidification front movement for pure aluminum in a sand mold. One quarter of a
rectangular bar section is shown. (a) Results of FDM simulation using conventional approach,
in which the mold is enmeshed and mold properties depend on temperature. (b) Same as (a),
except mold properties are assumed to be constant. (c) Mold is not enmeshed, and heat flux q
is specified at the mold/metal interface.
24
Cont’d
Successive positions of the solidus isotherms in a one-quarter section of an H-shaped casting
(lowcarbon steel in sand). Time is in seconds, H half-height is 50 mm (2 in.), and half-width is
30 mm (1.2 in.).
Results using standard FEM method are compared with those obtained using boundary
curvature method
25
Interpreting the Output of the Computer
Simulation
• A common failing of many early computer applications to design engineering
lay in the inability of the software to summarize the meaning of the many lines
of data emerging as output. This led to the appearance of efficient
postprocessing software capable of displaying, for example, two- or three-
dimensional stress plots or isotherms, depending on the nature of the numerical
analysis. Commercially available postprocessing routines display such
information superimposed on the geometric outline of the component
Two views from a simulation of
the solidification of a John Deere
engine block 253 s after pouring.
The material is eutectic gray cast
iron with a freezing point of 1140
°C . The back surface is a plane of
symmetry.
26
Cont’d
• With suitable interaction, certain routines will permit the generation
of maps displaying the change of specific criteria functions affecting
casting soundness;
• Such functions are normally selected on the basis of theoretical
considerations and may, for example, involve some combination of
local temperature gradient, G; freezing front speed, V; or cooling
rate, R or T;
- The effect of combinations of such parameters on governing feeding
characteristics of steels is illustrated in below;
• Similar criterion functions for other cast metals, although data are
currently unavailable, are the focus of extensive research and
development.
27
Results of an FDM simulation of portions of a steel casting. Shown are local
solidification time (hours), local temperature gradient during freezing (°C/cm),
and a criterion function G/ R , where R is rate of cooling during freezing. The
freezing isotherm suggests that shrinkage could occur in the upper half of the
casting. The criterion function does not suggest shrinkage, and the casting was
sound.
28
Modeling of Fluid Flow
Introduction
• FLUID FLOW MODELING is a technique that uses computers to
investigate flow phenomena. These flow phenomena, particularly
during the initial filling stage, have major effects on the quality of
castings;
• Designers have commonly relied on experience, rule of thumb, and
handbook information to achieve their objectives of smooth flow,
proper filling time, minimum gas entrapment, elimination of
inclusions and dross, and the desired distribution of metal during
mold filling;
• The goal of improving the quality and cost-effectiveness of castings
by means of computer-aided design (CAD) and modern process
control requires that data be expressed more scientifically, so that
they are amenable to computation;
• fluid flow during the filling of castings is important not only in
itself, but because it affects heat transfer both during and after
filling. This must be taken into account in models of heat transfer
and stress analysis in castings if they are to give the most accurate
results. 29
Cont’d
• It is difficult to make direct observations of fluid flow inside molds,
because the molds and the molten metal are opaque, the
temperatures are high, and the conditions are highly transient;
• Even when observations are made, the location of the metal as a
function of time is usually the only information that can be obtained;
• Not only is fluid flow modeling using computers usually the most
economical and practical way to get information about what is going
on inside a mold during filling, it is often the only feasible way;
• Furthermore, it can give information about the velocity and pressure
distributions within the molten metal which cannot be obtained by
direct observation;
• Computational techniques for modeling flow during mold filling can
be divided into two categories :
· Energy balance techniques based on the Bernoulli equation and the
Saint-Venant equations;
· Momentum balance techniques based on the Navier-Stokes equations
as embodied in the Marker-and-Cell group of programs which
include the Marker-and-Cell (MAC), Simplified Marker-and-Cell
(SMAC), and Solution Algorithm (SOLA) techniques; 30
Cont’d
• The energy balance techniques are most useful for modeling flow
through sprues, runners, and gates when the direction of flow is
dictated by the configuration of the system;
- The momentum balance techniques are needed for calculating flow
inside mold cavities where the direction of flow and the location of
the fluid must be calculated.
Energy Balance Methods
Because energy is a scalar rather than a vector quantity, these methods
are primarily useful in determining flow rates in cases in which the
direction of flow is established by the configuration of the system;
- The Bernoulli equation is used for calculating flow in completely filled
channels such as sprues, pressurized runners, and gates, while the Saint-
Venant equations are used for partially filled channels such as
nonpressurized runners and troughs;
- Information provided by these calculations is extremely important to
the design and manufacture of castings;
-Now, CAD programs can apply these techniques to complicated systems
with speed and accuracy.
31
Cont’d
• The Bernoulli equation applicable to this system may be written :
where Pi and Pj are pressures at positions i and j, Vi and Vj are mean
velocities at positions i and j, zi and zj are elevations at positions i and j,
bi and bj are velocity distribution factors (0.5 for laminar flow and 1.0
for highly turbulent flow), g is the acceleration due to gravity, ρis the
fluid density, and E i, j f is the friction energy loss between positions i
and j.
-The friction energy loss term E i, j f is a function of the velocity, the
Reynolds number, and the configuration of the system between positions
i and j . The Reynolds (NRe) number is defined by:
where ν is the kinematic viscosity and De is the equivalent diameter
32
Gravity-filled casting system
analyzed by the Bernoulli
equation approach. Numbered
planes correspond to the
subscripts used in Eq .
The configuration of the
system may change from point
to point resulting in variations
of the velocity and the
NRe.Thus,E i, j f must be
calculated for each segment of
the system and then summed
for the whole system.
-For some uses, it is not necessary to
consider friction energy loss. For
example, the calculation of sprue
taper is often done without it . The
objective is to calculate the change in
the cross section of a vertical sprue
that will compensate for the
acceleration of the molten metal as it
drops through the sprue under the
influence of gravity.
This yields the following equations for
the ratio of the cross-sectional areas at
the top (A2) and bottom (A3) of the
sprue, or for the diameters of a round
sprue at the same points:
33
Cont’d
Sprue taper needed to compensate for the acceleration of molten metal in gravity feed
calculated using Eq 3 or Eq 4. Numbered planes correspond to subscripts in either
equation. 34
Cont’d
• If friction is considered, this equation is modified to:
where the e i, j f are friction energy loss coefficients such that:
Introduction of a friction energy loss e 2,3 f within the sprue reduces
the taper required, while a friction energy loss e 1,2 f above the sprue
increases it;
-In nonferrous casting, it is common practice to use nonpressurized
filling systems in which the runners are only partially filled with
liquid metal;
- These can be modeled with the Saint-Venant equations , which are
useful when the bottom of the channel and the free top surface of the
stream slope at different angles . They are also used when the flow
rate and the top surface of the stream vary with time.
35
Cont’d
• The equation of continuity is written:
where WT is the width of the channel at flow depth Y, t is time, and VA
is the product of velocity and fluid cross-sectional area (that is, the
volumetric flow rate).
Bottom of a partially filled runner or open channel (designated by
cross-hatched area, or bed) having a slope of (Z1 - Z2)/ΔX and fluid
depth of Yi.
The equation of motion for the
steady state case may be
written:
36
Cont’d
• where the actual slope of the bottom of the runner So is:
and the so-called friction slope Sf is defined by:
where Rh is the hydraulic radius and n is Manning's roughness
coefficient, the values of which are determined empirically using
similarity principles.
For the time-dependent case, the equation of motion may be written:
in which the last term represents the acceleration.
Note that the roughness factor n takes into account the channel
configuration as well as the surface roughness and may change
frequently along the course of the channel. It is larger at the tip of the
entering stream than in areas already containing a layer of molten metal.
37
Cont’d
• For CAD and analysis of mold-filling systems, the Bernoulli and/or
Saint-Venant representations of each of the individual sections of the
system can be combined into a network of series and parallel paths;
• The friction energy loss factors and the friction slopes must be
obtained from empirically derived correlations with the NRe and
other dimensionless numbers;
• Their use commonly calls for iterative solutions, because they are
functions of the velocity and free surface height, which are
dependent variables one seeks to determine;
• Literatures most often presents the necessary empirical correlations
in graphs;
• The relationships represented by the graphs can be reduced to a set
of parametric equations for use by the computer.
• For example, the information shown in Fig. below may be reduced
to:
38
Cont’d
where eb is the head loss
coefficient, β is the angle shown
in Fig. , and σ is AS/AL. In spite
of its complicated appearance,
the solution may be found very
swiftly on any computer.
Head loss coefficient for a gradual enlargement plotted as a function of the area ratio
(σ = AS/AL) and the angle β. Open circles indicate selected eb values obtained using
above eq.
39
Cont’d
• The Bernoulli and Saint-Venant equations can be used in a design
program that includes the rules of good practice frequently used in
the foundry industry. From experience, for example, rules have been
established that specify the acceptable range of filling times for
castings of a given type as a function of the casting weight. These
rules also suggest a certain size for the sprue, one for the runner, and
one for the gate, which can be used to produce an initial design;
• The accuracy can then be verified by performing the energy balance
calculation described above ;
• The design can be modified and the energy balance calculation
performed again until the calculated result agrees with the desired
filling rate. This technique allows special plant conditions to be
considered, such as limitations on the amount of molten metal
available at one time, and limitations on the flasks and patterns
available for making the mold;
• This type of modeling of metal flow during mold filling has been
integrated into CAD systems that produce finished drawings for the
pattern and mold shops. In some cases they even produce numerical-
control (NC) tapes for cutting the pattern. An example of a drawing
for the pouring basin, sprue, runner, and gates for a particular casting
40
Typical layouts of a mold-filling system obtained from a CAD program based on
sound foundry industry practice and refinements by Bernoulli and Saint-Venant
equations. (a) Pouring basin, sprue, and sprue base layout. (b) Runner-gate layout.
Dimensions given in inches.
41
Physical Modeling of Mold Filling
• It is important to verify computational models of mold filling with
physical experiments. Physical modeling of metal flow is most often
done with water in transparent molds. Water is a suitable fluid model
because its kinematic viscosity is nearly the same as that of common
metals at their normal pouring temperatures, especially if the
temperature of the water is properly controlled. For example, the
kinematic viscosity of water at 35 °C is the same as that of 0.5%C
steel at 870 °C ;
• To model the flow of liquids influenced by inertial, viscous, and
gravitational forces requires NRe and Froude number, NFr,
similarities, in which the Froude number is defined as NFr = V2/gL,
where L is the characteristic dimension of the system. This is obtained
when water at the temperature to achieve proper kinematic viscosity is
used in models of the same size as the real system. The application of
water models to mold filling is
• It is possible to observe the flow of actual metals into molds from x-
ray cinematography studies ;
• Greater detail of the flow of metal into sand molds was observed by
filming with a high speed motion picture camera focused through a
plate glass window on the side of the mold . 42
Cont’d
• Molten cast iron entering a silica sand mold was filmed with this
technique. The molten metal locations traced from these films
will be shown in "Correlations With Actual Metal Flow."
• Recently, computerized data acquisition systems have been used
to observe the flow of molten metal into nontransparent three-
dimensional molds ;
• Two types of sensors have been used: simple contact wires and
thermocouples. The simple contact wires are connected to the
digital inputs of the data acquisition unit. Molten metal contacting
a bare copper wire completes a circuit, and this is then detected
by the data acquisition unit;
• The digital inputs can be read very rapidly by the computer; it is
possible to read hundreds of such contact points many times
during the filling of a single mold. An accurate picture of the
location of the metal at any time can be developed from these
data. A clever system for using a finite element postprocessor for
presenting the results of such experiments has been reported.
43
Cont’d
Three-dimensional visualization of molten metal locations determined by the
contact wire method and displayed by a finite-element postprocessor. Numbers in
the figure are filling times in seconds
Thermocouples can be used alone or in conjunction with the contact wire sensors.
Although they give more information than do simple contact wires, thermocouples
produce an analog signal that takes longer to read. The combination of contact wires
and thermocouples is particularly useful for observing the flow and solidification
patterns in thin-wall castings having the problem of premature freezing (namely,
cold shuts).
44
Momentum Balance Techniques
• Fluid flow within the mold cavity during filling is transient; the
amount and location of the liquid changes rapidly. Calculation of the
location of the liquid and the orientation of its free surface must be
an integral part of the computational techniques used to model it. The
family of computational techniques called MAC , SMAC , and
solution algorithm-volume of fluid (SOLA-VOF) are well suited for
handling these problems;
• Although they differ from each other in the way they keep track of
the location of the free surface and the way in which they perform
some of the internal iterations, they are based on the same principles.
To simplify the discussion, the acronym MAC is used to
represent this whole family of computational fluid dynamics
techniques.
MAC Technique Highlights
• MAC uses a finite-difference scheme for the mathematical analysis
of fluid flow problems . Like most of these techniques, MAC first
divides the system (that is, the configuration of the casting cavity
under discussion) into a number of subdivisions, called cells, which
are usually rectangular. 45
Cont’d
• Then a set of imaginary markers (in MAC and SMAC) or fluid
function values called F (in SOLA-VOF) is introduced into the
system to represent the location of the fluid at any instant;
• The velocity field of the moving fluid domain can be calculated by
the application of fluid dynamics principles;
• Next, the markers are moved, or the fluid function is updated,
according to the calculated velocity field in order to represent the
new location of the fluid domain. This procedure can be repeated
from the beginning when the cavity is empty until it is completely
filled.
46
Flow pattern obtained 3.95 s after pouring begins showing MAC cell
divisions and fluid domain locations (indicated by triangular markers
47
Fluid domain plot obtained with the fluid function F using the SOLA-VOF
technique. F = 1.0, 0.0 < F <1.0, and F = 0 indicate full, surface, and empty cells,
respectively
48
• Fluid Domain Identification
• In MAC, the cells are designated as full, surface, or empty,
based on the location of markers or the distribution of the
fluid function. With the marker approach, a full cell is one
that contains at least one marker, if all of its neighboring
cells contain markers as well. A surface cell contains at least
one marker, but has at least one neighbor without any
markers.
• An empty cell is any cell with no markers. With the fluid
function technique, F represents the fraction of the volume
of a cell that is filled with fluid. F can have values from 0 to
1. F is 1 for a full cell, 0 for an empty cell, and some
fractional value for surface cells. The fluid function F can
also be used to calculate the approximate location and
orientation of the free surface of the fluid. Collectively, the
full cells constitute the interior region, and the surface cells
constitute the surface regions.
49
Cont’d
• Calculating Velocity Field in Moving Molten Metal
• After the flow domain and the corresponding interior and surface
regions of the domain have been identified, the velocity and
pressure fields within the flow domain are calculated. The
physical conditions that govern the flow behavior in the interior
regions are somewhat different from those in the surface regions.
• Interior-Region Flow Behavior. In the interior regions, the
following principles should be obeyed in a cell volume:
• Mass Flow In Equals Mass Flow Out. This is due to the
incompressible nature of molten metal. This gives the following
form of the continuity equation in two dimensions:
where u and v are the velocity components in the x- and y-directions.
50
Cont’d
• Momentum Change Equals Momentum In Minus Momentum Out.
In mathematical form this is:
In the x-direction:
In the y-direction:
where t is time, p is pressure/density, v is viscosity/density, and g is the
acceleration of gravity. The Equations are commonly called the
Navier-Stokes equations. In case of turbulent flow, v may be replaced
by the effective viscosity. The velocity and pressure fields for the
interior region are calculated using these three governing equations
and the finitedifference technique.
51
Surface Region Flow Behavior
In the surface region, the momentum balance principle, and thus Eqs
above, still applies. However, Eq
is not valid because the mass within the cells of the surface region is
changing. Instead, the surface region contains the interface
between the molten metal and the atmosphere surrounding it, and
free surface boundary conditions should be obeyed. This means
that :Tangential Stress on the Free Surface Should Vanish. This
may be expressed by:
where nx, ny, mx, my are the x and y components of the unit vectors
normal to and tangent to the free surface.
52
Orientation of the free surface
represented in Eq above.
Normal Stress Should Balance the
Applied Pressure Plus the Surface
Tension. This may be expressed
by:
where pa is the applied gas
pressure in the empty region and
ps is the surface tension pressure.
The flow field in the
surface region is calculated using
these principles
53
Fluid Flow Phenomena in the Filling of Metal Castings
Fluid flow calculations can help gain an understanding of flow
phenomena occurring during mold filling . To illustrate this, the results
of MAC calculations applied to some simple mold designs are
presented below. All of the designs have thin cross sections so that the
metal flow is restricted to two dimensions. (Although the MAC
technique can be applied to three dimensions, it requires a lot of
computer time, so most of the computations of metal flow have been
done in two dimensions.)
Example 1: Filling of a Large, Horizontal Square Plate Casting.
The first case is a horizontal square plate 610 × 610 mm (2 × 2 ft), with a 122 mm (0.4
ft) wide ingate at the center of the left wall, through which metal enters at 305 mm/s
(1 ft/s). The mold fills in 10 s. For numerical analysis, the casting was divided into
400 square cells (20 in each direction). Results of the computation (Fig. below) show
that as the metal enters the mold, the stream expands slightly before reaching the far
wall. Upon reaching the wall, the stream splits in two, building up along the far side of
the cavity and then reflecting back toward the ingate. The two vortices that form, one
on either side of the gate, are the last regions to fill, and any gases in the mold are
squeezed to these areas near the end of the filling process.
54
Vector plot showing flow patterns and velocity profiles obtained
when filling a horizontal 610 × 610 mm (2 × 2 ft) square plate
casting. Entrance velocity was 305 mm/s (1 ft/s), and vector plots
shown are at elapsed times. (a) 3.95 s. (b) 5.45 s. (c) 9.95 s.
55
Example 2: Filling of a Small, Horizontal Square Plate Casting.
The second casting is similar but smaller, and it demonstrates the
effect of size (and/or relative entrance velocity) on the flow pattern
(Fig. below). The cavity is 61.0 × 61.0 mm (0.2 × 0.2 ft) with an
ingate 12.2 mm (0.04 ft) wide. The entrance velocity, again, is 305
mm/s (1 ft/s), so it fills in 1.0 s. For computation, the system is
divided into 400 cells. The flow pattern is quite different. Metal
enters the mold like a jet, hitting the opposite wall before spreading.
When the jet hits the wall, it flows rapidly outward in two
symmetrical streams that cling much closer to the wall than in the
previous case.
These streams race back against the side walls, then along the ingate
wall, where they encounter the incoming jet. In contrast to Example
1, the last areas to fill are much farther from the ingate, and the
vortices, one on either side of the centerline, are somewhat larger.
Also, the calculations show that the initial momentum is directed at a
small area of the opposite wall, resulting in high pressures and the
56
Vector plot showing flow patterns and velocity profiles obtained when filling a horizontal
61.0 × 61.0 mm (0.2 × 0.2 ft) square plate casting. Entrance velocity was 305 mm/s (1 ft/s),
and vector plots are shown at elapsed times. (a) 0.299 s. (b) 0.599 s. (c) 0.879 s. 57
Example 3: Filling of a Vertical Square Plate Casting to Illustrate the Effect of
Gravity on Flow Pattern.
The third design demonstrates the capability of the model to include the influence of
gravity, or other body forces. It is a vertical square plate 152 × 152 mm (0.5 × 0.5 ft)
with a 38.1 mm (0.125 ft) wide ingate located at the lower left corner. The velocity
varies from 975 mm/s (3.2 ft/s) to 518 mm/s (1.7 ft/s), depending on the metal level
and gas pressure in the mold. The entrance velocity is determined by coupling a
Bernoulli equation calculation for flow through the filling system with the MAC
calculation for flow within the mold. This casting also was divided into 400 equal-
size square cells for computation. The results of the simulations (Fig.) show the melt
enters as a bore with a sloping top surface. When it hits the opposite wall, it jumps up
the wall about 0.8 of the distance to the top, rolling back over on the incoming stream
and forming a strong vortex. Then it jumps up the wall above the ingate, and a wave
works its way from side to side. The last area to fill is the top left corner. This flow
behavior has been verified by high-speed movies of a water model, some frames of
which are shown in Fig.. An actual casting of Al-7.5Si alloy made in a sand mold of
this design showed low density in the area where the vortex was last located and
entrapped gas porosity in the last area to fill. A photograph and a radiograph of this
casting are shown in Fig. 14
58
Vector plot showing flow patterns and velocity profiles obtained when filling a
vertical 152 × 152 mm(0.5 × 0.5 ft) square plate casting. Entrance velocity is determined by
Bernoulli equation calculation and varies from 975 mm/s (3.2 ft/s) to 518 mm/s (1.7 ft/s). Plots
are shown at elapsed time. (a) 0.10 s. (b) 0.32 s. (c) 0.42 s. (d) 0.62 s. (e) 0.76 s.
59
Tracings of still photographs from a high-speed motion picture of a
water model of the vertical 152 ×152 mm (0.5 × 0.5 ft) square plate
casting calculated in Fig. above. (a) 0.10 s. (b) 0.30 s. (c) 0.45 s. (d)
0.65 s.(e) 0.90 s. 60
Photograph (a) and radiograph (b) of an Al-7.5Si alloy casting
produced in a vertical square plate mold identical to that used to
obtain Figs. above data. The radiograph shows a large accumulation
of gas bubbles in the last area to be filled by the alloy.
61
Filling of a Vertical Stepped Plate Casting.
The design and dimensions of a somewhat more complicated mold are
shown in Fig. . It is a plate casting with steps on the bottom. The
entrance velocity starts at 975 mm/s (3.2 ft/s) and gradually decreases
as the level of molten metal and the gas pressure build up in the mold.
The calculated results shown in Fig. indicate that the metal forms a
vortex beneath the ingate (which is located above the bottom in this
case) and standing waves above each of the steps. Before the flow
reaches the far end of the mold, metal begins to rise in the vertical
section (which represents a riser), and another vortex forms in this
region. This flow pattern has been verified by high-speed movies of a
water model.
62
Configuration and dimensions of a vertical stepped plate mold.
Dimensions given in inches
63
Vector plot showing flow patterns and velocity profiles of a vertical stepped plate
casting produced by using the mold illustrated in Fig. above . The initial entrance
velocity was 975 mm/s (3.2 ft/s), and the plot is shown at elapsed times. (a) 0.27 s.
(b) 0.39 s. (c) 0.72 s. (d) 1.47 s. (e) 1.80 s.
64
• The MAC technique can be applied to flow through the filling system as well as in
the mold cavity. Figure below shows flow in such a system and demonstrates the
undesirable condition in which the descending metal pulls away from the walls of an
untapered sprue. Some detailed studies of flow in the sprue and runner have been
made using the SOLA-VOF version of these techniques .
Geometry, dimensions, and vector plots (showing flow patterns and velocity profiles) of
the filling system attached to the vertical 152 × 152 mm (6 × 6 in.) The vector plot is
shown at elapsed times. (a) 0.0 s. (b) 0.290 s. (c) 0.570 s. Dimensions given in inches.
65
• Correlations With Actual Metal Flow
• Correlations of calculated flow with observations of actual metal
flow are shown in Figs. below (the flow of cast iron into silicate-
bonded sand molds was recorded by a high-speed motion picture
camera through a glass window on the side of the mold) . The
casting is a three-spoke wheel. In one of the configurations, the
metal enters through a gate at the top, and the gate is positioned
midway between two spokes (Fig. ). In the other, the gate is at the
bottom directly opposite a spoke (Fig. ). The results, calculated
using a modified SOLA-VOF technique, are shown. The agreement
• between the observed patterns and the calculated ones is very good,
particularly in the way in which the metal misses the diagonal
spokes in the top-gated castings and pours around the rim until
filling is about two-thirds complete. It can clearly be seen from these
experiments that the bottom-gated casting fills more smoothly and
uniformly and probably results in a better-quality casting.
66
Calculated flow patterns, (a) to (f), and comparable high-speed motion picture frame
tracings, (g) to (l), of molten cast iron entering a top-gated sand mold to produce a
three-spoke wheel. Elapsed times for the calculated patterns. (a) 0.250 s. (b) 0.600 s.
(c) 0.900 s. (d) 1.600 s. (e) 2.650 s. (f) 3.000 s.
67
Calculated flow patterns, (a) to (f), and comparable high-speed motion picture frame
tracings, (g) to (l), of molten cast iron entering a bottom-gated sand mold to produce a
three-spoke wheel. Elapsed times for the calculated patterns. (a) 0.100 s. (b) 0.200 s. (c)
0.500 s. (d) 1.000 s. (e) 2.200 s. (f) 2.900 s. 68
• Figure below shows the solidification pattern that occurs in the
bottom-gated casting 36 s after the start of the pour. The residual
influence of the entering stream of hot metal is shown by the molten
state of the bottom spoke after the two upper spokes have solidified.
These calculations were done by a program that uses SOLA-VOF to
calculate fluid flow and couples it with a finite-difference heat
transfer program to calculate temperature distributions. This is
particularly useful in modeling thin castings, in which solidification
may begin before the mold is completely filled.
Calculated solidification pattern in the bottom-gated three-spoke wheel casting in
Fig. above after an elapsed time of 36.192 s. Fraction solid is greater than 0.5 in
shaded area and less than 0.5 in unshaded area to show the residual effect of fresh
hot metal flow through the bottom spoke throughout the filling period
69
Modeling of Combined Fluid Flow and
Heat/Mass Transfer
• Introduction
• FLUID FLOW AND HEAT/MASS TRANSFER principles are
increasingly gaining acceptance as a means of improving the quality
and yield of castings. The benefits to be derived from adopting such
an approach range from slag- and dross free gating system design to
a desired microstructure of the finished product. In general, the
transport of heat, mass, and momentum during solidification
processing controls such varied phenomena as solute macro
segregation, distribution of voids and porosity, shrinkage effects,
and overall solidification time. These parameters, in turn, result in a
variation of the mechanical, thermophysical, and electrical
properties of the solidified product.
70
Cont’d
• The complex nature of the coupling between heat and mass transport
with fluid flow during solidification necessitates a fundamental
understanding of the processes and the mechanisms of interaction in
relation to empirical formulas and charts. Heat transfer by forced
convection predominates during the filling stages. Once the mold
cavity is filled, buoyancy-generated natural convective heat and mass
transfer occur before the phase change .
• The principles of heat transfer by forced convection are shown
schematically in Fig. 1, which is a representation of flowing metal at a
superheated pouring temperature T01 and a velocity u advancing into
a mold channel of width 2d and length L, initially at an ambient
temperature T02. Stage 1 shows the channel just before the liquid
metal enters. Stages 2 and 3 show the liquid region R1 occupying half
and almost full lengths of the channel, respectively. The temperature
at the liquid metal/mold wall interface keeps evolving as the flowing
metal front advances into the channel. The portion of the mold wall
not yet covered by the flowing metal remains at a considerably lower
temperature. Stage 4 shows the completely filled channel with
conventional steady flow and heat transfer processes.
71
Filling stages in an empty channel. See the corresponding text for a
description of Stages 1 through 4. 72
• Subsequent stages during the solidification of a binary alloy involve
both phase change heat and mass transfer as well as buoyant
thermo-solutal convection .
• Figure 2 shows a schematic representation of the stages in the
solidification of a binary alloy. Solidification begins with cooling
across boundary BII between the liquid metal region RIV and the
mold region RI, together with cooling at boundary BI between the
mold and the ambient (Fig. 2a). Next, the solid/liquid mushy region
RIII evolves between boundary BII with the mold and BIV with the
liquid metal (Fig. 2b). Further cooling leads to a typical steady-state
picture showing a solidified crust region RII with boundaries BII
and BIII with the mold and the mush, respectively, and the mushy
region RIII with boundaries BIII and BIV with the crust and the
liquid, respectively (Fig. 2c). The final transient stage shows the
depletion of the all-liquid region RIV (Fig. 2d).
73
Stages in binary alloy solidification. (a) All liquid. (b) Initial transient.
(c) Steady state. (d) Final transient. See the corresponding text for details
74
Heat Loss During Filling
• Pioneering work on heat loss from the flowing metal to the sand mold
runners consisted of obtaining plots of temperature loss versus time, with the
ratio of surface area to flow rate used as a parameter . Assuming
instantaneous filling and negligible contact resistance between the sand mold
and the flowing metal, this method gives good results. A modified version of
the method, intended for a constant or linearly decreasing average velocity
of the molten metal, indicates that the temperature loss in the runner
decreases with time and is proportional to the residence time of the fluid
element in the runner . These results can be used to calculate temperature
loss for a variety of runner lengths, flow rates, runner diameters, pouring
temperatures, and sand mold thermal properties. However, the results are not
accurate for metallic molds, nor for very short times after pouring.
• Based on more detailed mathematical models of the transient filling process,
finite-element solutions for the mold/metal interface temperature for very
short times after pouring have been developed . Typical results of such
calculations for a horizontal runner channel are shown in Fig. 3. In this case,
the maximum temperature difference in the system, that is, the difference
between the pouring temperature and the initial mold temperature, is
represented by T01 - T02.
75
Cont’d
• Figure 3 shows that the instantaneous filling assumption (open
triangles) yields a midchannel value of wall temperature at a time
of 0.1 s after pouring as [T01 - 0.96(T01 - T02)], while the
corrected value after accounting for the fluid flow (convection)
effects during filling (closed circles) is [T01 - 0.64(T01 - T02)].
Although this may indicate an instantaneous freezing, the
subsequent flow of superheated metal causes remelting. The
temperature profiles across the channel at various times are shown
in Fig. 4. Similar calculations have been performed for the vertical
gating sprue for a variety of geometries (lengths, tapers, and
diameters), flow rates, pouring temperatures, and properties of the
melt and the sand mold .
• The competing effects of conduction heat transfer to the mold and
convection due to the flow determine the interface temperature. In
other words, both the thermal conductivity of the sand and the
thermal capacity of the flow are important.
76
Interface temperature distribution in a filling channel
77
Cont’d
Transient temperature profiles across filling channel
78
• Postfilling Buoyant Convection
• The loss of liquid metal superheat in the casting cavity of the mold
after the filling transients have died out occurs by buoyancy-generated
convection currents. These currents tend to redistribute the melt
temperature and composition until solidification begins. Subsequent
solidification sequences also involves heat loss by thermosolutal
buoyant convection during the phase change. Figure 7(a) shows
patterns of calculated convection currents in a pure melt for a vertical
rectangular cavity. The indicated Rayleigh number in Fig. 7(a)
characterizes the strength of the buoyant transport in relation to that
by pure diffusion. Although miniscule in comparison with the patterns
of flow during filling, these currents significantly shift the hot metal to
the top and then redistribute the thermal state of the melt before
solidification begins. A typical upward shift of the hot isotherm is
shown in Fig. 7(b). Any subsequent simulation of the solidification
sequence must account for this initial temperature distribution within
the cavity.
79
Final steam function distribution in cavity filled with liquid copper. Cavity aspect
ratio is 2, and the Rayleigh number of the process is 7000. Only the left half of the
two symmetric halves of the cavity is shown.
Moving horizontally to the right from center of the illustration to the centerline of
the cavity, the distance between the adjacent stream lines decreases, indicating
faster upward flow between adjacent stream lines. The centerline forms an
insulating boundary between the two symmetric halves of the cavity.
80
Final temperature distribution in cavity filled with liquid copper. Cavity aspect ratio
is 2, and the Rayleigh number of the process is 7000. Only the left half of the two
symmetric halves of the cavity is shown.
The curve labeled 0.44 is the hottest of the isotherms shown. Its temperature excess
over the solidification temperature equals 44% of the maximum temperature
difference that existed between the super-heated liquid and the solidification
temperature at the start of the natural convection process in the cavity.
81
Cont’d
-In the case of alloy melts, the difference in atomic weight of the constituent
metals causes an additional convection pattern. The temperature and
solute redistributions due to buoyant thermal convection occur in a
coupled fashion, each driving and being driven by the other. Both the
scale of the convective motion and the time during the solidification
sequence when buoyant convection becomes significant must be
determined to identify the process parameters governing subsequent
microstructural behavior;
• -Mathematical models of the buoyant transport processes during binary
alloy solidification can be examined to obtain the applicable time, length,
and motion scales for the liquid, the solid, and the mushy zones depicted.
Of these, the most crucial issue from the metallurgical viewpoint is the
evolution of the mushy zone and the factors that govern it;
• The mushy zone in a tall vertical sample casting (Fig. 8a) is viewed as a
forest of dendrites submerged in a melt pool and is characterized by a
field distribution of the solidified mass fraction Φ ;
• The solid-liquid mixture under local thermodynamic phaseequilibrium is
in turn characterized by the pressure, the temperature, and the average
mixture composition. The lever rule then yields the local liquid and solid
concentrations.
82
Cont’d
• The buoyant flow can be driven by heat or mass transfer,depending
on the magnitude of the buoyancy parameter N:
where βC is the fractional change in density due to concentration
changes and βT is the fractional change in density due to temperature
changes. However, for most cases of binary alloy solidification of
practical interest, the buoyant current is mass transfer driven;
- The boundary layer provides concentration, temperature, and
velocity in a mass transfer driven flow for the tall, vertical casting, as
shown in Fig. 8(b) and 8(c). In the boundary layer regime, the orders
of magnitude x, y, ΔT, and ΔC can be represented as:
where the subscripts 0, c, and e are the initial, liquidus, and eutectic
states, respectively 83
Solidification of a tall, vertical casting. (a) Stages of a solidifying
alloy. (b) Evolution of boundary layer in the mushy zone. (c)
Boundary layer concentration, velocity, and temperature profiles 84
Cont’d
• For short times after solidification begins, all transport processes
are diffusive, until a time tf, when convection overtakes
diffusion. A scale analysis of the mixture equations for the
balance of mass, species, and vorticity yields order of magnitude
of this time (the end of initial diffusion transport period) as:
where B is the semi-width of the casting, D is the mass diffusivity of
the alloy mixture, and RSB is the solutal Rayleigh number, which is
defined as:
where ν is the kinematic viscosity and g is the acceleration due to gravity.
The order of magnitude of the concentration boundary layer thickness at
this time is given as: 85
Cont’d
• and the steady-state mass transfer rate in the mushy zone is estimated
from the Sherwood number, Sh, as:
The corresponding values for the thermal boundary layer thickness and
the Nusselt number for heat transfer rate calculations in the mushy zone
can be obtained by a similar scale analysis of the thermal energy
equation and the vorticity transport equation. Detailed computations for
the actual values for alloy solidification are being performed and are
expected to appear in the open literature in the near future.
86
Modeling of Microstructural Evolution
• THE MODELING OF SOLIDIFICATION of castings has
received increased attention as the computer revolution has
matured. The main application of this technique has traditionally
been calculation of the path of the isotherms (lines of constant
temperature) through shaped castings. In turn, this was used to
predict the locations of hot spots in castings and thus to check,
using the computer, a proposed gating and risering system, rather
than following the classical trial-and error technique used in
foundries.
• Macroscopic Modeling
• Solidification of alloys is primarily controlled by heat diffusion
and to some extent by convection within the liquid region;
• In most approaches to the solidification modeling of complex-
shaped castings, the continuity equation of motion is not solved
explicitly. Instead, correction is taken into account by increasing
the heat conductivity above the melting point or the liquidus
temperature. Under this assumption, the basic continuity equation
governing solidification at the macroscopic scale is that of
conservation of energy:
87
Cont’d
where T( xr,t) is the temperature field, k(T) is the thermal
conductivity, ρCp(T) is the volumetric specific heat, and Q is the
source term associated with the phase change. In solidification
modeling, Q can be written as:
where fs( x r,t) is the solid fraction and L is the volumetric latent heat.
To solve Eq 1, a relationship between the fields T( xr,t) and fs( xr,t) must
be found. A simple and widely used approach is to assume that the
fraction of solid fs depends only on the temperature T and not upon
cooling rate or growth rate. For pure metals or eutectic alloys, one can
assume that fs = 0 above the melting point or the eutectic temperature
and that fs = 1 below the equilibrium temperature. For dendritic alloys,
various models of solute diffusion have been developed . They all
assume complete mixing of solute within the liquid, thus resulting in a
unique fs(T) curve.
88
Cont’d
• Assuming that fs depends only on T, Eq 1 and 2 can be combined to
give:
defining enthalpy H as:
Equation 3 can also be written as:
This is known as the enthalpy method.
An effective specific heat, ρC*p, can be derived from Eq 4
which, when introduced in Eq 3, gives:
This is known as the specific
heat method.
89
Cont’d
-The curves H(T) and ρC*p(T) can be calculated by various methods, for
example, using a Brody-Flemings model of solute diffusion . Both
methods can be used in macro-micro modeling. Other techniques,
such as the latent heat method or the micro-enthalpy method , have
been specifically developed for macro-micro modeling.
-Modeling of Columnar Structures
-The macroscopic approach described briefly in the previous section can
be reasonably applied to columnar solidification because the growth
rate of the microstructure (eutectic front or dendrite tips) is more or
less equal to the speed at which the corresponding isotherms move
(eutectic or liquidus isolines). Therefore, microstructural parameters
and undercooling can be directly calculated from the temperature field
in this case.
-Columnar growth morphologies are encountered in both dendritic and
eutectic alloys . Solidification occurs in a columnar fashion when the
growth speed of the dendrite tip or the eutectic front vs is directly
related to the speed vm of the isotherms calculated from a
macroscopic approach (Fig. 1). It is therefore necessary to have a
positive thermal gradient G at the solid/liquid interface. However, this
condition is not sufficient to ensure the formation of columnar
structures .
90
Schematic of columnar and equiaxed growth of dendritic and eutectic
alloys in a thermal gradient G
91
Cont’d
• The competition between columnar and equiaxed morphologies, in
particular the columnar-to-equiaxed transition, in a given
macroscopic thermal environment, one can calculate:
• The undercooling ΔTC associated with the formation of a columnar
structure;
• The nucleation undercooling ΔTN at which nuclei are formed
within the melt;
• The undercooling ΔTE required to drive equiaxed solidification;
• Under steady-state growth conditions and considering these three
undercoolings, a simple criterion to obtain a fully columnar
structure can be defined by:
where N0 is the density of grains nucleated at the undercooling ΔTN,
and A is a constant.
92
Cont’d
• Assuming that the thermal gradient G is large enough to ensure that a
columnar structure is produced, microstructure formation theories can
be easily implemented into macroscopic heat flow calculations if one
makes the following hypotheses:
· The kinetics of the eutectic front or the dendrite tip are given by the
steady-state growth analysis;
· The velocity of the microstructure vs is related to the velocity vm of the
corresponding equilibrium isotherm, as shown in Fig. 2
• In Fig. 2, four different microstructures frequently encountered in
solidification are shown: regular and irregular eutectics and cellular
and dendritic morphologies. In the first three cases, one has simply:
• vs = vm
93
Relationship between growth velocity of the macroscopic isotherms vm
and growth velocity vs of four different columnar microstructures. (a)
and (b) Regular and irregular eutectics, respectively. (c) Cells.
(d)Dendrites 94
Cont’d
• For dendritic alloys, the velocity of the dendrite tip is essentially
dictated by the trunk orientation, which is imposed more or less by
the crystallographic orientation of the solid (for example, <100> for
cubic metals). If α is the angle between the trunk orientation and the
heat flow direction, then:
In castings, grain selection will occur such that those grains whose
angle α is close to zero will grow preferentially. However, dendritic
single-crystal growth or epitaxial dendritic growth from single-
crystal substrates can be characterized by an α value that can
deviate substantially from zero.
Based on the two hypotheses mentioned previously, the kinetics of
microstructure formation can be implemented into macroscopic heat
flow calculations according to the following simple scheme. One
first calculates the temperature field evolution without taking into
account any undercooling . 95
Cont’d
• Once the temperature field is known, the velocity of the corresponding
isotherms (liquidus or eutectic temperature) can be deduced as well a
the thermal gradient at the interface. From these values, th
undercooling of the columnar microstructure and the associated
parameters of the microstructure (eutectic or dendrite trunk spacings
can be calculated using recent theories of microstructure formation;
• Two researchers have achieved a real coupling between dendriti
microstructure formation theory and one-dimensional nonstationary hea
flow calculations in the case of spot laser remelting of material surface
). In particular, they have developed a model of solid fraction that take
into account the large undercooling experienced by the dendrite tip
under rapid solidification conditions. They have shown that even unde
such circumstances the results predicted by this detailed approach do
not differ significantly from the simplest model that neglects th
undercooling at the macroscopic scale;
• This last approach has been applied to the laser treatment of material
surfaces to predict the lamellar spacings of a eutectic aluminum-coppe
alloy from the calculated stationary shape of the liquid pool (Fig. 3).
-More recently, this approach has been used to analyze dendriti
microstructures produced in electron beam welding of stainless stee
96
Cont’d
It was shown, from the macroscopic shape of the liquid pool, that a
simple criterion of minimum undercooling, that is, of minimum
speed, can be applied to determine which dendrite trunk orientation
is selected.
97
Calculated stationary shape (a) of the liquid pool that forms during laser treatment of an
aluminumcopper eutectic alloy surface. The laser, with 1500 W of total power focused
onto a spot 0.2 mm (0.008 in.) in diameter, is moving to the right with a velocity vb of 1
m/s (3.2 ft/s). Absorption coefficient is 0.15. Although the calculation was made in three
dimensions, only the resolidifying back part of the pool within a longitudinal section is
shown. (b) Lamellar spacing of the aluminum-copper eutectic alloy versus depth of the
laser-treated surface as calculated from the shape of the liquid pool (a) and using the
recent theory of eutectic formation.
98
Transverse section micrograph (a) of electron beam weld of an Fe-15Ni-15Cr single
crystal. The electron beam was moved at a velocity of 3 mm/s (0.12 in./s) over the (001)
surface along a [100] crystallographic orientation. The dendrites epitaxially grown at
the monocrystalline surface of the weld can have their trunksaligned along one of the
three <100> orientations. Microstructure selection is made according to a criterion of
minimum undercooling (or of minimum speed); therefore, the information in this
micrograph can be used to reconstruct the three-dimensional shape of the weld pool, as
shown in (b)
99
Modeling of Equiaxed Structures
When dealing with equiaxed microstructures, the growth speed of the
grains is no longer related to the speed of the isotherms, but rather to
local undercooling (Fig. 1). Furthermore, the solidification path is also
dependent on the number of grains that have been nucleated within the
undercooled melt. In such a case, the approach used must relate the
fraction that has solidified to the local undercooling.
Microscopic Modeling of Equiaxed Structures
Consider a small volume element V of uniform temperature T, within
which equiaxed solidification (Fig. 5) is proceeding. At a given time t,
the fraction of solid fs(t) is given by
where n(t) is the density of the grains, R(t) is the average equiaxed grain
radius characterizing the position of the dendrite tips or that of the
eutectic front, and fi(t) is the internal fraction of solid. For eutectics, the
grains are fully solid, and accordingly fi(t) = 1 at any time. For dendritic
alloys, fi(t) represents the fraction of the grains that is really solid. 100
Schematic showing equiaxed dendritic and eutectic solidification
To predict the evolution of the solid fraction fs(t), one must relate the
three variables n(t), R(t), and fi(t) to the undercooling ΔT. This can be
done by considering nucleation kinetics, growth kinetics, and, for
dendrites, solute diffusion.
Nucleation Kinetics. The rate n (t) at which new grains are heterogeneously
nucleated within the liquid can be given at low undercooling by
101
Cont’d
• where K1 is proportional to a collision frequency with nucleation
sites, n0 is the total number of sites present in the melt before
solidification, and K2 is a constant related to the interfacial energy
between substrate and nucleated grain. The constants K1, n0 and
K2 must be deduced from experiment. Once they are known, the
grain density n(t) can be predicted at each time by integrating Eq
11 over time or temperature:
However, this approach fails to predict the correct grain density, in part
because the temperature interval within which nucleation proceeds is
very narrow. For an undercooling ΔT smaller than a critical value, ΔTN
= 2 k , there is no significant nucleation. When ΔTN is reached, n(t)
increases very rapidly to its saturation limit n0 (Fig. 6 and 7).
Therefore, it is suggested to replace the complex nucleation law of Eq
11 by a Dirac function in solidification modeling: 102
If more than one type of nucleation site is present, one can introduce a
set of Dirac functions (Fig. 6):
This discrete distribution of nucleation site types can also be replaced
by a continuous distribution (Fig. 8). Although this last approach may
not reflect the complex phenomena of heterogeneous nucleation, it
has some advantages in microscopic modeling of solidification.
103
Schematic of heterogeneous nucleation
occurring on a family of inoculant sites,
characterized by a density of sites n0,i and by a
critical temperature TN,i at which nucleation
occurs
Calculated relationship between
nucleation rate and undercooling in cost
iron.
104
Continuous distribution of nucleation site types.
In fact, a continuous distribution of nucleation site types can be replaced by a very
narrow distribution if one only wants to simulate heterogeneous nucleation occurring at a
given undercooling ΔTN with a given density of sites n0 (Eq 13). This last approach can
be used for eutectic solidification based on the fact that, the nucleation interval is very
narrow. For example, for cast iron, the nucleation interval was calculated to be about 0.1
°C (0.2 °F) .
105

More Related Content

Similar to ch-9.pptx

Software packages for foundry use
Software packages for foundry useSoftware packages for foundry use
Software packages for foundry useAKSHANSH MISHRA
 
Paper id 28201443
Paper id 28201443Paper id 28201443
Paper id 28201443IJRAT
 
Simulation of Deep-Drawing Process of Large Panels
Simulation of Deep-Drawing Process of Large PanelsSimulation of Deep-Drawing Process of Large Panels
Simulation of Deep-Drawing Process of Large Panelstheijes
 
Shaped Metal deposition Based on Additive Manufacturing
 Shaped Metal deposition Based on Additive Manufacturing Shaped Metal deposition Based on Additive Manufacturing
Shaped Metal deposition Based on Additive ManufacturingHassan Alwaely
 
M tech 1 2 cad cam
M tech 1 2 cad camM tech 1 2 cad cam
M tech 1 2 cad camAKRAMTARIQ2
 
Cad cam in prosthodontics
Cad cam in prosthodonticsCad cam in prosthodontics
Cad cam in prosthodonticsPriyam Javed
 
Towards smart and sustainable machining
Towards smart and sustainable machiningTowards smart and sustainable machining
Towards smart and sustainable machiningLiu PeiLing
 
Analysis and design of ship structure
Analysis and design of ship structureAnalysis and design of ship structure
Analysis and design of ship structureCormak2010
 
Elements CAE white paper
Elements CAE white paperElements CAE white paper
Elements CAE white paperAngus Lock
 
187186134 5-geometric-modeling
187186134 5-geometric-modeling187186134 5-geometric-modeling
187186134 5-geometric-modelingmanojg1990
 
187186134 5-geometric-modeling
187186134 5-geometric-modeling187186134 5-geometric-modeling
187186134 5-geometric-modelingmanojg1990
 
5 geometric-modeling-ppt-university-of-victoria
5 geometric-modeling-ppt-university-of-victoria5 geometric-modeling-ppt-university-of-victoria
5 geometric-modeling-ppt-university-of-victoriaRaghu Gadde
 
CFD Analysis of ATGM Configurations -- Zeus Numerix
CFD Analysis of ATGM Configurations --  Zeus NumerixCFD Analysis of ATGM Configurations --  Zeus Numerix
CFD Analysis of ATGM Configurations -- Zeus NumerixAbhishek Jain
 
ST Blade Rev Eng_Electric_Power_11
ST Blade Rev Eng_Electric_Power_11ST Blade Rev Eng_Electric_Power_11
ST Blade Rev Eng_Electric_Power_11Eugene Chisely
 
Towards smart and competitive sustainable machining
Towards smart and competitive sustainable machiningTowards smart and competitive sustainable machining
Towards smart and competitive sustainable machiningLiu PeiLing
 

Similar to ch-9.pptx (20)

Rapid prototyping
Rapid prototypingRapid prototyping
Rapid prototyping
 
Software packages for foundry use
Software packages for foundry useSoftware packages for foundry use
Software packages for foundry use
 
Portfolio_new
Portfolio_newPortfolio_new
Portfolio_new
 
Paper id 28201443
Paper id 28201443Paper id 28201443
Paper id 28201443
 
Simulation of Deep-Drawing Process of Large Panels
Simulation of Deep-Drawing Process of Large PanelsSimulation of Deep-Drawing Process of Large Panels
Simulation of Deep-Drawing Process of Large Panels
 
Shaped Metal deposition Based on Additive Manufacturing
 Shaped Metal deposition Based on Additive Manufacturing Shaped Metal deposition Based on Additive Manufacturing
Shaped Metal deposition Based on Additive Manufacturing
 
M tech 1 2 cad cam
M tech 1 2 cad camM tech 1 2 cad cam
M tech 1 2 cad cam
 
Cad cam in prosthodontics
Cad cam in prosthodonticsCad cam in prosthodontics
Cad cam in prosthodontics
 
Rp
RpRp
Rp
 
Towards smart and sustainable machining
Towards smart and sustainable machiningTowards smart and sustainable machining
Towards smart and sustainable machining
 
report rp
report rp report rp
report rp
 
Analysis and design of ship structure
Analysis and design of ship structureAnalysis and design of ship structure
Analysis and design of ship structure
 
Elements CAE white paper
Elements CAE white paperElements CAE white paper
Elements CAE white paper
 
187186134 5-geometric-modeling
187186134 5-geometric-modeling187186134 5-geometric-modeling
187186134 5-geometric-modeling
 
187186134 5-geometric-modeling
187186134 5-geometric-modeling187186134 5-geometric-modeling
187186134 5-geometric-modeling
 
5 geometric modeling
5 geometric modeling5 geometric modeling
5 geometric modeling
 
5 geometric-modeling-ppt-university-of-victoria
5 geometric-modeling-ppt-university-of-victoria5 geometric-modeling-ppt-university-of-victoria
5 geometric-modeling-ppt-university-of-victoria
 
CFD Analysis of ATGM Configurations -- Zeus Numerix
CFD Analysis of ATGM Configurations --  Zeus NumerixCFD Analysis of ATGM Configurations --  Zeus Numerix
CFD Analysis of ATGM Configurations -- Zeus Numerix
 
ST Blade Rev Eng_Electric_Power_11
ST Blade Rev Eng_Electric_Power_11ST Blade Rev Eng_Electric_Power_11
ST Blade Rev Eng_Electric_Power_11
 
Towards smart and competitive sustainable machining
Towards smart and competitive sustainable machiningTowards smart and competitive sustainable machining
Towards smart and competitive sustainable machining
 

Recently uploaded

High Profile Call Girls Dahisar Arpita 9907093804 Independent Escort Service ...
High Profile Call Girls Dahisar Arpita 9907093804 Independent Escort Service ...High Profile Call Girls Dahisar Arpita 9907093804 Independent Escort Service ...
High Profile Call Girls Dahisar Arpita 9907093804 Independent Escort Service ...Call girls in Ahmedabad High profile
 
UNIT-V FMM.HYDRAULIC TURBINE - Construction and working
UNIT-V FMM.HYDRAULIC TURBINE - Construction and workingUNIT-V FMM.HYDRAULIC TURBINE - Construction and working
UNIT-V FMM.HYDRAULIC TURBINE - Construction and workingrknatarajan
 
Introduction to Multiple Access Protocol.pptx
Introduction to Multiple Access Protocol.pptxIntroduction to Multiple Access Protocol.pptx
Introduction to Multiple Access Protocol.pptxupamatechverse
 
(ANJALI) Dange Chowk Call Girls Just Call 7001035870 [ Cash on Delivery ] Pun...
(ANJALI) Dange Chowk Call Girls Just Call 7001035870 [ Cash on Delivery ] Pun...(ANJALI) Dange Chowk Call Girls Just Call 7001035870 [ Cash on Delivery ] Pun...
(ANJALI) Dange Chowk Call Girls Just Call 7001035870 [ Cash on Delivery ] Pun...ranjana rawat
 
Call Girls Service Nashik Vaishnavi 7001305949 Independent Escort Service Nashik
Call Girls Service Nashik Vaishnavi 7001305949 Independent Escort Service NashikCall Girls Service Nashik Vaishnavi 7001305949 Independent Escort Service Nashik
Call Girls Service Nashik Vaishnavi 7001305949 Independent Escort Service NashikCall Girls in Nagpur High Profile
 
OSVC_Meta-Data based Simulation Automation to overcome Verification Challenge...
OSVC_Meta-Data based Simulation Automation to overcome Verification Challenge...OSVC_Meta-Data based Simulation Automation to overcome Verification Challenge...
OSVC_Meta-Data based Simulation Automation to overcome Verification Challenge...Soham Mondal
 
(SHREYA) Chakan Call Girls Just Call 7001035870 [ Cash on Delivery ] Pune Esc...
(SHREYA) Chakan Call Girls Just Call 7001035870 [ Cash on Delivery ] Pune Esc...(SHREYA) Chakan Call Girls Just Call 7001035870 [ Cash on Delivery ] Pune Esc...
(SHREYA) Chakan Call Girls Just Call 7001035870 [ Cash on Delivery ] Pune Esc...ranjana rawat
 
College Call Girls Nashik Nehal 7001305949 Independent Escort Service Nashik
College Call Girls Nashik Nehal 7001305949 Independent Escort Service NashikCollege Call Girls Nashik Nehal 7001305949 Independent Escort Service Nashik
College Call Girls Nashik Nehal 7001305949 Independent Escort Service NashikCall Girls in Nagpur High Profile
 
Software Development Life Cycle By Team Orange (Dept. of Pharmacy)
Software Development Life Cycle By  Team Orange (Dept. of Pharmacy)Software Development Life Cycle By  Team Orange (Dept. of Pharmacy)
Software Development Life Cycle By Team Orange (Dept. of Pharmacy)Suman Mia
 
(RIA) Call Girls Bhosari ( 7001035870 ) HI-Fi Pune Escorts Service
(RIA) Call Girls Bhosari ( 7001035870 ) HI-Fi Pune Escorts Service(RIA) Call Girls Bhosari ( 7001035870 ) HI-Fi Pune Escorts Service
(RIA) Call Girls Bhosari ( 7001035870 ) HI-Fi Pune Escorts Serviceranjana rawat
 
High Profile Call Girls Nagpur Isha Call 7001035870 Meet With Nagpur Escorts
High Profile Call Girls Nagpur Isha Call 7001035870 Meet With Nagpur EscortsHigh Profile Call Girls Nagpur Isha Call 7001035870 Meet With Nagpur Escorts
High Profile Call Girls Nagpur Isha Call 7001035870 Meet With Nagpur Escortsranjana rawat
 
APPLICATIONS-AC/DC DRIVES-OPERATING CHARACTERISTICS
APPLICATIONS-AC/DC DRIVES-OPERATING CHARACTERISTICSAPPLICATIONS-AC/DC DRIVES-OPERATING CHARACTERISTICS
APPLICATIONS-AC/DC DRIVES-OPERATING CHARACTERISTICSKurinjimalarL3
 
Booking open Available Pune Call Girls Koregaon Park 6297143586 Call Hot Ind...
Booking open Available Pune Call Girls Koregaon Park  6297143586 Call Hot Ind...Booking open Available Pune Call Girls Koregaon Park  6297143586 Call Hot Ind...
Booking open Available Pune Call Girls Koregaon Park 6297143586 Call Hot Ind...Call Girls in Nagpur High Profile
 
VIP Call Girls Service Kondapur Hyderabad Call +91-8250192130
VIP Call Girls Service Kondapur Hyderabad Call +91-8250192130VIP Call Girls Service Kondapur Hyderabad Call +91-8250192130
VIP Call Girls Service Kondapur Hyderabad Call +91-8250192130Suhani Kapoor
 
Call Girls Service Nagpur Tanvi Call 7001035870 Meet With Nagpur Escorts
Call Girls Service Nagpur Tanvi Call 7001035870 Meet With Nagpur EscortsCall Girls Service Nagpur Tanvi Call 7001035870 Meet With Nagpur Escorts
Call Girls Service Nagpur Tanvi Call 7001035870 Meet With Nagpur EscortsCall Girls in Nagpur High Profile
 
Extrusion Processes and Their Limitations
Extrusion Processes and Their LimitationsExtrusion Processes and Their Limitations
Extrusion Processes and Their Limitations120cr0395
 
HARMONY IN THE NATURE AND EXISTENCE - Unit-IV
HARMONY IN THE NATURE AND EXISTENCE - Unit-IVHARMONY IN THE NATURE AND EXISTENCE - Unit-IV
HARMONY IN THE NATURE AND EXISTENCE - Unit-IVRajaP95
 

Recently uploaded (20)

High Profile Call Girls Dahisar Arpita 9907093804 Independent Escort Service ...
High Profile Call Girls Dahisar Arpita 9907093804 Independent Escort Service ...High Profile Call Girls Dahisar Arpita 9907093804 Independent Escort Service ...
High Profile Call Girls Dahisar Arpita 9907093804 Independent Escort Service ...
 
UNIT-V FMM.HYDRAULIC TURBINE - Construction and working
UNIT-V FMM.HYDRAULIC TURBINE - Construction and workingUNIT-V FMM.HYDRAULIC TURBINE - Construction and working
UNIT-V FMM.HYDRAULIC TURBINE - Construction and working
 
Introduction to Multiple Access Protocol.pptx
Introduction to Multiple Access Protocol.pptxIntroduction to Multiple Access Protocol.pptx
Introduction to Multiple Access Protocol.pptx
 
(ANJALI) Dange Chowk Call Girls Just Call 7001035870 [ Cash on Delivery ] Pun...
(ANJALI) Dange Chowk Call Girls Just Call 7001035870 [ Cash on Delivery ] Pun...(ANJALI) Dange Chowk Call Girls Just Call 7001035870 [ Cash on Delivery ] Pun...
(ANJALI) Dange Chowk Call Girls Just Call 7001035870 [ Cash on Delivery ] Pun...
 
Call Girls Service Nashik Vaishnavi 7001305949 Independent Escort Service Nashik
Call Girls Service Nashik Vaishnavi 7001305949 Independent Escort Service NashikCall Girls Service Nashik Vaishnavi 7001305949 Independent Escort Service Nashik
Call Girls Service Nashik Vaishnavi 7001305949 Independent Escort Service Nashik
 
OSVC_Meta-Data based Simulation Automation to overcome Verification Challenge...
OSVC_Meta-Data based Simulation Automation to overcome Verification Challenge...OSVC_Meta-Data based Simulation Automation to overcome Verification Challenge...
OSVC_Meta-Data based Simulation Automation to overcome Verification Challenge...
 
★ CALL US 9953330565 ( HOT Young Call Girls In Badarpur delhi NCR
★ CALL US 9953330565 ( HOT Young Call Girls In Badarpur delhi NCR★ CALL US 9953330565 ( HOT Young Call Girls In Badarpur delhi NCR
★ CALL US 9953330565 ( HOT Young Call Girls In Badarpur delhi NCR
 
(SHREYA) Chakan Call Girls Just Call 7001035870 [ Cash on Delivery ] Pune Esc...
(SHREYA) Chakan Call Girls Just Call 7001035870 [ Cash on Delivery ] Pune Esc...(SHREYA) Chakan Call Girls Just Call 7001035870 [ Cash on Delivery ] Pune Esc...
(SHREYA) Chakan Call Girls Just Call 7001035870 [ Cash on Delivery ] Pune Esc...
 
College Call Girls Nashik Nehal 7001305949 Independent Escort Service Nashik
College Call Girls Nashik Nehal 7001305949 Independent Escort Service NashikCollege Call Girls Nashik Nehal 7001305949 Independent Escort Service Nashik
College Call Girls Nashik Nehal 7001305949 Independent Escort Service Nashik
 
Software Development Life Cycle By Team Orange (Dept. of Pharmacy)
Software Development Life Cycle By  Team Orange (Dept. of Pharmacy)Software Development Life Cycle By  Team Orange (Dept. of Pharmacy)
Software Development Life Cycle By Team Orange (Dept. of Pharmacy)
 
(RIA) Call Girls Bhosari ( 7001035870 ) HI-Fi Pune Escorts Service
(RIA) Call Girls Bhosari ( 7001035870 ) HI-Fi Pune Escorts Service(RIA) Call Girls Bhosari ( 7001035870 ) HI-Fi Pune Escorts Service
(RIA) Call Girls Bhosari ( 7001035870 ) HI-Fi Pune Escorts Service
 
High Profile Call Girls Nagpur Isha Call 7001035870 Meet With Nagpur Escorts
High Profile Call Girls Nagpur Isha Call 7001035870 Meet With Nagpur EscortsHigh Profile Call Girls Nagpur Isha Call 7001035870 Meet With Nagpur Escorts
High Profile Call Girls Nagpur Isha Call 7001035870 Meet With Nagpur Escorts
 
APPLICATIONS-AC/DC DRIVES-OPERATING CHARACTERISTICS
APPLICATIONS-AC/DC DRIVES-OPERATING CHARACTERISTICSAPPLICATIONS-AC/DC DRIVES-OPERATING CHARACTERISTICS
APPLICATIONS-AC/DC DRIVES-OPERATING CHARACTERISTICS
 
Booking open Available Pune Call Girls Koregaon Park 6297143586 Call Hot Ind...
Booking open Available Pune Call Girls Koregaon Park  6297143586 Call Hot Ind...Booking open Available Pune Call Girls Koregaon Park  6297143586 Call Hot Ind...
Booking open Available Pune Call Girls Koregaon Park 6297143586 Call Hot Ind...
 
Roadmap to Membership of RICS - Pathways and Routes
Roadmap to Membership of RICS - Pathways and RoutesRoadmap to Membership of RICS - Pathways and Routes
Roadmap to Membership of RICS - Pathways and Routes
 
VIP Call Girls Service Kondapur Hyderabad Call +91-8250192130
VIP Call Girls Service Kondapur Hyderabad Call +91-8250192130VIP Call Girls Service Kondapur Hyderabad Call +91-8250192130
VIP Call Girls Service Kondapur Hyderabad Call +91-8250192130
 
DJARUM4D - SLOT GACOR ONLINE | SLOT DEMO ONLINE
DJARUM4D - SLOT GACOR ONLINE | SLOT DEMO ONLINEDJARUM4D - SLOT GACOR ONLINE | SLOT DEMO ONLINE
DJARUM4D - SLOT GACOR ONLINE | SLOT DEMO ONLINE
 
Call Girls Service Nagpur Tanvi Call 7001035870 Meet With Nagpur Escorts
Call Girls Service Nagpur Tanvi Call 7001035870 Meet With Nagpur EscortsCall Girls Service Nagpur Tanvi Call 7001035870 Meet With Nagpur Escorts
Call Girls Service Nagpur Tanvi Call 7001035870 Meet With Nagpur Escorts
 
Extrusion Processes and Their Limitations
Extrusion Processes and Their LimitationsExtrusion Processes and Their Limitations
Extrusion Processes and Their Limitations
 
HARMONY IN THE NATURE AND EXISTENCE - Unit-IV
HARMONY IN THE NATURE AND EXISTENCE - Unit-IVHARMONY IN THE NATURE AND EXISTENCE - Unit-IV
HARMONY IN THE NATURE AND EXISTENCE - Unit-IV
 

ch-9.pptx

  • 1. Introduction to Computer Applications in Metal Casting -Computers are being increasingly applied for design of patterns and castings and for other tasks in the casting industry; computer modeling of phenomena associated with the solidification of molten metals is common practice; -This include: Modeling of Solidification Heat Transfer; Modeling of Microstructural Evolution; Modeling of Combined Fluid Flow and Heat/Mass Transfer; -Modeling of Solidification Heat Transfer, describes the increase in computer applications to what is now termed the macroscopic scale of modeling casting solidification, that is, the movement of freezing fronts; -Modeling of Microstructural Evolution, looks at a different, more recently developed aspect--macro-microscopic modeling--from which the evolution of microstructure can be deduced; without consideration of the free and forced convection phenomena in zones of liquid or partially liquid metal; Modeling of Fluid Flow, describes how the computer can be applied to study the flow of metal through the gating system into the casting mold cavity; - Modeling of Combined Fluid Flow and Heat/Mass Transfer, explains how the combined action of the fluid flow and heat/mass transfer that occurs during the pouring and filling of the castings can affect the initial temperature distribution of the molten metal. 1
  • 2. Advantages of Computer Modeling -Computer-aided design (CAD), computer-aided manufacturing (CAM), and-computer-aided engineering (CAE) offer a number of advantages for castings. These include: · Increased casting yield per pound of metal poured; · Improved casting quality (absence of unsoundness); · Enhanced productivity of casting system; · Geometric models provide casting volume, weight, and surface area data, allowing rapid cost-estimating and permitting efficient rigging design; · Automated enmeshment for general purpose heat transfer simulators permits shorter design time; · Automated machining of patterns, which in turn reduces costs; · Fewer prototypes to be experimentally evaluated; shorter lead times from design concept to product; · Easier implementation and evaluation of engineering changes; · Enhanced ability to deal with batch production of castings of different design. 2
  • 3. Modeling of Solidification Heat Transfer • Geometric Description and Discretization • The form of the differential equations describing the diffusion of heat into the mold, together with the progress of freezing within the casting, is given for modeling using computer since 1960’; • To predict freezing history in complex industrial castings, the three- dimensional form must be provided and the correct boundary conditions specified. Even prior to this, there are several valid reasons for defining accurately and unambiguously the geometry and topography of the casting and its rigging: · Performing the analysis to generate preliminary rigging design; · Estimating the overall costs for casting production for the purpose of quotation; · Defining the melting capacity and molding equipment needs within the casting plant; · Generating the tapes or other information storage forms required to drive machine tools needed for the fabrication of patterns and core boxes and the sinking of wax pattern, permanent mold, and die casting dies; 3
  • 4. -The need to provide this geometric representation and to link the chosen form of representation with the process of discretization, that is, the breaking up of the whole into discrete elements, has been recognized as being of prime importance; -Turning first to the problem of overall geometry, much can be gained by examining the capabilities of the many geometric modelers now available; -The three most established types of geometric representation are : · Constructive solid geometry (csg) · Boundary re presentation (b-rep) · Wireframe (wf) 4
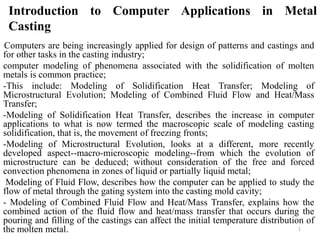
  • 5. Three types of three- dimensional geometric representation of a simple casting. (a) Constructive solid geometry. (b) Boundary representation. (c) Wireframe 5
  • 6. -The wireframe is not a true solid modeler, but because it normally forms an important part of many preprocessing packages for commercial finite-element method (FEM) computational codes, it is sometimes listed as a form of geometric modeling; - The csg and b-rep approaches are both often incorporated into commercially developed computer-aided design (CAD) packages. Figure 2 shows a csg-based model for a partial section of a casting in the form of a thick-wall cylinder together with its rigging. -Many contemporary modeling routines permit not only hidden-line removal but also the use of color and shading; - Figure 3 shows a representation of a small aerospace casting; -Perhaps the true test of the utility of a geometric modeling package lies in its ability to represent the full range of complex shapes involved in commercial casting; - A particular feature, which is likely to appear in most common casting configurations, is that of fillets, which are a necessary patternmaking expedient and something seen when one solid 6
  • 7. Portion of a geometric model of a casting with rigging, constructed using a csg geometric modeler. F, feeder or riser; G, ingate location; P, pouring basin; R, reaction chamber; RB, runner bar; S, sprue; ST, slag trap. A partially sectioned three- dimensional geometric model of a small aerospace casting 7
  • 8. Blending together of surfaces using fillets in preparation of models for patternmaking or for simulation studies. (a) Normal blend with edge limits. (b) Constant-radius blend Although the surface-modeling technique does not provide a complete geometric description of an object, it has been the basis of one of the most successful attempts thus far to link together computer-aided design and manufacture in the metal casting industry. The DUCT program, which originated at Cambridge University is able to produce a surface model from a given spine and an orthogonal section set . Such information can then be conveyed to patternmaking and core box fabricating machinery on a routine basis. 8
  • 9. Method by which a surface-modeling program DUCT, is used to build a model from a spine (dotted line) and a series of orthogonal sections. The sections are joined by Bezier curves. This technique has been used in the production of automobile manifolds. (a) Single closed DUCT. (b) Single open DUCT. (c) Combination of several closed DUCTs Before a model of any description can be built and a freezing simulation entered into, the foundry methods engineer must have a reasonably accurate picture of the location and dimensioning of the various components of the rigging system (the gating and risering subsystems) that are to be employed during casting; - Two approaches are being followed as alternatives to the age- old art of cut and try;9
  • 10. Cont’d - These techniques are both computer based, and one in particular uses (most effectively) the readily available personal computer rather than the mainframe machine demanded by both geometric representational (csg, b-rep, etc.) and numerical computational (FDM, FEM, etc.) programs. The techniques can be referred to as: · Special-purpose foundry rigging engineering programs · Knowledge-based expert systems programs -Special-Purpose Programs. Many programs fall under the category of special-purpose programs ; • One of the most versatile, the Novacast program , determines riser sizes by using the well-known Chvorinov rule and locates them by using various other empirically derived feeding range rules. The program will also approximate the geometric features of the gating system using the Bernoulli approximation, together with other empirical axioms. This type of program has met with relatively wide acceptance in foundries around the world. 10
  • 11. Knowledge-Based Expert Systems. Microcomputer programs are often sufficient for designing the rigging of castings of a less critical nature. However, for those cast components that form parts of aerospace systems or for the safety features of pressure vessels, and so on, further engineering measures are often necessary. -In such cases, the need arises for a knowledge-based expert system and its associated data base. In any particular organization, a vast amount of the expertise involved in the art of foundry practice often disappears with the retirement of certain employees. Although there is no unique solution to the problem of rigging a particular casting, there are many valuable, although sometimes conflicting, opinions available for consideration. FEM Software. Turning to the question of discretization of space within and around the casting (the mold cavity and the mold itself), a number of commercial FEM packages are associated with preprocessing routines that perform the subdivision involved, together with the parallel preparation of files describing that discretization (numbering of elements and nodes, and so on). A simple example of the enmeshment of both mold cavity and the mold itself is shown in fig. below ; -No special attempt was made to vary mesh density in particular locations. It should also be mentioned that the configuration in Fig. represents a two-dimensional object. Nonetheless, Fig. serves to indicate how rapidly the file-keeping capacity of the computer system will be occupied as the complexity of component design increases. 11
  • 12. Discretization (enmeshment) of a plate casting and riser, together with the mold into which they are to be cast Figure also shows that a preponderance of elements (or nodes) exists within the mold, per force of its enveloping nature with respect to the casting 12
  • 13. The Computational System • Many successful casting simulations have employed large-scale commercially available, general-purpose programs; • some research groups have chosen to build their own simulation programs or solvers. The development of such a program, a dedicated special- purpose FEM code, is used; • This particular system--The Michigan Solidification Simulator (MSS)-- was written exclusively for modeling the general problems of steady-state or transient energy transfer with nonlinear material properties, phase change, and imposed bulk-flow velocity fields; -Two-dimensional Cartesian and cylindrical, three-dimensional Cartesian element types (including interfacial contact resistance elements), totaling three coordinate systems and ten element types, can be supported; - In solving the basic governing equations, the simulator permits the use of the following boundary • conditions:1. Temperature specified, 2. Heat flux specified,3. Radiative heat transfer specified;4. Convection heat transfer specified 13
  • 14. Cont’d • Because heat transfer expressions for the third and fourth conditions have the same mathematical form, only three expressions are required to represent all four boundary conditions; • Currently, a uniform initial temperature field must also be specified; • The computations involve the use of the Galerkin method of weighted residuals; • The discretization of the geometry involved in the simulation uses triangles, distorted bricks, and distorted rectangles according to whether two- or three-dimensional castings are to be modeled; • At present, the division of a particular domain is undertaken manually. The validation of the program has been performed, first, using cases where analytical solutions exist, principally for one-, two-, and three-dimensional transient heat transfer with various boundary conditions but without solidification; second, for a case involving a latent heat source term but zero superheat, for which an analytical solution exists; 14
  • 15. Cont’d finally, for a variety of axisymmetric and three-dimensional examples involving the actual solidification of metals, where validation was undertaken experimentally from thermocouple measurements or sectioning . The actual castings simulated were: · A cylindrical gray iron casting poured in dry sand; · A cylindrical Al-13Si casting poured in dry sand; · A carbon steel rail wheel casting; · An investment cast Alloy IN-100 plate; -In the first three cases, very good agreement was obtained between simulation and experiment. • The rail wheel casting was chosen as an example of an industrial casting ; There are no experimental thermocouple data available, but radiographs and casting sections allow inference of cooling patterns and analysis of defects; 15
  • 16. Cross sectional view of a railwheel casting, with dimensions given in inches. The casting was poured in plain carbon steel 16
  • 17. Cont’d • The finite-element results for casting C are plotted as isotherms in Fig. below. The isotherms are the liquidus (1515 °C) and the solidus (1485 °C). The flange region has a pool of liquid metal that is cut off from the riser by the solidified web. One would expect to see defects in the sectioned casting near this point, and in fact there are defects • in this region, as predicted by the numerical simulation . Results of FEM simulation of railwheel casting using configuration C for riser . Pattern of liquidus and solidus isotherms suggests that shrinkage will occur in the The same simulation was run for casting geometry F, which has 13 mm of additional metal padding on each side of the web. Isotherms from that simulation are shown in Fig. below and indicate that the casting should be sound due to the directional solidification. Actual casting sections of casting F showed no shrinkage defects, thus validating the simulation. 17
  • 18. Cont’d Results of FEM simulation of railwheel casting using configuration F for riser . Web between hub and rim has also been thickened. Isotherms suggest that the casting should be sound The investment cast plate proved to be more complex to simulate because the surroundings of the investment play an important role. In this case, the agreement was found to depend on the condition assumed for radiation exchange between the investment shell/kaowool wrap and the surrounding environment (an evacuated furnace). In particular, the radiation view factors were seen to be important . The finite-element method is not the only system in use for performing simulations of shaped casting solidification. Many previous models have been successfully run using the finite-difference method, while more recently publications have appeared describing the use of the boundary-element method, the control volume method, and new developments of the finite-difference method ; 18
  • 19. Cont’d -At this time, the FEM-based techniques still possess the greatest all around flexibility. -Particular attention should be paid to the: · Ability to handle complexities of external shape; · Ability to handle totally enclosed portions of the mold, such as coring; · Speed of computation and type of computer on which the simulation is run; · Linkages provided with pre- and post processing packages, in particular the existing commercially available; • geometric modeler based CAD systems. 19
  • 20. Modeling of Solidification Heat Transfer The Data Base -All mathematical models of the solidification process should possess : · An accurate representation of geometry; · An adequate treatment for evolution of latent heat; · A sensitivity to the thermophysical properties of the materials involved in this process; -The thermophysical property data basenfor solidification modeling is a vast but sometimes sparsely populated region. By considering the most common molding material in shaped casting (bentonite-bonded silica sand), particularly the relationship that its apparent (or effective) thermal conductivity k has with temperature, one can appreciate part of the problem associated with data base development or expansion. As shown in Fig. below, k is a complex function of temperature. 20
  • 21. Cont’d In addition, one must specify the moisture content (even when considering dried sand), ramming density, average grain fineness, and the sand source . Recognizing the burgeoning number of mold materials, which now include zircon, olivine, and chromite sands the potential for data base depth seems almost limitless. A collection of such data has been made that includes curve fitted relationships linking temperature with thermal conductivity, specific heat, and other properties of molding and casting media If such data were not found to be readily available, estimates were made. This was especially true for the thermophysical properties of metals and alloys above their melting points or ranges. 21
  • 22. Variation of apparent thermal conductivity with temperature for compacts of silica sand containing various binder contents. 22
  • 23. Apparent thermal conductivities of four types of clay-bonded molding sands It was mentioned earlier that in most modeling problems in this area, where numerical analysis is used, the number of elements (or nodes) located within the mold itself vastly outnumbers those within the casting; 23
  • 24. Cont’d -In recent years, there has been a determined effort on the part of several workers to replace the mold in the simulation with either a heat flux data map or a tabulated series of equivalent heat transfer coefficient values, thus essentially changing the boundary; - Figures below compare conventional (mold enmeshment constrained) and these alternative (boundary heat flux or boundary curvature governed) calculations. Computed solidification front movement for pure aluminum in a sand mold. One quarter of a rectangular bar section is shown. (a) Results of FDM simulation using conventional approach, in which the mold is enmeshed and mold properties depend on temperature. (b) Same as (a), except mold properties are assumed to be constant. (c) Mold is not enmeshed, and heat flux q is specified at the mold/metal interface. 24
  • 25. Cont’d Successive positions of the solidus isotherms in a one-quarter section of an H-shaped casting (lowcarbon steel in sand). Time is in seconds, H half-height is 50 mm (2 in.), and half-width is 30 mm (1.2 in.). Results using standard FEM method are compared with those obtained using boundary curvature method 25
  • 26. Interpreting the Output of the Computer Simulation • A common failing of many early computer applications to design engineering lay in the inability of the software to summarize the meaning of the many lines of data emerging as output. This led to the appearance of efficient postprocessing software capable of displaying, for example, two- or three- dimensional stress plots or isotherms, depending on the nature of the numerical analysis. Commercially available postprocessing routines display such information superimposed on the geometric outline of the component Two views from a simulation of the solidification of a John Deere engine block 253 s after pouring. The material is eutectic gray cast iron with a freezing point of 1140 °C . The back surface is a plane of symmetry. 26
  • 27. Cont’d • With suitable interaction, certain routines will permit the generation of maps displaying the change of specific criteria functions affecting casting soundness; • Such functions are normally selected on the basis of theoretical considerations and may, for example, involve some combination of local temperature gradient, G; freezing front speed, V; or cooling rate, R or T; - The effect of combinations of such parameters on governing feeding characteristics of steels is illustrated in below; • Similar criterion functions for other cast metals, although data are currently unavailable, are the focus of extensive research and development. 27
  • 28. Results of an FDM simulation of portions of a steel casting. Shown are local solidification time (hours), local temperature gradient during freezing (°C/cm), and a criterion function G/ R , where R is rate of cooling during freezing. The freezing isotherm suggests that shrinkage could occur in the upper half of the casting. The criterion function does not suggest shrinkage, and the casting was sound. 28
  • 29. Modeling of Fluid Flow Introduction • FLUID FLOW MODELING is a technique that uses computers to investigate flow phenomena. These flow phenomena, particularly during the initial filling stage, have major effects on the quality of castings; • Designers have commonly relied on experience, rule of thumb, and handbook information to achieve their objectives of smooth flow, proper filling time, minimum gas entrapment, elimination of inclusions and dross, and the desired distribution of metal during mold filling; • The goal of improving the quality and cost-effectiveness of castings by means of computer-aided design (CAD) and modern process control requires that data be expressed more scientifically, so that they are amenable to computation; • fluid flow during the filling of castings is important not only in itself, but because it affects heat transfer both during and after filling. This must be taken into account in models of heat transfer and stress analysis in castings if they are to give the most accurate results. 29
  • 30. Cont’d • It is difficult to make direct observations of fluid flow inside molds, because the molds and the molten metal are opaque, the temperatures are high, and the conditions are highly transient; • Even when observations are made, the location of the metal as a function of time is usually the only information that can be obtained; • Not only is fluid flow modeling using computers usually the most economical and practical way to get information about what is going on inside a mold during filling, it is often the only feasible way; • Furthermore, it can give information about the velocity and pressure distributions within the molten metal which cannot be obtained by direct observation; • Computational techniques for modeling flow during mold filling can be divided into two categories : · Energy balance techniques based on the Bernoulli equation and the Saint-Venant equations; · Momentum balance techniques based on the Navier-Stokes equations as embodied in the Marker-and-Cell group of programs which include the Marker-and-Cell (MAC), Simplified Marker-and-Cell (SMAC), and Solution Algorithm (SOLA) techniques; 30
  • 31. Cont’d • The energy balance techniques are most useful for modeling flow through sprues, runners, and gates when the direction of flow is dictated by the configuration of the system; - The momentum balance techniques are needed for calculating flow inside mold cavities where the direction of flow and the location of the fluid must be calculated. Energy Balance Methods Because energy is a scalar rather than a vector quantity, these methods are primarily useful in determining flow rates in cases in which the direction of flow is established by the configuration of the system; - The Bernoulli equation is used for calculating flow in completely filled channels such as sprues, pressurized runners, and gates, while the Saint- Venant equations are used for partially filled channels such as nonpressurized runners and troughs; - Information provided by these calculations is extremely important to the design and manufacture of castings; -Now, CAD programs can apply these techniques to complicated systems with speed and accuracy. 31
  • 32. Cont’d • The Bernoulli equation applicable to this system may be written : where Pi and Pj are pressures at positions i and j, Vi and Vj are mean velocities at positions i and j, zi and zj are elevations at positions i and j, bi and bj are velocity distribution factors (0.5 for laminar flow and 1.0 for highly turbulent flow), g is the acceleration due to gravity, ρis the fluid density, and E i, j f is the friction energy loss between positions i and j. -The friction energy loss term E i, j f is a function of the velocity, the Reynolds number, and the configuration of the system between positions i and j . The Reynolds (NRe) number is defined by: where ν is the kinematic viscosity and De is the equivalent diameter 32
  • 33. Gravity-filled casting system analyzed by the Bernoulli equation approach. Numbered planes correspond to the subscripts used in Eq . The configuration of the system may change from point to point resulting in variations of the velocity and the NRe.Thus,E i, j f must be calculated for each segment of the system and then summed for the whole system. -For some uses, it is not necessary to consider friction energy loss. For example, the calculation of sprue taper is often done without it . The objective is to calculate the change in the cross section of a vertical sprue that will compensate for the acceleration of the molten metal as it drops through the sprue under the influence of gravity. This yields the following equations for the ratio of the cross-sectional areas at the top (A2) and bottom (A3) of the sprue, or for the diameters of a round sprue at the same points: 33
  • 34. Cont’d Sprue taper needed to compensate for the acceleration of molten metal in gravity feed calculated using Eq 3 or Eq 4. Numbered planes correspond to subscripts in either equation. 34
  • 35. Cont’d • If friction is considered, this equation is modified to: where the e i, j f are friction energy loss coefficients such that: Introduction of a friction energy loss e 2,3 f within the sprue reduces the taper required, while a friction energy loss e 1,2 f above the sprue increases it; -In nonferrous casting, it is common practice to use nonpressurized filling systems in which the runners are only partially filled with liquid metal; - These can be modeled with the Saint-Venant equations , which are useful when the bottom of the channel and the free top surface of the stream slope at different angles . They are also used when the flow rate and the top surface of the stream vary with time. 35
  • 36. Cont’d • The equation of continuity is written: where WT is the width of the channel at flow depth Y, t is time, and VA is the product of velocity and fluid cross-sectional area (that is, the volumetric flow rate). Bottom of a partially filled runner or open channel (designated by cross-hatched area, or bed) having a slope of (Z1 - Z2)/ΔX and fluid depth of Yi. The equation of motion for the steady state case may be written: 36
  • 37. Cont’d • where the actual slope of the bottom of the runner So is: and the so-called friction slope Sf is defined by: where Rh is the hydraulic radius and n is Manning's roughness coefficient, the values of which are determined empirically using similarity principles. For the time-dependent case, the equation of motion may be written: in which the last term represents the acceleration. Note that the roughness factor n takes into account the channel configuration as well as the surface roughness and may change frequently along the course of the channel. It is larger at the tip of the entering stream than in areas already containing a layer of molten metal. 37
  • 38. Cont’d • For CAD and analysis of mold-filling systems, the Bernoulli and/or Saint-Venant representations of each of the individual sections of the system can be combined into a network of series and parallel paths; • The friction energy loss factors and the friction slopes must be obtained from empirically derived correlations with the NRe and other dimensionless numbers; • Their use commonly calls for iterative solutions, because they are functions of the velocity and free surface height, which are dependent variables one seeks to determine; • Literatures most often presents the necessary empirical correlations in graphs; • The relationships represented by the graphs can be reduced to a set of parametric equations for use by the computer. • For example, the information shown in Fig. below may be reduced to: 38
  • 39. Cont’d where eb is the head loss coefficient, β is the angle shown in Fig. , and σ is AS/AL. In spite of its complicated appearance, the solution may be found very swiftly on any computer. Head loss coefficient for a gradual enlargement plotted as a function of the area ratio (σ = AS/AL) and the angle β. Open circles indicate selected eb values obtained using above eq. 39
  • 40. Cont’d • The Bernoulli and Saint-Venant equations can be used in a design program that includes the rules of good practice frequently used in the foundry industry. From experience, for example, rules have been established that specify the acceptable range of filling times for castings of a given type as a function of the casting weight. These rules also suggest a certain size for the sprue, one for the runner, and one for the gate, which can be used to produce an initial design; • The accuracy can then be verified by performing the energy balance calculation described above ; • The design can be modified and the energy balance calculation performed again until the calculated result agrees with the desired filling rate. This technique allows special plant conditions to be considered, such as limitations on the amount of molten metal available at one time, and limitations on the flasks and patterns available for making the mold; • This type of modeling of metal flow during mold filling has been integrated into CAD systems that produce finished drawings for the pattern and mold shops. In some cases they even produce numerical- control (NC) tapes for cutting the pattern. An example of a drawing for the pouring basin, sprue, runner, and gates for a particular casting 40
  • 41. Typical layouts of a mold-filling system obtained from a CAD program based on sound foundry industry practice and refinements by Bernoulli and Saint-Venant equations. (a) Pouring basin, sprue, and sprue base layout. (b) Runner-gate layout. Dimensions given in inches. 41
  • 42. Physical Modeling of Mold Filling • It is important to verify computational models of mold filling with physical experiments. Physical modeling of metal flow is most often done with water in transparent molds. Water is a suitable fluid model because its kinematic viscosity is nearly the same as that of common metals at their normal pouring temperatures, especially if the temperature of the water is properly controlled. For example, the kinematic viscosity of water at 35 °C is the same as that of 0.5%C steel at 870 °C ; • To model the flow of liquids influenced by inertial, viscous, and gravitational forces requires NRe and Froude number, NFr, similarities, in which the Froude number is defined as NFr = V2/gL, where L is the characteristic dimension of the system. This is obtained when water at the temperature to achieve proper kinematic viscosity is used in models of the same size as the real system. The application of water models to mold filling is • It is possible to observe the flow of actual metals into molds from x- ray cinematography studies ; • Greater detail of the flow of metal into sand molds was observed by filming with a high speed motion picture camera focused through a plate glass window on the side of the mold . 42
  • 43. Cont’d • Molten cast iron entering a silica sand mold was filmed with this technique. The molten metal locations traced from these films will be shown in "Correlations With Actual Metal Flow." • Recently, computerized data acquisition systems have been used to observe the flow of molten metal into nontransparent three- dimensional molds ; • Two types of sensors have been used: simple contact wires and thermocouples. The simple contact wires are connected to the digital inputs of the data acquisition unit. Molten metal contacting a bare copper wire completes a circuit, and this is then detected by the data acquisition unit; • The digital inputs can be read very rapidly by the computer; it is possible to read hundreds of such contact points many times during the filling of a single mold. An accurate picture of the location of the metal at any time can be developed from these data. A clever system for using a finite element postprocessor for presenting the results of such experiments has been reported. 43
  • 44. Cont’d Three-dimensional visualization of molten metal locations determined by the contact wire method and displayed by a finite-element postprocessor. Numbers in the figure are filling times in seconds Thermocouples can be used alone or in conjunction with the contact wire sensors. Although they give more information than do simple contact wires, thermocouples produce an analog signal that takes longer to read. The combination of contact wires and thermocouples is particularly useful for observing the flow and solidification patterns in thin-wall castings having the problem of premature freezing (namely, cold shuts). 44
  • 45. Momentum Balance Techniques • Fluid flow within the mold cavity during filling is transient; the amount and location of the liquid changes rapidly. Calculation of the location of the liquid and the orientation of its free surface must be an integral part of the computational techniques used to model it. The family of computational techniques called MAC , SMAC , and solution algorithm-volume of fluid (SOLA-VOF) are well suited for handling these problems; • Although they differ from each other in the way they keep track of the location of the free surface and the way in which they perform some of the internal iterations, they are based on the same principles. To simplify the discussion, the acronym MAC is used to represent this whole family of computational fluid dynamics techniques. MAC Technique Highlights • MAC uses a finite-difference scheme for the mathematical analysis of fluid flow problems . Like most of these techniques, MAC first divides the system (that is, the configuration of the casting cavity under discussion) into a number of subdivisions, called cells, which are usually rectangular. 45
  • 46. Cont’d • Then a set of imaginary markers (in MAC and SMAC) or fluid function values called F (in SOLA-VOF) is introduced into the system to represent the location of the fluid at any instant; • The velocity field of the moving fluid domain can be calculated by the application of fluid dynamics principles; • Next, the markers are moved, or the fluid function is updated, according to the calculated velocity field in order to represent the new location of the fluid domain. This procedure can be repeated from the beginning when the cavity is empty until it is completely filled. 46
  • 47. Flow pattern obtained 3.95 s after pouring begins showing MAC cell divisions and fluid domain locations (indicated by triangular markers 47
  • 48. Fluid domain plot obtained with the fluid function F using the SOLA-VOF technique. F = 1.0, 0.0 < F <1.0, and F = 0 indicate full, surface, and empty cells, respectively 48
  • 49. • Fluid Domain Identification • In MAC, the cells are designated as full, surface, or empty, based on the location of markers or the distribution of the fluid function. With the marker approach, a full cell is one that contains at least one marker, if all of its neighboring cells contain markers as well. A surface cell contains at least one marker, but has at least one neighbor without any markers. • An empty cell is any cell with no markers. With the fluid function technique, F represents the fraction of the volume of a cell that is filled with fluid. F can have values from 0 to 1. F is 1 for a full cell, 0 for an empty cell, and some fractional value for surface cells. The fluid function F can also be used to calculate the approximate location and orientation of the free surface of the fluid. Collectively, the full cells constitute the interior region, and the surface cells constitute the surface regions. 49
  • 50. Cont’d • Calculating Velocity Field in Moving Molten Metal • After the flow domain and the corresponding interior and surface regions of the domain have been identified, the velocity and pressure fields within the flow domain are calculated. The physical conditions that govern the flow behavior in the interior regions are somewhat different from those in the surface regions. • Interior-Region Flow Behavior. In the interior regions, the following principles should be obeyed in a cell volume: • Mass Flow In Equals Mass Flow Out. This is due to the incompressible nature of molten metal. This gives the following form of the continuity equation in two dimensions: where u and v are the velocity components in the x- and y-directions. 50
  • 51. Cont’d • Momentum Change Equals Momentum In Minus Momentum Out. In mathematical form this is: In the x-direction: In the y-direction: where t is time, p is pressure/density, v is viscosity/density, and g is the acceleration of gravity. The Equations are commonly called the Navier-Stokes equations. In case of turbulent flow, v may be replaced by the effective viscosity. The velocity and pressure fields for the interior region are calculated using these three governing equations and the finitedifference technique. 51
  • 52. Surface Region Flow Behavior In the surface region, the momentum balance principle, and thus Eqs above, still applies. However, Eq is not valid because the mass within the cells of the surface region is changing. Instead, the surface region contains the interface between the molten metal and the atmosphere surrounding it, and free surface boundary conditions should be obeyed. This means that :Tangential Stress on the Free Surface Should Vanish. This may be expressed by: where nx, ny, mx, my are the x and y components of the unit vectors normal to and tangent to the free surface. 52
  • 53. Orientation of the free surface represented in Eq above. Normal Stress Should Balance the Applied Pressure Plus the Surface Tension. This may be expressed by: where pa is the applied gas pressure in the empty region and ps is the surface tension pressure. The flow field in the surface region is calculated using these principles 53
  • 54. Fluid Flow Phenomena in the Filling of Metal Castings Fluid flow calculations can help gain an understanding of flow phenomena occurring during mold filling . To illustrate this, the results of MAC calculations applied to some simple mold designs are presented below. All of the designs have thin cross sections so that the metal flow is restricted to two dimensions. (Although the MAC technique can be applied to three dimensions, it requires a lot of computer time, so most of the computations of metal flow have been done in two dimensions.) Example 1: Filling of a Large, Horizontal Square Plate Casting. The first case is a horizontal square plate 610 × 610 mm (2 × 2 ft), with a 122 mm (0.4 ft) wide ingate at the center of the left wall, through which metal enters at 305 mm/s (1 ft/s). The mold fills in 10 s. For numerical analysis, the casting was divided into 400 square cells (20 in each direction). Results of the computation (Fig. below) show that as the metal enters the mold, the stream expands slightly before reaching the far wall. Upon reaching the wall, the stream splits in two, building up along the far side of the cavity and then reflecting back toward the ingate. The two vortices that form, one on either side of the gate, are the last regions to fill, and any gases in the mold are squeezed to these areas near the end of the filling process. 54
  • 55. Vector plot showing flow patterns and velocity profiles obtained when filling a horizontal 610 × 610 mm (2 × 2 ft) square plate casting. Entrance velocity was 305 mm/s (1 ft/s), and vector plots shown are at elapsed times. (a) 3.95 s. (b) 5.45 s. (c) 9.95 s. 55
  • 56. Example 2: Filling of a Small, Horizontal Square Plate Casting. The second casting is similar but smaller, and it demonstrates the effect of size (and/or relative entrance velocity) on the flow pattern (Fig. below). The cavity is 61.0 × 61.0 mm (0.2 × 0.2 ft) with an ingate 12.2 mm (0.04 ft) wide. The entrance velocity, again, is 305 mm/s (1 ft/s), so it fills in 1.0 s. For computation, the system is divided into 400 cells. The flow pattern is quite different. Metal enters the mold like a jet, hitting the opposite wall before spreading. When the jet hits the wall, it flows rapidly outward in two symmetrical streams that cling much closer to the wall than in the previous case. These streams race back against the side walls, then along the ingate wall, where they encounter the incoming jet. In contrast to Example 1, the last areas to fill are much farther from the ingate, and the vortices, one on either side of the centerline, are somewhat larger. Also, the calculations show that the initial momentum is directed at a small area of the opposite wall, resulting in high pressures and the 56
  • 57. Vector plot showing flow patterns and velocity profiles obtained when filling a horizontal 61.0 × 61.0 mm (0.2 × 0.2 ft) square plate casting. Entrance velocity was 305 mm/s (1 ft/s), and vector plots are shown at elapsed times. (a) 0.299 s. (b) 0.599 s. (c) 0.879 s. 57
  • 58. Example 3: Filling of a Vertical Square Plate Casting to Illustrate the Effect of Gravity on Flow Pattern. The third design demonstrates the capability of the model to include the influence of gravity, or other body forces. It is a vertical square plate 152 × 152 mm (0.5 × 0.5 ft) with a 38.1 mm (0.125 ft) wide ingate located at the lower left corner. The velocity varies from 975 mm/s (3.2 ft/s) to 518 mm/s (1.7 ft/s), depending on the metal level and gas pressure in the mold. The entrance velocity is determined by coupling a Bernoulli equation calculation for flow through the filling system with the MAC calculation for flow within the mold. This casting also was divided into 400 equal- size square cells for computation. The results of the simulations (Fig.) show the melt enters as a bore with a sloping top surface. When it hits the opposite wall, it jumps up the wall about 0.8 of the distance to the top, rolling back over on the incoming stream and forming a strong vortex. Then it jumps up the wall above the ingate, and a wave works its way from side to side. The last area to fill is the top left corner. This flow behavior has been verified by high-speed movies of a water model, some frames of which are shown in Fig.. An actual casting of Al-7.5Si alloy made in a sand mold of this design showed low density in the area where the vortex was last located and entrapped gas porosity in the last area to fill. A photograph and a radiograph of this casting are shown in Fig. 14 58
  • 59. Vector plot showing flow patterns and velocity profiles obtained when filling a vertical 152 × 152 mm(0.5 × 0.5 ft) square plate casting. Entrance velocity is determined by Bernoulli equation calculation and varies from 975 mm/s (3.2 ft/s) to 518 mm/s (1.7 ft/s). Plots are shown at elapsed time. (a) 0.10 s. (b) 0.32 s. (c) 0.42 s. (d) 0.62 s. (e) 0.76 s. 59
  • 60. Tracings of still photographs from a high-speed motion picture of a water model of the vertical 152 ×152 mm (0.5 × 0.5 ft) square plate casting calculated in Fig. above. (a) 0.10 s. (b) 0.30 s. (c) 0.45 s. (d) 0.65 s.(e) 0.90 s. 60
  • 61. Photograph (a) and radiograph (b) of an Al-7.5Si alloy casting produced in a vertical square plate mold identical to that used to obtain Figs. above data. The radiograph shows a large accumulation of gas bubbles in the last area to be filled by the alloy. 61
  • 62. Filling of a Vertical Stepped Plate Casting. The design and dimensions of a somewhat more complicated mold are shown in Fig. . It is a plate casting with steps on the bottom. The entrance velocity starts at 975 mm/s (3.2 ft/s) and gradually decreases as the level of molten metal and the gas pressure build up in the mold. The calculated results shown in Fig. indicate that the metal forms a vortex beneath the ingate (which is located above the bottom in this case) and standing waves above each of the steps. Before the flow reaches the far end of the mold, metal begins to rise in the vertical section (which represents a riser), and another vortex forms in this region. This flow pattern has been verified by high-speed movies of a water model. 62
  • 63. Configuration and dimensions of a vertical stepped plate mold. Dimensions given in inches 63
  • 64. Vector plot showing flow patterns and velocity profiles of a vertical stepped plate casting produced by using the mold illustrated in Fig. above . The initial entrance velocity was 975 mm/s (3.2 ft/s), and the plot is shown at elapsed times. (a) 0.27 s. (b) 0.39 s. (c) 0.72 s. (d) 1.47 s. (e) 1.80 s. 64
  • 65. • The MAC technique can be applied to flow through the filling system as well as in the mold cavity. Figure below shows flow in such a system and demonstrates the undesirable condition in which the descending metal pulls away from the walls of an untapered sprue. Some detailed studies of flow in the sprue and runner have been made using the SOLA-VOF version of these techniques . Geometry, dimensions, and vector plots (showing flow patterns and velocity profiles) of the filling system attached to the vertical 152 × 152 mm (6 × 6 in.) The vector plot is shown at elapsed times. (a) 0.0 s. (b) 0.290 s. (c) 0.570 s. Dimensions given in inches. 65
  • 66. • Correlations With Actual Metal Flow • Correlations of calculated flow with observations of actual metal flow are shown in Figs. below (the flow of cast iron into silicate- bonded sand molds was recorded by a high-speed motion picture camera through a glass window on the side of the mold) . The casting is a three-spoke wheel. In one of the configurations, the metal enters through a gate at the top, and the gate is positioned midway between two spokes (Fig. ). In the other, the gate is at the bottom directly opposite a spoke (Fig. ). The results, calculated using a modified SOLA-VOF technique, are shown. The agreement • between the observed patterns and the calculated ones is very good, particularly in the way in which the metal misses the diagonal spokes in the top-gated castings and pours around the rim until filling is about two-thirds complete. It can clearly be seen from these experiments that the bottom-gated casting fills more smoothly and uniformly and probably results in a better-quality casting. 66
  • 67. Calculated flow patterns, (a) to (f), and comparable high-speed motion picture frame tracings, (g) to (l), of molten cast iron entering a top-gated sand mold to produce a three-spoke wheel. Elapsed times for the calculated patterns. (a) 0.250 s. (b) 0.600 s. (c) 0.900 s. (d) 1.600 s. (e) 2.650 s. (f) 3.000 s. 67
  • 68. Calculated flow patterns, (a) to (f), and comparable high-speed motion picture frame tracings, (g) to (l), of molten cast iron entering a bottom-gated sand mold to produce a three-spoke wheel. Elapsed times for the calculated patterns. (a) 0.100 s. (b) 0.200 s. (c) 0.500 s. (d) 1.000 s. (e) 2.200 s. (f) 2.900 s. 68
  • 69. • Figure below shows the solidification pattern that occurs in the bottom-gated casting 36 s after the start of the pour. The residual influence of the entering stream of hot metal is shown by the molten state of the bottom spoke after the two upper spokes have solidified. These calculations were done by a program that uses SOLA-VOF to calculate fluid flow and couples it with a finite-difference heat transfer program to calculate temperature distributions. This is particularly useful in modeling thin castings, in which solidification may begin before the mold is completely filled. Calculated solidification pattern in the bottom-gated three-spoke wheel casting in Fig. above after an elapsed time of 36.192 s. Fraction solid is greater than 0.5 in shaded area and less than 0.5 in unshaded area to show the residual effect of fresh hot metal flow through the bottom spoke throughout the filling period 69
  • 70. Modeling of Combined Fluid Flow and Heat/Mass Transfer • Introduction • FLUID FLOW AND HEAT/MASS TRANSFER principles are increasingly gaining acceptance as a means of improving the quality and yield of castings. The benefits to be derived from adopting such an approach range from slag- and dross free gating system design to a desired microstructure of the finished product. In general, the transport of heat, mass, and momentum during solidification processing controls such varied phenomena as solute macro segregation, distribution of voids and porosity, shrinkage effects, and overall solidification time. These parameters, in turn, result in a variation of the mechanical, thermophysical, and electrical properties of the solidified product. 70
  • 71. Cont’d • The complex nature of the coupling between heat and mass transport with fluid flow during solidification necessitates a fundamental understanding of the processes and the mechanisms of interaction in relation to empirical formulas and charts. Heat transfer by forced convection predominates during the filling stages. Once the mold cavity is filled, buoyancy-generated natural convective heat and mass transfer occur before the phase change . • The principles of heat transfer by forced convection are shown schematically in Fig. 1, which is a representation of flowing metal at a superheated pouring temperature T01 and a velocity u advancing into a mold channel of width 2d and length L, initially at an ambient temperature T02. Stage 1 shows the channel just before the liquid metal enters. Stages 2 and 3 show the liquid region R1 occupying half and almost full lengths of the channel, respectively. The temperature at the liquid metal/mold wall interface keeps evolving as the flowing metal front advances into the channel. The portion of the mold wall not yet covered by the flowing metal remains at a considerably lower temperature. Stage 4 shows the completely filled channel with conventional steady flow and heat transfer processes. 71
  • 72. Filling stages in an empty channel. See the corresponding text for a description of Stages 1 through 4. 72
  • 73. • Subsequent stages during the solidification of a binary alloy involve both phase change heat and mass transfer as well as buoyant thermo-solutal convection . • Figure 2 shows a schematic representation of the stages in the solidification of a binary alloy. Solidification begins with cooling across boundary BII between the liquid metal region RIV and the mold region RI, together with cooling at boundary BI between the mold and the ambient (Fig. 2a). Next, the solid/liquid mushy region RIII evolves between boundary BII with the mold and BIV with the liquid metal (Fig. 2b). Further cooling leads to a typical steady-state picture showing a solidified crust region RII with boundaries BII and BIII with the mold and the mush, respectively, and the mushy region RIII with boundaries BIII and BIV with the crust and the liquid, respectively (Fig. 2c). The final transient stage shows the depletion of the all-liquid region RIV (Fig. 2d). 73
  • 74. Stages in binary alloy solidification. (a) All liquid. (b) Initial transient. (c) Steady state. (d) Final transient. See the corresponding text for details 74
  • 75. Heat Loss During Filling • Pioneering work on heat loss from the flowing metal to the sand mold runners consisted of obtaining plots of temperature loss versus time, with the ratio of surface area to flow rate used as a parameter . Assuming instantaneous filling and negligible contact resistance between the sand mold and the flowing metal, this method gives good results. A modified version of the method, intended for a constant or linearly decreasing average velocity of the molten metal, indicates that the temperature loss in the runner decreases with time and is proportional to the residence time of the fluid element in the runner . These results can be used to calculate temperature loss for a variety of runner lengths, flow rates, runner diameters, pouring temperatures, and sand mold thermal properties. However, the results are not accurate for metallic molds, nor for very short times after pouring. • Based on more detailed mathematical models of the transient filling process, finite-element solutions for the mold/metal interface temperature for very short times after pouring have been developed . Typical results of such calculations for a horizontal runner channel are shown in Fig. 3. In this case, the maximum temperature difference in the system, that is, the difference between the pouring temperature and the initial mold temperature, is represented by T01 - T02. 75
  • 76. Cont’d • Figure 3 shows that the instantaneous filling assumption (open triangles) yields a midchannel value of wall temperature at a time of 0.1 s after pouring as [T01 - 0.96(T01 - T02)], while the corrected value after accounting for the fluid flow (convection) effects during filling (closed circles) is [T01 - 0.64(T01 - T02)]. Although this may indicate an instantaneous freezing, the subsequent flow of superheated metal causes remelting. The temperature profiles across the channel at various times are shown in Fig. 4. Similar calculations have been performed for the vertical gating sprue for a variety of geometries (lengths, tapers, and diameters), flow rates, pouring temperatures, and properties of the melt and the sand mold . • The competing effects of conduction heat transfer to the mold and convection due to the flow determine the interface temperature. In other words, both the thermal conductivity of the sand and the thermal capacity of the flow are important. 76
  • 77. Interface temperature distribution in a filling channel 77
  • 78. Cont’d Transient temperature profiles across filling channel 78
  • 79. • Postfilling Buoyant Convection • The loss of liquid metal superheat in the casting cavity of the mold after the filling transients have died out occurs by buoyancy-generated convection currents. These currents tend to redistribute the melt temperature and composition until solidification begins. Subsequent solidification sequences also involves heat loss by thermosolutal buoyant convection during the phase change. Figure 7(a) shows patterns of calculated convection currents in a pure melt for a vertical rectangular cavity. The indicated Rayleigh number in Fig. 7(a) characterizes the strength of the buoyant transport in relation to that by pure diffusion. Although miniscule in comparison with the patterns of flow during filling, these currents significantly shift the hot metal to the top and then redistribute the thermal state of the melt before solidification begins. A typical upward shift of the hot isotherm is shown in Fig. 7(b). Any subsequent simulation of the solidification sequence must account for this initial temperature distribution within the cavity. 79
  • 80. Final steam function distribution in cavity filled with liquid copper. Cavity aspect ratio is 2, and the Rayleigh number of the process is 7000. Only the left half of the two symmetric halves of the cavity is shown. Moving horizontally to the right from center of the illustration to the centerline of the cavity, the distance between the adjacent stream lines decreases, indicating faster upward flow between adjacent stream lines. The centerline forms an insulating boundary between the two symmetric halves of the cavity. 80
  • 81. Final temperature distribution in cavity filled with liquid copper. Cavity aspect ratio is 2, and the Rayleigh number of the process is 7000. Only the left half of the two symmetric halves of the cavity is shown. The curve labeled 0.44 is the hottest of the isotherms shown. Its temperature excess over the solidification temperature equals 44% of the maximum temperature difference that existed between the super-heated liquid and the solidification temperature at the start of the natural convection process in the cavity. 81
  • 82. Cont’d -In the case of alloy melts, the difference in atomic weight of the constituent metals causes an additional convection pattern. The temperature and solute redistributions due to buoyant thermal convection occur in a coupled fashion, each driving and being driven by the other. Both the scale of the convective motion and the time during the solidification sequence when buoyant convection becomes significant must be determined to identify the process parameters governing subsequent microstructural behavior; • -Mathematical models of the buoyant transport processes during binary alloy solidification can be examined to obtain the applicable time, length, and motion scales for the liquid, the solid, and the mushy zones depicted. Of these, the most crucial issue from the metallurgical viewpoint is the evolution of the mushy zone and the factors that govern it; • The mushy zone in a tall vertical sample casting (Fig. 8a) is viewed as a forest of dendrites submerged in a melt pool and is characterized by a field distribution of the solidified mass fraction Φ ; • The solid-liquid mixture under local thermodynamic phaseequilibrium is in turn characterized by the pressure, the temperature, and the average mixture composition. The lever rule then yields the local liquid and solid concentrations. 82
  • 83. Cont’d • The buoyant flow can be driven by heat or mass transfer,depending on the magnitude of the buoyancy parameter N: where βC is the fractional change in density due to concentration changes and βT is the fractional change in density due to temperature changes. However, for most cases of binary alloy solidification of practical interest, the buoyant current is mass transfer driven; - The boundary layer provides concentration, temperature, and velocity in a mass transfer driven flow for the tall, vertical casting, as shown in Fig. 8(b) and 8(c). In the boundary layer regime, the orders of magnitude x, y, ΔT, and ΔC can be represented as: where the subscripts 0, c, and e are the initial, liquidus, and eutectic states, respectively 83
  • 84. Solidification of a tall, vertical casting. (a) Stages of a solidifying alloy. (b) Evolution of boundary layer in the mushy zone. (c) Boundary layer concentration, velocity, and temperature profiles 84
  • 85. Cont’d • For short times after solidification begins, all transport processes are diffusive, until a time tf, when convection overtakes diffusion. A scale analysis of the mixture equations for the balance of mass, species, and vorticity yields order of magnitude of this time (the end of initial diffusion transport period) as: where B is the semi-width of the casting, D is the mass diffusivity of the alloy mixture, and RSB is the solutal Rayleigh number, which is defined as: where ν is the kinematic viscosity and g is the acceleration due to gravity. The order of magnitude of the concentration boundary layer thickness at this time is given as: 85
  • 86. Cont’d • and the steady-state mass transfer rate in the mushy zone is estimated from the Sherwood number, Sh, as: The corresponding values for the thermal boundary layer thickness and the Nusselt number for heat transfer rate calculations in the mushy zone can be obtained by a similar scale analysis of the thermal energy equation and the vorticity transport equation. Detailed computations for the actual values for alloy solidification are being performed and are expected to appear in the open literature in the near future. 86
  • 87. Modeling of Microstructural Evolution • THE MODELING OF SOLIDIFICATION of castings has received increased attention as the computer revolution has matured. The main application of this technique has traditionally been calculation of the path of the isotherms (lines of constant temperature) through shaped castings. In turn, this was used to predict the locations of hot spots in castings and thus to check, using the computer, a proposed gating and risering system, rather than following the classical trial-and error technique used in foundries. • Macroscopic Modeling • Solidification of alloys is primarily controlled by heat diffusion and to some extent by convection within the liquid region; • In most approaches to the solidification modeling of complex- shaped castings, the continuity equation of motion is not solved explicitly. Instead, correction is taken into account by increasing the heat conductivity above the melting point or the liquidus temperature. Under this assumption, the basic continuity equation governing solidification at the macroscopic scale is that of conservation of energy: 87
  • 88. Cont’d where T( xr,t) is the temperature field, k(T) is the thermal conductivity, ρCp(T) is the volumetric specific heat, and Q is the source term associated with the phase change. In solidification modeling, Q can be written as: where fs( x r,t) is the solid fraction and L is the volumetric latent heat. To solve Eq 1, a relationship between the fields T( xr,t) and fs( xr,t) must be found. A simple and widely used approach is to assume that the fraction of solid fs depends only on the temperature T and not upon cooling rate or growth rate. For pure metals or eutectic alloys, one can assume that fs = 0 above the melting point or the eutectic temperature and that fs = 1 below the equilibrium temperature. For dendritic alloys, various models of solute diffusion have been developed . They all assume complete mixing of solute within the liquid, thus resulting in a unique fs(T) curve. 88
  • 89. Cont’d • Assuming that fs depends only on T, Eq 1 and 2 can be combined to give: defining enthalpy H as: Equation 3 can also be written as: This is known as the enthalpy method. An effective specific heat, ρC*p, can be derived from Eq 4 which, when introduced in Eq 3, gives: This is known as the specific heat method. 89
  • 90. Cont’d -The curves H(T) and ρC*p(T) can be calculated by various methods, for example, using a Brody-Flemings model of solute diffusion . Both methods can be used in macro-micro modeling. Other techniques, such as the latent heat method or the micro-enthalpy method , have been specifically developed for macro-micro modeling. -Modeling of Columnar Structures -The macroscopic approach described briefly in the previous section can be reasonably applied to columnar solidification because the growth rate of the microstructure (eutectic front or dendrite tips) is more or less equal to the speed at which the corresponding isotherms move (eutectic or liquidus isolines). Therefore, microstructural parameters and undercooling can be directly calculated from the temperature field in this case. -Columnar growth morphologies are encountered in both dendritic and eutectic alloys . Solidification occurs in a columnar fashion when the growth speed of the dendrite tip or the eutectic front vs is directly related to the speed vm of the isotherms calculated from a macroscopic approach (Fig. 1). It is therefore necessary to have a positive thermal gradient G at the solid/liquid interface. However, this condition is not sufficient to ensure the formation of columnar structures . 90
  • 91. Schematic of columnar and equiaxed growth of dendritic and eutectic alloys in a thermal gradient G 91
  • 92. Cont’d • The competition between columnar and equiaxed morphologies, in particular the columnar-to-equiaxed transition, in a given macroscopic thermal environment, one can calculate: • The undercooling ΔTC associated with the formation of a columnar structure; • The nucleation undercooling ΔTN at which nuclei are formed within the melt; • The undercooling ΔTE required to drive equiaxed solidification; • Under steady-state growth conditions and considering these three undercoolings, a simple criterion to obtain a fully columnar structure can be defined by: where N0 is the density of grains nucleated at the undercooling ΔTN, and A is a constant. 92
  • 93. Cont’d • Assuming that the thermal gradient G is large enough to ensure that a columnar structure is produced, microstructure formation theories can be easily implemented into macroscopic heat flow calculations if one makes the following hypotheses: · The kinetics of the eutectic front or the dendrite tip are given by the steady-state growth analysis; · The velocity of the microstructure vs is related to the velocity vm of the corresponding equilibrium isotherm, as shown in Fig. 2 • In Fig. 2, four different microstructures frequently encountered in solidification are shown: regular and irregular eutectics and cellular and dendritic morphologies. In the first three cases, one has simply: • vs = vm 93
  • 94. Relationship between growth velocity of the macroscopic isotherms vm and growth velocity vs of four different columnar microstructures. (a) and (b) Regular and irregular eutectics, respectively. (c) Cells. (d)Dendrites 94
  • 95. Cont’d • For dendritic alloys, the velocity of the dendrite tip is essentially dictated by the trunk orientation, which is imposed more or less by the crystallographic orientation of the solid (for example, <100> for cubic metals). If α is the angle between the trunk orientation and the heat flow direction, then: In castings, grain selection will occur such that those grains whose angle α is close to zero will grow preferentially. However, dendritic single-crystal growth or epitaxial dendritic growth from single- crystal substrates can be characterized by an α value that can deviate substantially from zero. Based on the two hypotheses mentioned previously, the kinetics of microstructure formation can be implemented into macroscopic heat flow calculations according to the following simple scheme. One first calculates the temperature field evolution without taking into account any undercooling . 95
  • 96. Cont’d • Once the temperature field is known, the velocity of the corresponding isotherms (liquidus or eutectic temperature) can be deduced as well a the thermal gradient at the interface. From these values, th undercooling of the columnar microstructure and the associated parameters of the microstructure (eutectic or dendrite trunk spacings can be calculated using recent theories of microstructure formation; • Two researchers have achieved a real coupling between dendriti microstructure formation theory and one-dimensional nonstationary hea flow calculations in the case of spot laser remelting of material surface ). In particular, they have developed a model of solid fraction that take into account the large undercooling experienced by the dendrite tip under rapid solidification conditions. They have shown that even unde such circumstances the results predicted by this detailed approach do not differ significantly from the simplest model that neglects th undercooling at the macroscopic scale; • This last approach has been applied to the laser treatment of material surfaces to predict the lamellar spacings of a eutectic aluminum-coppe alloy from the calculated stationary shape of the liquid pool (Fig. 3). -More recently, this approach has been used to analyze dendriti microstructures produced in electron beam welding of stainless stee 96
  • 97. Cont’d It was shown, from the macroscopic shape of the liquid pool, that a simple criterion of minimum undercooling, that is, of minimum speed, can be applied to determine which dendrite trunk orientation is selected. 97
  • 98. Calculated stationary shape (a) of the liquid pool that forms during laser treatment of an aluminumcopper eutectic alloy surface. The laser, with 1500 W of total power focused onto a spot 0.2 mm (0.008 in.) in diameter, is moving to the right with a velocity vb of 1 m/s (3.2 ft/s). Absorption coefficient is 0.15. Although the calculation was made in three dimensions, only the resolidifying back part of the pool within a longitudinal section is shown. (b) Lamellar spacing of the aluminum-copper eutectic alloy versus depth of the laser-treated surface as calculated from the shape of the liquid pool (a) and using the recent theory of eutectic formation. 98
  • 99. Transverse section micrograph (a) of electron beam weld of an Fe-15Ni-15Cr single crystal. The electron beam was moved at a velocity of 3 mm/s (0.12 in./s) over the (001) surface along a [100] crystallographic orientation. The dendrites epitaxially grown at the monocrystalline surface of the weld can have their trunksaligned along one of the three <100> orientations. Microstructure selection is made according to a criterion of minimum undercooling (or of minimum speed); therefore, the information in this micrograph can be used to reconstruct the three-dimensional shape of the weld pool, as shown in (b) 99
  • 100. Modeling of Equiaxed Structures When dealing with equiaxed microstructures, the growth speed of the grains is no longer related to the speed of the isotherms, but rather to local undercooling (Fig. 1). Furthermore, the solidification path is also dependent on the number of grains that have been nucleated within the undercooled melt. In such a case, the approach used must relate the fraction that has solidified to the local undercooling. Microscopic Modeling of Equiaxed Structures Consider a small volume element V of uniform temperature T, within which equiaxed solidification (Fig. 5) is proceeding. At a given time t, the fraction of solid fs(t) is given by where n(t) is the density of the grains, R(t) is the average equiaxed grain radius characterizing the position of the dendrite tips or that of the eutectic front, and fi(t) is the internal fraction of solid. For eutectics, the grains are fully solid, and accordingly fi(t) = 1 at any time. For dendritic alloys, fi(t) represents the fraction of the grains that is really solid. 100
  • 101. Schematic showing equiaxed dendritic and eutectic solidification To predict the evolution of the solid fraction fs(t), one must relate the three variables n(t), R(t), and fi(t) to the undercooling ΔT. This can be done by considering nucleation kinetics, growth kinetics, and, for dendrites, solute diffusion. Nucleation Kinetics. The rate n (t) at which new grains are heterogeneously nucleated within the liquid can be given at low undercooling by 101
  • 102. Cont’d • where K1 is proportional to a collision frequency with nucleation sites, n0 is the total number of sites present in the melt before solidification, and K2 is a constant related to the interfacial energy between substrate and nucleated grain. The constants K1, n0 and K2 must be deduced from experiment. Once they are known, the grain density n(t) can be predicted at each time by integrating Eq 11 over time or temperature: However, this approach fails to predict the correct grain density, in part because the temperature interval within which nucleation proceeds is very narrow. For an undercooling ΔT smaller than a critical value, ΔTN = 2 k , there is no significant nucleation. When ΔTN is reached, n(t) increases very rapidly to its saturation limit n0 (Fig. 6 and 7). Therefore, it is suggested to replace the complex nucleation law of Eq 11 by a Dirac function in solidification modeling: 102
  • 103. If more than one type of nucleation site is present, one can introduce a set of Dirac functions (Fig. 6): This discrete distribution of nucleation site types can also be replaced by a continuous distribution (Fig. 8). Although this last approach may not reflect the complex phenomena of heterogeneous nucleation, it has some advantages in microscopic modeling of solidification. 103
  • 104. Schematic of heterogeneous nucleation occurring on a family of inoculant sites, characterized by a density of sites n0,i and by a critical temperature TN,i at which nucleation occurs Calculated relationship between nucleation rate and undercooling in cost iron. 104
  • 105. Continuous distribution of nucleation site types. In fact, a continuous distribution of nucleation site types can be replaced by a very narrow distribution if one only wants to simulate heterogeneous nucleation occurring at a given undercooling ΔTN with a given density of sites n0 (Eq 13). This last approach can be used for eutectic solidification based on the fact that, the nucleation interval is very narrow. For example, for cast iron, the nucleation interval was calculated to be about 0.1 °C (0.2 °F) . 105