1. Introduction
The upper heights (p95) of the Norway spruce
stands derived automatically from ALS point clouds has
become very important information in studies on
mountain vegetation.
The digital photogrammetry is offering nowadays
3D point clouds derived with the so called stereo-
matching approach. The role of ALS is still important
as information about DTM helping with CHM
modeling.
50 m
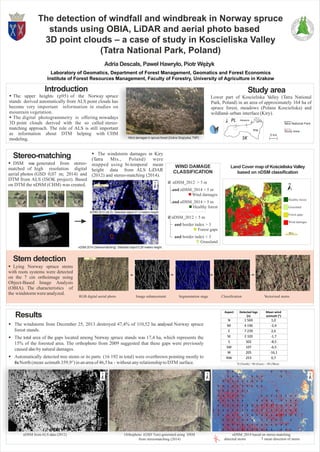
nDSM 2012 (ALS). Selected object 21,3 meters height
nDSM 2014 (Stereomatching). Selected object 0,28 meters height
Study area
Lower part of Koscieliska Valley (Tatra National
Park, Poland) in an area of approximately 164 ha of
spruce forest, meadows (Polana Koscieliska) and
wildland–urban interface (Kiry).
Stereo-matching
DSM was generated from stereo-
matched of high resolution digital
aerial photos (GSD 0,07 m; 2014) and
DTM from ALS (ISOK project). Based
on DTM the nDSM (CHM) was created.
The windstorm damages in Kiry
(Tatra Mts., Poland) were
mapped using bi-temporal mean
height data from ALS LiDAR
(2012) and stereo-matching (2014).
Vectorized stemsRGB digital aerial photo Image enhancement
15 m
Stem detection
Lying Norway spruce stems
with roots systems were detected
on the 7 cm orthoimage using
Object-Based Image Analysis
(OBIA). The characteristics of
the windstormwereanalyzed.
Segmentation stage Classification
5 km
Tatra National Park
Study area
Wind damages in spruce forest (Dolina Strążyska; TNP)
Land Cover map of Kościeliska Valley
based on nDSM classification
WIND DAMAGE
CLASSIFICATION
if nDSM_2012 > 5 m
and nDSM_2014 < 5 m
Wind damages
and nDSM_2014 > 5 m
Healthy forest
if nDSM_2012 < 5 m
and border index > 3
Forest gaps
and border index < 3
Grassland
Healthy forest
Grassland
Forest gaps
Wind damages
150 m
Results
The windstorm from December 25, 2013 destroyed 47,4% of 110,52 ha analysed Norway spruce
forest stands.
The total area of the gaps located among Norway spruce stands was 17,4 ha, which represents the
15% of the forested area. The orthophoto from 2009 suggested that these gaps were previously
caused also by natural damages.
Automatically detected tree stems or its parts (16 192 in total) were overthrown pointing mostly to
theNorth(mean azimuth 359,9°)inanareaof46,5ha - withoutanyrelationship toDTM surface.
nDSM fromALS data (2012) Orthophoto (GSD 7cm) generated using DSM
from stereomatching (2014)
nDSM_2014 based on stereo-matching
detected stems mean direction of stems
Aspect Detected logs
(n)
Mean wind
azimuth (°)
N 1 569 1,0
NE 4 196 -2,4
E 7 239 2,6
SE 2 320 -1,7
S 302 -8,5
SW 107 -6,5
W 205 -16,1
NW 253 0,7
The detection of windfall and windbreak in Norway spruce
stands using OBIA, LiDAR and aerial photo based
3D point clouds – a case of study in Koscieliska Valley
(Tatra National Park, Poland)
Adria Descals, Paweł Hawryło, Piotr Wężyk
Laboratory of Geomatics, Department of Forest Management, Geomatics and Forest Economics
Institute of Forest Resources Management, Faculty of Forestry, University of Agriculture in Krakow
Zakopane
SK
PL
TPN
*0 (North) / 90 (East) / -90 (West)