1. Results
Extracellular vesicles (EVs) have been found in every body fluid
examined, but little is known about their abundance, cargo, or function in
cervicovaginal secretions (CVS). Previous work in our lab demonstrated
decreased particle concentrations in CVS of a rhesus macaque with
endometriosis compared with secretions of reproductively normal rhesus
and pigtailed macaques. For reliable interpretation of these data, more
information is needed on the influence of factors, including the menstrual
cycle (MC). In this study, we aimed to characterize changes in particle
count and RNA expression changes in EVs during MC in simian
immunodeficiency virus (SIV)-infected and uninfected rhesus macaques.
Nanoparticle Tracking Analysis (NTA) showed an increase in EV
concentration in the week following the progesterone peak in uninfected
macaques. SIV-infected macaques did not show any significant changes in
hormone levels across the five-week period, suggesting MC irregularities.
Similar findings for HIV have been sporadically reported in human, but
are unreported in the nonhuman primate literature.
Analysis of the miRNA from each fraction obtained during isolation of the
EVs, via TaqMan Low-Density Array (TLDA), revealed a significant
clustering of miRNA by fraction and at least one significantly upregulated
miR in the infected animal EVs as compared to the healthy controls.
Our initial results suggest that MC may affect EV concentration in CVS
and should be taken into account in future studies. Additional studies of
cervicovaginal EV and their RNA cargo are merited to further characterize
the potential role of EV and specific small RNAs as markers for any
manifestation of reproductive tract disease.
Abstract
Quantify the contribution of bacteria to EV counts through
bacterial RNA or outer membrane protein analysis.
Further investigate the pattern of EV particle concentration
fluctuation with different phases of the menstrual cycle.
In light of recent data demonstrating a inhibitory effect of
“exosomes” on an early stage of the HIV-1 life cycle, further
investigation into the mechanisms of miRNA regulation of in
vitro cultures is warranted
References
1. Witwer et al., 2013. Journal of extracellular vesicles
2. Ezechi et al., 2010. The Journal of Obstetrics and Gynaecology
Research.
3. Smith, J. A. & Daniel, R., 2016. AIDS.
Discussion / Further Directions
Results
Conclusions
• Hormonal data suggests that SIV-infected animals are likely not
experiencing regular menstrual cycle. There is evidence of
amenorrhea in humans associated with HIV2, but to our
knowledge this has not been reported in primate literature.
• There is encouraging preliminary nanoparticle concentration
data demonstrating a peak in particle concentration in the week
after the progesterone peak in the uninfected animals. These
results suggest that menstrual cycle may affect EV
concentration in cervicovaginal secretions and should be taken
into account in future studies.
• We have used TLDA to provide the first profile of miRNAs
from EVs from the CVL compartment.
• While only a handful of miRNA showed differential expression
in infected animals versus healthy controls from the EV fraction
(UCP), findings are consistent previous reports of upregulation
in people.
Objectives
• Collect samples of cervicovaginal secretions from SIV-infected and
healthy rhesus macaques.
• Determine changes in size and abundance of particles throughout the
menstrual cycle and between SIV-infected and healthy rhesus macaques
using nanoparticle tracking analysis.
• Characterize particles found in cervicovaginal secretions and vaginal
swabs using transmission electron microscopy.
• Profile miRNA from 10,000xg pellet (10K), 100000xg supernatant
(USN) and pellet (UCP)
• Determine how these data might affect measurements of EVs in donor
patients.
Methods
Sample Collection
Cervicovaginal lavage (CVL), and whole blood collection were performed weekly
for five weeks from two healthy, uninfected Rhesus macaques and four
SIVmac251-infected individuals.
Hormone Analysis
Platelet free plasma was analyzed for levels of estradiol and progesterone to
correlate particle counts with phase of MC.
EV visualization and concentration
Nanoparticle tracking analysis (NTA) was performed on whole CVL and EV
fractions enriched by stepped centrifugation. EV existence was verified with
Western Blot experiment using CD63 antibody.
Small RNA Evaluation
Total RNA was obtained from fractions using an optimized method for biofluids
RNA extraction. miRNAs from each fraction were profiled on a custom array by
TaqMan low density array (TLDA). Statistical analysis was done for the array data
and RT-qPCRs were performed to validate profiling results.
This research was supported by NIH NIDA R01-DA040385, NIH T32-
OD011089, the Johns Hopkins University Center for AIDS Research, an
NIH funded program (P30AI094189), and the Department of Molecular and
Comparative Pathobiology. The content is solely the responsibility of the
authors and does not necessarily represent the official views of the sponsors.
Contact: Zhao (zzhao23@jhu.edu), Muth (dillon.muth@jhmi.edu), Witwer
(kwitwer1@jhmi.edu)
Acknowledgements and funding:
B
CA
Results
A B C
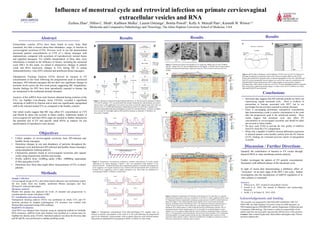
Figure 4. Transmission electron micrographs of CVL pellet from 1000xg spin (A) and 110,000xg
spin (B). Images show EVs and rod-shaped bacteria with flagella. C) Western blot of 9 representative
samples from ultracentrifuged pellet. Significant smear for CD63 (34 kDA) noted for all but one
samples.
Figure 5. Multiple normalizations of TLDA data of all fractions of CVL data. Raw Cts, quantile
normalization and geometric means are all depicted. A) For Raw Ct values, significant cluster of the
UC Supernatant fraction is appreciable, indicating a greater presence of miRNA in that fraction for
almost all samples. A few animals partially cluster together across several weeks and sample
fractions, including Control 2 and Infected 2 and 3. No clustering of animal by infection status is
visible. No bias is present for week of collection, as all samples appear to be relatively well
distributed. B) A similar pattern is visible in data that has been normalized by quantiles. The UC
supernatant fraction clusters together again as in A), but unlike A) no animals appear to cluster
together. As in A) no pattern is appreciated for week of collection, menstruation status or infection
status. C) Using geometric mean normalization, the previously observed pattern of UC supernatant
clustering together is no longer present. Instead, the only small pattern that is noticed is a mild
clustering of three animals: Control 2, Infected 2 and Infected 4. In addition, no pattern by week of
collection, menstruation or infections status is present.
Figure 1. Specimen Collection Kit and Experimental layout. A) The kit used for collection of blood,
CVL and VS samples. CVL was performed with syringe containing 3mL and drawback was used to
collect wash. 2 cotton applicators were used in succession to swab the vaginal canal. Each swab was
placed in 2mL of 1x PBS and liberated per outlined protocol B) CVL and Swab 1 samples were
processed using differential ultracentrifugation to create EV enriched fractions. Portions of samples
were set aside for NanoSight analysis (NS) and RNA isolation as indicated. C) Workflow for
processing of samples.
A B Relative
AbundanceRank
onqPCR
miRNA Rankof relative
abundanceon
TLDA
1 223 1
2 16 3
3 222 2
4 19a 9
5 200c 4
6 186 6
7 181a 8
8 106a 5
9 125b 10
10 193b 7
11 451 11
12 375 N/A
Quantile
Normalization
Geometric
Mean
hsa-mir-222hsa-mir-200c
UC Pellet
hsa-mir-186
Infected vs. Uninfected
Figure 6. qPCR relative abundance verifies findings of TLDA array for UCP. A) Analysis of
both data normalized to a geometric mean of the 10 most invariant miRNA on the TLDA
profile and normalized by quantiles reals a consistent upregulation of mir-186. miR-200c and
miR-222 are also upregulated, but only appear so in each of the respective normalizations B)
Individual qPCR assays performed on all UC pellet samples reveals a profile of relative
abundance that is fairly similar to that seen on TLDA. The three highlighted miRNAs represent
those which had a significant ranking change (>3 ranks) on the list of 12 miRNAs for which
individual RT-qPCR was performed.
Figure 2. Progesterone concentrations compared to estradiol concentrations in weekly sample
collections in six rhesus macaques. Controls 1 and 2 are uninfected, while Infected 1-4 are
infected with SIV. Uninfected animals show characteristic patterns in estradiol and progesterone
levels suggestive of a regular menstrual cycle, while the SIV infected animals show no pattern in
hormone levels, suggesting a lack of regular menstrual cycle. Data points are duplicated for
second group of Week 1 to Week 5 to show trend.
W
eek
1
W
eek
2
W
eek
3
W
eek
4
W
eek
5
W
eek
1
W
eek
2
W
eek
3
W
eek
4
W
eek
5
0
100
200
300
400
0
1
2
3
EstradiolConcentration(pg/mL)
Theoretical Estradiol and Progesterone Concentrations
During Normal Menstrual Cycle
ProgesteroneConcentration(ng/mL)
W
eek
1
W
eek
2
W
eek
3
W
eek
4
W
eek
5
W
eek
1
W
eek
2
W
eek
3
W
eek
4
W
eek
5
0
50
100
150
200
250
0
1
2
3
4
5
EstradiolConcentration(pg/mL)
Control 1
ProgesteroneConcentration(ng/mL)
W
eek
1
W
eek
2
W
eek
3
W
eek
4
W
eek
5
W
eek
1
W
eek
2
W
eek
3
W
eek
4
W
eek
5
0
50
100
150
200
250
0
1
2
3
4
5
EstradiolConcentration(pg/mL)
Control 2
ProgesteroneConcentration(ng/mL)
W
eek
1
W
eek
2
W
eek
3
W
eek
4
W
eek
5
W
eek
1
W
eek
2
W
eek
3
W
eek
4
W
eek
5
0
50
100
150
200
250
0
1
2
3
4
5
EstradiolConcentration(pg/mL)
Infected 2
ProgesteroneConcentration(ng/mL)
W
eek
1
W
eek
2
W
eek
3
W
eek
4
W
eek
5
W
eek
1
W
eek
2
W
eek
3
W
eek
4
W
eek
5
0
50
100
150
200
250
0
1
2
3
4
5
EstradiolConcentration(pg/mL)
Infected 1
ProgesteroneConcentration(ng/mL)
W
eek
1
W
eek
2
W
eek
3
W
eek
4
W
eek
5
W
eek
1
W
eek
2
W
eek
3
W
eek
4
W
eek
5
0
50
100
150
200
250
0
1
2
3
4
5
EstradiolConcentration(pg/mL)
Infected 3
ProgesteroneConcentration(ng/mL)
W
eek
1
W
eek
2
W
eek
3
W
eek
4
W
eek
5
W
eek
1
W
eek
2
W
eek
3
W
eek
4
W
eek
5
0
50
100
150
200
250
0
1
2
3
4
5
EstradiolConcentration(pg/mL)
Infected 4
ProgesteroneConcentration(ng/mL)
W
eek
1
W
eek
2
W
eek
3
W
eek
4
W
eek
5
W
eek
1
W
eek
2
W
eek
3
W
eek
4
W
eek
5
0
2×10⁹
4×10⁹
6×10⁹
0
1
2
3
4
5
Particles/mL
Control 1
ProgesteroneConcentration(pg/mL)
W
eek
1
W
eek
2
W
eek
3
W
eek
4
W
eek
5
W
eek
1
W
eek
2
W
eek
3
W
eek
4
W
eek
5
0
2×10⁹
4×10⁹
6×10⁹
0
1
2
3
4
5
Particles/mL
Infected 1
ProgesteroneConcentration(pg/mL)
W
eek
1
W
eek
2
W
eek
3
W
eek
4
W
eek
5
W
eek
1
W
eek
2
W
eek
3
W
eek
4
W
eek
5
0
2×10⁹
4×10⁹
6×10⁹
0
1
2
3
4
5
Particles/mL
Infected 3
ProgesteroneConcentration(pg/mL)
W
eek
1
W
eek
2
W
eek
3
W
eek
4
W
eek
5
W
eek
1
W
eek
2
W
eek
3
W
eek
4
W
eek
5
0
2×10⁹
4×10⁹
6×10⁹
0
1
2
3
4
5
Particles/mL
Control 2
ProgesteroneConcentration(pg/mL)
W
eek
1
W
eek
2
W
eek
3
W
eek
4
W
eek
5
W
eek
1
W
eek
2
W
eek
3
W
eek
4
W
eek
5
0
2×10⁹
4×10⁹
6×10⁹
0
1
2
3
4
5
Particles/mL
Infected 1
ProgesteroneConcentration(pg/mL)
W
eek
1
W
eek
2
W
eek
3
W
eek
4
W
eek
5
W
eek
1
W
eek
2
W
eek
3
W
eek
4
W
eek
5
0
2×10⁹
4×10⁹
6×10⁹
0
1
2
3
4
5
Particles/mL
Infected 4
ProgesteroneConcentration(pg/mL)
Figure 3. Nanoparticle concentrations from ultra-centrifuged CVL samples show an
increase in particle concentration in the week of or the week following the progesterone
peak in the uninfected, cycling animals, with no pattern observed in the infected animals.
Data points are duplicated for second group of Week 1 to Week 5 to show trend.
Influence of menstrual cycle and retroviral infection on primate cervicovaginal
extracellular vesicles and RNA
Zezhou Zhao1, Dillon C. Muth1, Kathleen Mulka1, Lauren Ostrenga1, Bonita Powell1, Kelly A. Metcalf Pate1, Kenneth W. Witwer1,2
1Molecular and Comparative Pathobiology and 2Neurology, The Johns Hopkins University School of Medicine, USA