Assessing the quantity and connectivity of urban green spaces on private lands in the Osaka metropolitan region, Japan

1) This study analyzed the quantity and connectivity of green spaces on private lands in the Osaka metropolitan region of Japan using satellite imagery and GIS data on land use and zoning districts. 2) The results showed that over 50% of green spaces are part of large patches over 10 hectares or very small patches under 0.1 hectares. The ratio and connectivity of green spaces varied significantly based on the slope and zoning district of the land. 3) Residential zoning districts generally had higher green coverage but more fragmented connectivity, while lands with steeper slopes in suburban areas tended to have higher green coverage ratios. Differences in green space distribution were also observed between zoning districts located in the same slope category.
Recommended

Recommended
More Related Content
Recently uploaded
Recently uploaded (20)
Featured
Featured (20)
Assessing the quantity and connectivity of urban green spaces on private lands in the Osaka metropolitan region, Japan
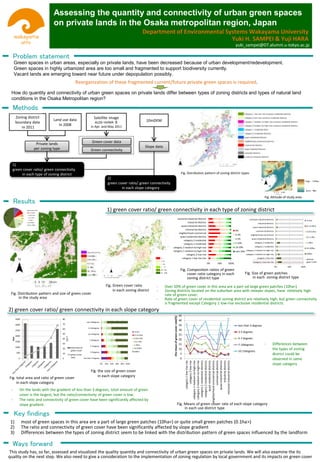
- 1. 0 5 10 15 20 25 30 35 40 45 category 1 low rise-rise category 2 low-rise category 1 medium-to-high-rise category 2 medium-to-high-rise category 1 residential districts category 2 residential districts quasi-residential districts neighborhood commercial districts commercial districts quasi-industrial districts industrial districts exclusive industrial districts the mean of green cover rate(%) less than 3 degrees 3-5 degrees 5-7 degrees 7-10degrees 10-15degrees 0% 50% 100% category 1 low rise-rise category 2 low-rise category 1 medium-to-high-rise category 2 medium-to-high-rise category 1 residential category 2 residential quasi-residential districts neighborhood commercial commercial districts quasi-industrial districts industrial districts exclusive industrial districts -0.1ha 0.1-0.25ha 0.25-0.5ha 0.5-1.0ha 1-10ha 10-100ha 100ha- without green cover 1) most of green spaces in this area are a part of large green patches (10ha<) or quite small green patches (0.1ha>) 2) The ratio and connectivity of green cover have been significantly affected by slope gradient 3) Differences between the types of zoning district seem to be linked with the distribution pattern of green spaces influenced by the landform How do quantity and connectivity of urban green spaces on private lands differ between types of zoning districts and types of natural land conditions in the Osaka Metropolitan region? Problem statement Green spaces in urban areas, especially on private lands, have been decreased because of urban development/redevelopment. Green spaces in highly urbanized area are too small and fragmented to support biodiversity currently. Vacant lands are emerging toward near future under depopulation possibly. Department of Environmental Systems Wakayama University Yuki H. SAMPEI & Yuji HARA Assessing the quantity and connectivity of urban green spaces on private lands in the Osaka metropolitan region, Japan Results Satellite image ALOS・AVNIR-Ⅱ in Apr. and May 2011 Green cover data Zoning district boundary data In 2011 Land use data In 2008 Private lands per zoning type 10mDEM Slope data Green connectivity 1) green cover ratio/ green connectivity in each type of zoning district 2) green cover ratio/ green connectivity in each slope category Reorganization of these fragmented current/future private green spaces is required. 0 10 20 30 40 50 60 70 80 0 500 1000 1500 2000 2500 3000 3500 ( % ) (ha) total area of green cover green cover ratio 0% 20% 40% 60% 80% 100% less than 3 degrees 3-5degrees 5-7degrees 7-10degrees 10-15degrees 15-30degrees over 30degrees -0.1ha 0.1-0.25ha 0.25-0.5ha 0.5-1.0ha 1-10ha 10-100ha 100ha- Key findings Fig. total area and ratio of green cover in each slope category Fig. the size of green cover in each slope category Ways forward Methods 2) green cover ratio/ green connectivity in each slope category 1) green cover ratio/ green connectivity in each type of zoning district Fig. Distribution pattern and size of green cover in the study area Fig. Green cover ratio in each zoning district 11% 7% 5% 6% 18% 12% 41% less than 0.1ha 0.1-0.25ha 0.25-0.5ha 0.5-1.0ha 1-10ha 10-100ha over 100ha 0% 50% 100% category 1 low rise-rise category 2 low-rise category 1 medium-to-high-rise category 2 medium-to-high-rise category 1 residential category 2 residential quasi-residential districts neighborhood commercial commercial districts quasi-industrial districts industrial districts exclusive industrial districts 0% 0-3% 3-5% 5-10% 10-20% over 20% Fig. Composition ratios of green cover ratio category in each zoning district type Fig. Size of green patches in each zoning district type Fig. Means of green cover rate of each slope category in each use district type - Over 50% of green cover in this area are a part od large green patches (10ha<) - Zoning districts located on the suburban area with steeper slopes, have relatively high rate of green cover. - Rate of green cover of residential zoning district are relatively high, but green connectivity is fragmented except Category 1 low-rise exclusive residential districts. - Differences between the types of zoning district could be observed in same slope category This study has, so far, assessed and visualized the quality quantity and connectivity of urban green spaces on private lands. We will also examine the its quality on the next step. We also need to give a consideration to the implementation of zoning regulation by local government and its impacts on green cover Fig. Distribution pattern of zoning district types Fig. Altitude of study area - On the lands with the gradient of less than 3 degrees, total amount of green cover is the largest, but the ratio/connectivity of green cover is low. - The ratio and connectivity of green cover have been significantly affected by slope gradient. yuki_sampei@07.alumni.u-tokyo.ac.jp