1. WebTree Consulting
A Classification Approach for Course Selection Prediction
Andrew Becker and Brandon Liang
{anbecker,brliang}@davidson.edu
Davidson College
Davidson, NC 28035
U.S.A.
Abstract
Davidson College uses a system called WebTree to assign
courses to students each semester. For this project, we used a
classification approach to predict whether a student will suc-
cessfully get his or her course of interest under Davidson Col-
lege’s WebTree system. Employing machine learning tech-
niques on four semesters of WebTree submission data from
previous two school years, we created a Random Forest Clas-
sification model that can predict with 87% surety whether or
not a student will receive a course if it is placed at a given
position on the student’s WebTree.
1 Introduction
WebTree
Course selection and scheduling has always been a compli-
cated task for college administrators. In a perfect world, a
student would receive exactly the courses he or she wants.
However, this seldom occurs in real life as there are many
more factors to take into consideration. What if a class is
full? Who gets the priority when it comes to course selec-
tion? Is this class being taken to fulfill a major requirement
or merely a distribution requirement? Has a student taken all
prerequisites required for a course, if there are any? In the
end, due to universities’ limited resources, it is almost im-
possible to assign all students every course they want. Many
schools accept this as an unavoidable problem and ignore
it. For example, in some universities, the course selection
procedure is based on a first-come, first-serve principle; reg-
istration for all courses opens at the same time and a course
is available until it is full. Under such systems, it usually
turns out that the popular courses are filled within minutes.
Many students can potentially find themselves unable to ac-
quire important courses and the university servers often face
serious pressure.
Davidson College, on the other hand, as a small liberal arts
college, employs a different course selection system called
WebTree. Its algorithm will be explained in detail in the next
section, but its main objective is to address student priority,
course availability and course preference when it comes to
determining whether or not a student will get a course. It
also allows students to include backup courses in case they
fail to get their top choices. The WebTree system aims to
raise the level of fairness for the student body while trying
to help students get their top choices. Notwithstanding its
benefits, the WebTree system is not a guarantee of success
for course selection; moreover, most incoming students and
underclassmen have a hard time understanding the underly-
ing strategies of the WebTree system. As a result, the aver-
age student will typically receive three out of their top four
courses via WebTree for the upcoming semester. To secure
a spot in the fourth course, the student has to go through the
Add-Drop period to make adjustment to his new schedule.
While WebTree certainly helps students get the courses they
want, it is by no means perfect as it is only effective to the
extent that those employing it use it well.
The challenge then arises: how can we improve the stu-
dent experience at Davidson by helping students find more
success in course selection? A large-scale solution might
involve a complete redesign of the underlying WebTree al-
gorithm. Rather than redesigning the system, we decided to
approach the problem by designing a model that advises in-
dividual students whether or not they are likely to get their
courses of interest. This would allow them to make more in-
formed decisions and get more success out of WebTree. The
complicated problem of how to arrange a WebTree thus be-
comes a simple binary classification problem of predicting
whether or not a student is to receive a certain course given
relevant information and where the course is placed on his
WebTree. We envisioned this model to become a helpful and
reliable tool that can aid students who are not sure whether
or not they will get the courses they desire.
The rest of the article covers the WebTree algorithm, data
adjustment, data pre-processing, experiment setup, results
and conclusions.
2 Background
The WebTree Algorithm
The WebTree system is a unique system designed and em-
ployed by Davidson College in assigning courses to stu-
dents. Each student submits a form indicating which courses
they would like to take. On this submission form, there are 4
“trees”, the first three of which are identical and the fourth of
which is simply an ordered list of four courses. In assigning
the first course for each student, the WebTree algorithm first
looks at the top course on the first tree. If the course is full,
the algorithm moves on to the first course on the student’s
2. second tree, and so on. Once a course has been assigned,
the algorithm is locked into the tree below it. In determining
the next course at any given point, the algorithm prioritizes
the course to the left over the course to the right. In the
event that a dead end is reached, the algorithm looks to the
courses on the fourth tree, assigning them sequentially so
long as the class is not full and the student does not yet have
four courses assigned.
The order in which students are assigned courses is deter-
mined by two factors - the student’s class year, and a set of
four semi-random lottery numbers1
. Students in the senior
class are the first to be assigned a course, as determined by
their first lottery number. Next, the juniors are assigned their
first course, and so on. After all students have been assigned
one course, the same is repeated for the second course.
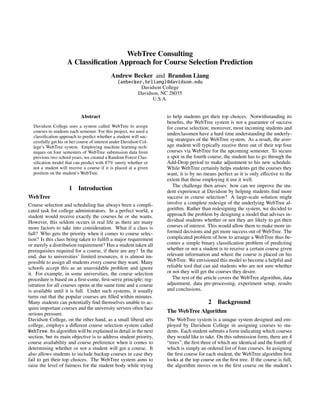
Figure 1: An illustration of branch positioning for one of
the first three trees. The numbering follows the order of a
breadth-first search and the arrows illustrate the orders of
branch positions once the top course (at position 1) is as-
signed.
Data
WebTree Submission Data
We were able to obtain data of WebTree forms submitted
by the entire student body over all four semesters of the past
two academic years, 2013-2014 and 2014-2015, from the
Davidson College registrar’s office. Note that the data given
do not include a field for semi-random lottery numbers2
. Ta-
ble 1 shows an example of the raw WebTree data.
“Tree” indicates the number of the tree and “Branch” indi-
cates the branch position where the student puts the course.
(Refer back to Figure 1 for branch positioning) “ID” denotes
a unique student, “CRN” denotes the course identification
number for its very semester and ”Result” indicates the out-
come of each course selection. Table 1 features 6 students
1
The numbers are semi-random in that the first two numbers
add up to the highest possible number, as do the last two. This is
to ensure that students do not receive too much of an unfair advan-
tage/disadvantage due to their numbers.
2
Though these were once made known to students, they are now
withheld. As it turned out, the model performed well even without
taking in semi-random lottery numbers as a feature
ID 1 201 1023 353 120
Class JUNI SOPH SENI SENI FRST
CRN 10016 14189 14578 14779 10589
Tree 1 4 1 1 3
Branch 2 2 1 3 6
Ceiling 20 30 20 30 18
Major ANT ENV CHE PSY XBIO
Subject ANT PHI HIS HIS SPA
Number 370 130 255 335 102
Result AS SF CL TC AA
Table 1: A table that shows data of WebTree submission.
(Due to the layout of the article, each column is an entry.)
and the courses they each put on their WebTree. For exam-
ple, student 1 was a Junior, putting ANT370 on the second
branch position of his first tree. ANT370 had a class ceiling
of 20 students for that semester and this student happened
to be an Anthropology major. As a result, he got the class,
indicated by the result code “AS” in the last row. The reg-
istrar’s office has a detailed result code system that explains
the different causes leading to a student not getting a course.
Table 2 below shows the explanations of each result code.
Result Code Explanation Response Variable
AS Assigned 1
AA Already Assigned Omitted
CL Wrong Class Omitted
MA Major Restriction Omitted
PR Prerequisite Error Omitted
SF Section Full 0
TC Time Conflict Omitted
Table 2: A table that lists the result codes.
Response Variable-Result
As shown by the table, the result code corresponding to
a student successfully getting a course is “AS”-Assigned.
The other result codes indicates the various causes of not
getting a course. Therefore, the “Result” columns serves as
the response variable: “AS” maps to 1, indicating success,
whereas ”SF” maps to 0, indicating failure. Note that
samples with result codes other than ”AS” and ”SF” are
omitted. This will be explained in the Data Pre-processing
section.
Course Schedule Data
In addition to WebTree submission data, we also obtained
course schedules for the past four semesters from the regis-
trar’s office. Table 3 shows an example of the course sched-
ule data.
Term CRN Subj Num Days Times
201301 10008 BIO 111 T 0815-1055am
201301 10016 ANT 370 M 0130-0420pm
201301 10032 SOC 370 T R 0940-1055am
Table 3: A table that shows the course schedule data
3. “Term” indicates the semester, “CRN” is the course iden-
tification number, “Days” indicates the days of weeks where
the class meets for lecture (“R” refers to Thursdays) and
“Times” indicates the time of class meeting.
With the sufficient data we had, we proceeded to the data
pre-processing stage.
Data Pre-processing
Omission and Noise
First, going back to the result codes (refer back to Table
2), we decided to omit WebTree submission entries that end
with a result code of “AA”, which stands for “Already As-
signed”. An entry with the result code “AA” occurs when a
course selected by a student has already been assigned, from
a tree-branch position before the one at the current entry. In
other words, when an entry ends with the result code “AA”,
it means that the course the student is attempting to add must
have been successfully assigned to the same student already.
Then, this entry gives little helpful information as it’s nei-
ther a success nor a failure. In a classification problem, data
points like this serve as noise. Therefore, we decided to omit
all WebTree submission entries that end with the result code
“AA”.
Moreover, as we tried to understand the implications of
each result code, we found out that most other causes of not
successfully getting a course were technically user errors
that were unrelated to the WebTree system. “CL–Wrong
Class”, “MA–Major Restriction”, “PR–Prerequisite Error”
and “TC–Time Conflict” are avoidable errors and do not
reflect the availability of a course when it comes to a stu-
dent’s choice. ”CL” indicates that a student’s class year is
not allowed to take a course, ”MA” indicates that a student
is barred from a course because of his major, ”PR” indi-
cates the lack of a prerequisite, and ”TC” indicates that the
course’s time is in conflict with a previously assigned course.
All of these mistakes are avoidable as they are based on in-
formation that is clearly available to students. Moreover, the
only result code left, “SF-Section Full”, is really what our
model should try to predict; it indicates whether a course is
full or available for students. If the associated result code is
“SF”, then the corresponding student did not get the course;
if the associated result code is “AS”, then the corresponding
student got the course successfully.
Thus, after closely examining the deeper meanings of the
result codes, we decided to omit all data entries that did not
end with a result code of “AS” or “SF”.
Features
For each WebTree submission over the four semesters in-
cluded in the data set, we were able to access information
regarding the course requested, the student who requested
the course, and the course’s position on the student’s Web-
Tree form. In detail, here are the features we extracted from
our data:
Class Year, Tree-Branch Position, Class Ceiling, Whether
Major Equals Subject, Course (Subject + Number),
Semester, Duration and Start Time.
Categorical Features
Among all the features, class year, tree-branch position,
whether major equals subject, semester term and course
were categorical features. To convert all of the data to nu-
merical data, we used a one-vs-rest approach for each cate-
gorical feature. We found all the elements for each feature,
created a single feature for each potential value and assigned
binary values for each entry under each element in the result-
ing processed data. For example, for class year, there are
four discrete values: FRST, SOPH, JUNI and SENI; four
separate columns were created for each; for each data entry,
if the corresponding student is a Freshman, then he is as-
signed “1” under the column FRST and “0” under the other
three columns.
For whether major equals subject, there was a single col-
umn: if the major of the corresponding student matches the
subject of the course entered for that WebTree submission
entry, the student is assigned “1” under this column and “0”
otherwise.
For semester term, there were 4 columns, under the name
of “201401”, “201402”, “201501” and “201502”, each de-
noting “Fall 2013”, “Spring 2014”, “Fall 2014” and “Spring
2015”.
Note that, for the other features, the number of columns
equals the number of unique elements for each feature; for
tree-branch position, it had 25 columns because there are
25 tree-branch positions; for course, there were over 400
columns because there were over 400 different courses. The
processed data thus had over 400 new features.
Continuous Features
Other features, namely class ceiling, duration and start
time were continuous features. For duration, the course
lengths were converted to minutes, which also reflects the
frequency of class meeting every week. For start time,
the times were represented in Military Time; for instance,
11:30AM is 1130 and 2:30PM is 1430. This would reflect
the absolute position in a 24-hour day.
Table 4 shows an entry of the processed data. The cor-
responding student was a Junior, Anthropology major, who
put ANT370 on the second branch of his first tree; the course
ceiling was 20, it was the fall semester of 2013, the class
would meet on Monday, Wednesday and Friday at 11:30PM
and the student eventually got the course via WebTree.
JUNI SENI SOPH FRST 1–1
1 0 0 0 0
1–2 .... 4–4 Ceiling Major=Subj
1 0 0 20 1
ANT370 .... THE381 201401 201402
1 0 0 1 0
201501 201502 Duration Start Time Result
0 0 50 1130 1
Table 4: A table that shows the modified response variable
selection
Assumption
One restriction for this classification model is that the model
must train on data from previous semesters. Thus, the
key assumption is that the training data from the previous
4. semesters are consistent and stable with the testing data in
the future. In other words, students must act in the same
way as they do in the training semesters for the model to
be effective. Changes in student tastes, course offerings, or
strategies used by students in filling out the WebTree form
could affect accuracy.
3 Experiments
Once we had pre-processed the data to create our final
dataset, we had to determine the model that could best make
predictions using that dataset. We decided to train Ran-
dom Forest models, Neural Network models, and K Nearest
Neighbor models. Random Forest models typically work
very well out-of-the-box and Neural Networks had been rel-
atively sucessful in the past, whereas a K Nearest Neighbor
model seemed as if it would be successful in the case of
samples that are nearly identical.
The implementations of these models that we used were
the RandomForestClassifier, MLPClassifier, and KNeigh-
bors classes found in Python’s open-source scikit-learn li-
brary3
. Each class allowed for the specification of certain
hyperparameter values. We experimentally determined the
optimum values for these by setting aside a quarter of the
training set (itself 80% of the data set) as a validation set.
The hyperparameters tuned and their optimum values can
be seen in Table 5.
Model Parameter Values Tested Optimum
Random Forest n estimators 25-200 150
max features 0.1-0.8 0.37
Neural Network beta 1 0.85-0.95 0.9
beta 2 0.9-0.9999 0.997
K-NN n neighbors 1-15 3
Table 5: A table giving the hyperparameters tuned for each
model and their optimum values as determined by validation
error.
The Random Forest model’s first parameter,
n estimators, refers to the number of trees that vote
on the final classification. Higher numbers generally
resulted in higher validation set accuracy, though decreasing
returns on accuracy set in early on while the training
time continued to increase linearly as n estimators was
increased as can be seen in Figure 2. The model didn’t take
too long to train at n estimators=150, and we found that
values greater than 150 began to slightly decrease accuracy.
The next parameter, max features, is a floating point
number indicating the number of randomly selected features
for each tree to consider while it remains blind to all the
others (e.g., trees in a model with max features=0.2 will
consider 20% of the features).
Both parameters tuned for the Neural Network model are
constants used in the model’s update function and are
analogous to learning rate parameters in other models. The
n neighbors parameter for the KNN model refers to the
3
The MLPClassifier class was found in the development build
0.18.dev0 whereas the others were from stable version 0.17.1.
number of closest neighbors to consider in classifying a
sample.
Figure 2: A graph depicting fluctuations in error values
as well as training time for tuning of the Random Forest’s
n estimators parameter. Values shown are relatively sta-
ble as they are the average values from ten trials.
4 Results
The final accuracy values are reported in Table 6. Though
accuracy is not always a telling measure of a model’s effec-
tiveness in binary classification problems due to the poten-
tial for skew in the data set, the inclusion of the accuracy
of a baseline model that always guesses “true” shows that
the other models did learn significantly from the training set.
From the table, we concluded that the Random Forest model
produced the highest accuracy. Additionally, the confusion
matrix shown in Figure 7 shows that this model fared quite
well at avoiding misclassifications4
.
Model Final Test Accuracy
Baseline (guess true) 0.5590873773
Random Forest 0.8741483724
K Nearest Neighbor 0.8234292203
Neural Network 0.819322483
Table 6: Accuracy values for the tested models, averaged
over ten trials (a score of 1. corresponds to 100% accuracy).
Table 8 shows the top 10 most influential features based
on their significance scores (inversely related to each’s
p-score) as produced by scikit-learn’s SelectKBest
class.
As shown, the most significant feature is whether a course
is a student’s very first choice. The next two significant
features are the Freshmen and Senior classes. Among all
the courses, ECO211 and MAT110 are most correlated to
determining the response variable; ECO211 is Accounting,
one of the most popular courses on campus with respect to
4
The accuracy value for the data shown in the confusion matrix
may vary from that reported in Table 6 because the final accuracy
value reported is the average of multiple trials
5. Actual
True False
Predicted
True 1812 316
False 357 2799
Table 7: Confusion matrix for the Random Forest model.
Labels on the top row correspond to actual values whereas
labels on the right column correspond to predicted values.
This model had a recall score of 83.54% and a precision
score of 85.15%
the number of sections it offers each semester; MAT110 is
Calculus I, one of the most in-demand introductory courses,
which is also a popular class to fulfill Mathematics distribu-
tion requirement.
Feature Significance Score
1–1 2384.63
Freshmen 638.05
Senior 512.26
Ceiling 471.01
Major == Subject 368.67
ECO211 363.00
4–2 338.85
4–4 294.33
MAT110 268.14
1–2 259.06
Table 8: A table that shows the top 10 most significant
features as determined by scikit-learn’s SelectKBest
class which compares the ANOVA F-values for each feature
and assigns them scores accordingly.
As the scores returned did not establish whether a given
feature was positively or negatively correlated with the out-
come, we created a code that was able to test how different
binary variables positively correlated with the outcome. By
using this in tandem with the scores above, we could bet-
ter understand the effects of certain binary variables. The
positive correlation scores for the 10 most significant fea-
tures are shown in Table 9. As shown, the top position of
WebTree had a positive correlation value that outscores the
others, which makes it the most positively correlated fea-
ture; in other words, putting a course at your very top Web-
Tree position may give you the highest chance of getting that
course. Furthermore, we noticed that the Senior class had a
lower significance score than the Freshmen class, but had a
higher positive correlation value; this means that the Fresh-
men class was more correlated to the response variable, but
the Senior class was more positively correlated to the re-
sponse variable. In other words, the fact that a student is a
Freshmen may decide more in the context of the response
variable than the fact that a student is a Senior; but a Senior
student is more likely to successfully get a course he or she
desires than a Freshmen student.
Feature Positive Correlation Value
1–1 0.8755892601
Freshmen 0.4782812647
Senior 0.6800911854
Major == Subject 0.6671294689
ECO211 0.2635135135
4–2 0.2885738115
4–4 0.2607223476
MAT110 0.2226804124
1–2 0.6836195509
4–3 0.3037109375
Table 9: Selected binary features and how they correlated
with the outcome. A score of 1 would indicate that all sam-
ples where the feature == 1 are positive samples (with re-
sponse variable == 1) whereas a score of 0 would indicate
that all samples where the feature == 1 are negative sam-
ples (with response variable == 0). This table confirms the
intuitive notion that students are very likely to receive their
most desired course and very unlikely to receive their least
desired course.
5 Conclusions
After training on data and hyperparameter tuning, the
Random Forest Classifier produced the highest accu-
racy of the three models at about 0.87. Its precision and
recall scores were both slightly lower, at values of roughly
0.84. Thus, the Random Forest Classifier was the
model with the best performance and we were able to cor-
rectly predict whether a student will get the course of his
or her interest 87% of time. Moreover, from the analysis
on feature significance, the most correlated features that de-
termined the outcome of the course selection success are
whether or not the class is the student’s first choice, class
year of the student (in the cases of first-years and seniors),
and class ceiling. Among all courses, ECO211 Accounting
and MAT110 Calculus I are the most difficult to get into.
As a result, while many students don’t fully understand
WebTree and can be uncertain as to whether or not they are
likely to receive a given course, this lack of certainty can
be ameliorated in some part by the use of machine learn-
ing in conjunction with the previous data. We can provide
the student body the outcome of their course selection at a
confidence level of 87%.
Nonetheless, as we went back to our assumption, we were
not sure if our model would have been as effective if the it
were open to the entire student body, as the sensitivity to the
data would change. In other words, the underlying objective
of our prediction is to help students assure their likelihood
of getting a course in order to change their arrangement of
course submission on WebTree to optimize his or her suc-
cess rate of getting all top choices. However, if everyone
optimizes his or her arrangement, is it truly “optimal” for
everyone? It seems to defeat the purpose of the model and
Machine Learning in general. Thus, the underlying data sta-
bility and consistent sensitivity by the users are the key fac-
tors of how effective the model will be.
For future work, we could develop a user-friendly front
6. end into which course data can be entered by students to
make predictions. Furthermore, we could model the macro-
scopic effect of opening the model to the entire student
body.
6 Contributions
Both authors wrote the project proposal and abstract. Bran-
don worked on data preprocessing as well as feature signif-
icance and Andrew worked on model training and testing.
Both authors worked on the poster together. Brandon wrote
the Introduction and Background sections. Andrew wrote
the Experiments and Results sections as well as the portion
of the Background section detailing the WebTree algorithm.
Both authors worked on the Abstract and Conclusions sec-
tions, proofread and edited the article.
7 Acknowledgements
We would like to acknowledge the contributions of Marcia
Stoutjesdyk for supplying us with the data and aiding us in
interpreting result codes. We would also like to thank Dr.
Raghuram Ramanujan of Davidson College for his assis-
tance and insights.