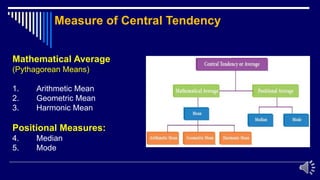
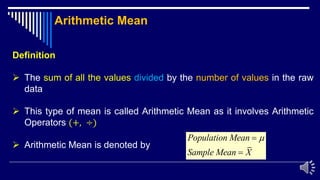
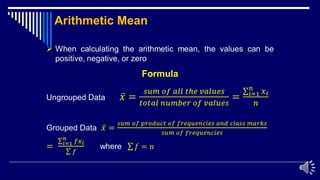
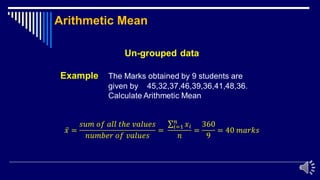
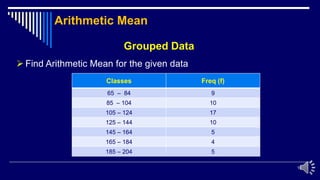
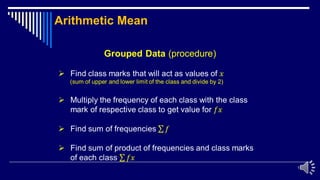
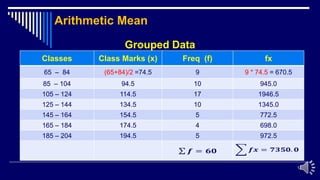
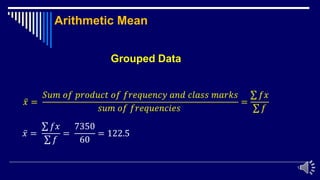
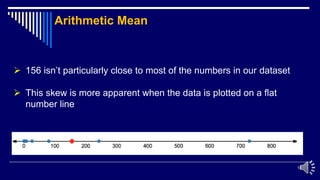
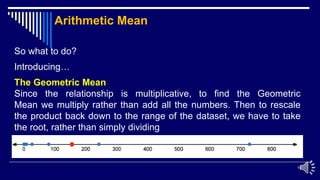
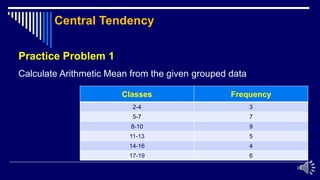
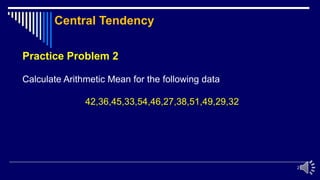
2
MATH – 361
Introduction to Probability and Statistics
Lecture No. 04
Measures of Central Tendency
Reference: Ch # 1, Sec 1.2, Text Book
No. of Slides: 22
3
After completing this lecture, students will be able to
 Interpret measure of Central Tendency
 Compute different types of Mean for ungrouped data
 Compute different types of Mean for grouped data
Desired Learning Objectives
4
Central Tendency
 Definition A single value of the data
which truly represents the whole data
or
 The tendency of the observations
to cluster in the central part of the
data set is called Central Tendency
Measure of Central Tendency
A single figure that
represents max data
5
Definition
 Measures that describe a data
set by identifying the 'central' or
middlemost value by a single
number usually described as
‘average’
Measure of Central Tendency
A single figure that tends
to lie in the middle
6
Mathematical Average
(Pythagorean Means)
1. Arithmetic Mean
2. Geometric Mean
3. Harmonic Mean
Positional Measures:
4. Median
5. Mode
Measure of Central Tendency
7
Definition
 The sum of all the values divided by the number of values in the raw
data
 This type of mean is called Arithmetic Mean as it involves Arithmetic
Operators (+, ÷)
 Arithmetic Mean is denoted by
Population Mean
Sample Mean X



Arithmetic Mean
8
Arithmetic Mean
9
Arithmetic Mean
10
Grouped Data
 Find Arithmetic Mean for the given data
Classes Freq (f)
65 – 84 9
85 – 104 10
105 – 124 17
125 – 144 10
145 – 164 5
165 – 184 4
185 – 204 5
Arithmetic Mean
11
Arithmetic Mean
12
Grouped Data
Classes Class Marks (x) Freq (f) fx
65 – 84 (65+84)/2 =74.5 9 9 * 74.5 = 670.5
85 – 104 94.5 10 945.0
105 – 124 114.5 17 1946.5
125 – 144 134.5 10 1345.0
145 – 164 154.5 5 772.5
165 – 184 174.5 4 698.0
185 – 204 194.5 5 972.5
Arithmetic Mean
13
Arithmetic Mean
ҧ
𝑥 =
𝑆𝑢𝑚 𝑜𝑓 𝑝𝑟𝑜𝑑𝑢𝑐𝑡 𝑜𝑓 𝑓𝑟𝑒𝑞𝑢𝑒𝑛𝑐𝑦 𝑎𝑛𝑑 𝑐𝑙𝑎𝑠𝑠 𝑚𝑎𝑟𝑘𝑠
𝑠𝑢𝑚 𝑜𝑓 𝑓𝑟𝑒𝑞𝑢𝑒𝑛𝑐𝑖𝑒𝑠
=
σ 𝑓𝑥
σ 𝑓
ҧ
𝑥 =
σ 𝑓𝑥
σ 𝑓
=
7350
60
= 122.5
Grouped Data
14
When to use AM
 The Arithmetic Mean is appropriate when all values in the data
sample have the same units of measure, e.g. all numbers are
heights, or dollars, or miles, etc
 Arithmetic Mean is a true mean if the dataset is of linear type
 If the dataset is of exponential type mean it involves growth rates
or interests than this mean is of no use
Arithmetic Mean (AM)
15
A simple idealized example would be a
dataset where each number is produced by
adding 3 to the previous number:
1, 4, 7, 10, 13, 16, 19…
The arithmetic mean thus gives us a
perfectly reasonable middle value
(1 + 4 + 7 + 10 + 13 + 16 + 19) ÷ 7 = 10
Arithmetic Mean
16
Not all datasets are best described by
this relationship. Some have
multiplicative or exponential relationship,
for instance if we multiplied each
consecutive number by 3 rather
than adding by 3 as we did above
1, 3, 9, 27, 81, 243, 729…
Arithmetic Mean
17
In this situation, the Arithmetic Mean is
ill-suited to produce an “average”
number to summarize this data
(1 + 3 + 9 + 27 + 81 + 243 + 729) ÷ 7
AM = 156.1
Arithmetic Mean
18
 156 isn’t particularly close to most of the numbers in our dataset
 This skew is more apparent when the data is plotted on a flat
number line
Arithmetic Mean
19
So what to do?
Introducing…
The Geometric Mean
Since the relationship is multiplicative, to find the Geometric
Mean we multiply rather than add all the numbers. Then to rescale
the product back down to the range of the dataset, we have to take
the root, rather than simply dividing
Arithmetic Mean
20
Practice Problem 1
Calculate Arithmetic Mean from the given grouped data
Classes Frequency
2-4 3
5-7 7
8-10 9
11-13 5
14-16 4
17-19 6
Central Tendency
21
Practice Problem 2
Calculate Arithmetic Mean for the following data
42,36,45,33,54,46,27,38,51,49,29,32
Central Tendency
22
Study Links
http://eagri.org/eagri50/STAM101/pdf/lec04.pdf
https://www.youtube.com/watch?v=jXKYI7wyqp0

Descriptive Statistics LECTURE N0 4.pdf

  • 2.
    2 MATH – 361 Introductionto Probability and Statistics Lecture No. 04 Measures of Central Tendency Reference: Ch # 1, Sec 1.2, Text Book No. of Slides: 22
  • 3.
    3 After completing thislecture, students will be able to  Interpret measure of Central Tendency  Compute different types of Mean for ungrouped data  Compute different types of Mean for grouped data Desired Learning Objectives
  • 4.
    4 Central Tendency  DefinitionA single value of the data which truly represents the whole data or  The tendency of the observations to cluster in the central part of the data set is called Central Tendency Measure of Central Tendency A single figure that represents max data
  • 5.
    5 Definition  Measures thatdescribe a data set by identifying the 'central' or middlemost value by a single number usually described as ‘average’ Measure of Central Tendency A single figure that tends to lie in the middle
  • 6.
    6 Mathematical Average (Pythagorean Means) 1.Arithmetic Mean 2. Geometric Mean 3. Harmonic Mean Positional Measures: 4. Median 5. Mode Measure of Central Tendency
  • 7.
    7 Definition  The sumof all the values divided by the number of values in the raw data  This type of mean is called Arithmetic Mean as it involves Arithmetic Operators (+, ÷)  Arithmetic Mean is denoted by Population Mean Sample Mean X    Arithmetic Mean
  • 8.
  • 9.
  • 10.
    10 Grouped Data  FindArithmetic Mean for the given data Classes Freq (f) 65 – 84 9 85 – 104 10 105 – 124 17 125 – 144 10 145 – 164 5 165 – 184 4 185 – 204 5 Arithmetic Mean
  • 11.
  • 12.
    12 Grouped Data Classes ClassMarks (x) Freq (f) fx 65 – 84 (65+84)/2 =74.5 9 9 * 74.5 = 670.5 85 – 104 94.5 10 945.0 105 – 124 114.5 17 1946.5 125 – 144 134.5 10 1345.0 145 – 164 154.5 5 772.5 165 – 184 174.5 4 698.0 185 – 204 194.5 5 972.5 Arithmetic Mean
  • 13.
    13 Arithmetic Mean ҧ 𝑥 = 𝑆𝑢𝑚𝑜𝑓 𝑝𝑟𝑜𝑑𝑢𝑐𝑡 𝑜𝑓 𝑓𝑟𝑒𝑞𝑢𝑒𝑛𝑐𝑦 𝑎𝑛𝑑 𝑐𝑙𝑎𝑠𝑠 𝑚𝑎𝑟𝑘𝑠 𝑠𝑢𝑚 𝑜𝑓 𝑓𝑟𝑒𝑞𝑢𝑒𝑛𝑐𝑖𝑒𝑠 = σ 𝑓𝑥 σ 𝑓 ҧ 𝑥 = σ 𝑓𝑥 σ 𝑓 = 7350 60 = 122.5 Grouped Data
  • 14.
    14 When to useAM  The Arithmetic Mean is appropriate when all values in the data sample have the same units of measure, e.g. all numbers are heights, or dollars, or miles, etc  Arithmetic Mean is a true mean if the dataset is of linear type  If the dataset is of exponential type mean it involves growth rates or interests than this mean is of no use Arithmetic Mean (AM)
  • 15.
    15 A simple idealizedexample would be a dataset where each number is produced by adding 3 to the previous number: 1, 4, 7, 10, 13, 16, 19… The arithmetic mean thus gives us a perfectly reasonable middle value (1 + 4 + 7 + 10 + 13 + 16 + 19) ÷ 7 = 10 Arithmetic Mean
  • 16.
    16 Not all datasetsare best described by this relationship. Some have multiplicative or exponential relationship, for instance if we multiplied each consecutive number by 3 rather than adding by 3 as we did above 1, 3, 9, 27, 81, 243, 729… Arithmetic Mean
  • 17.
    17 In this situation,the Arithmetic Mean is ill-suited to produce an “average” number to summarize this data (1 + 3 + 9 + 27 + 81 + 243 + 729) ÷ 7 AM = 156.1 Arithmetic Mean
  • 18.
    18  156 isn’tparticularly close to most of the numbers in our dataset  This skew is more apparent when the data is plotted on a flat number line Arithmetic Mean
  • 19.
    19 So what todo? Introducing… The Geometric Mean Since the relationship is multiplicative, to find the Geometric Mean we multiply rather than add all the numbers. Then to rescale the product back down to the range of the dataset, we have to take the root, rather than simply dividing Arithmetic Mean
  • 20.
    20 Practice Problem 1 CalculateArithmetic Mean from the given grouped data Classes Frequency 2-4 3 5-7 7 8-10 9 11-13 5 14-16 4 17-19 6 Central Tendency
  • 21.
    21 Practice Problem 2 CalculateArithmetic Mean for the following data 42,36,45,33,54,46,27,38,51,49,29,32 Central Tendency
  • 22.