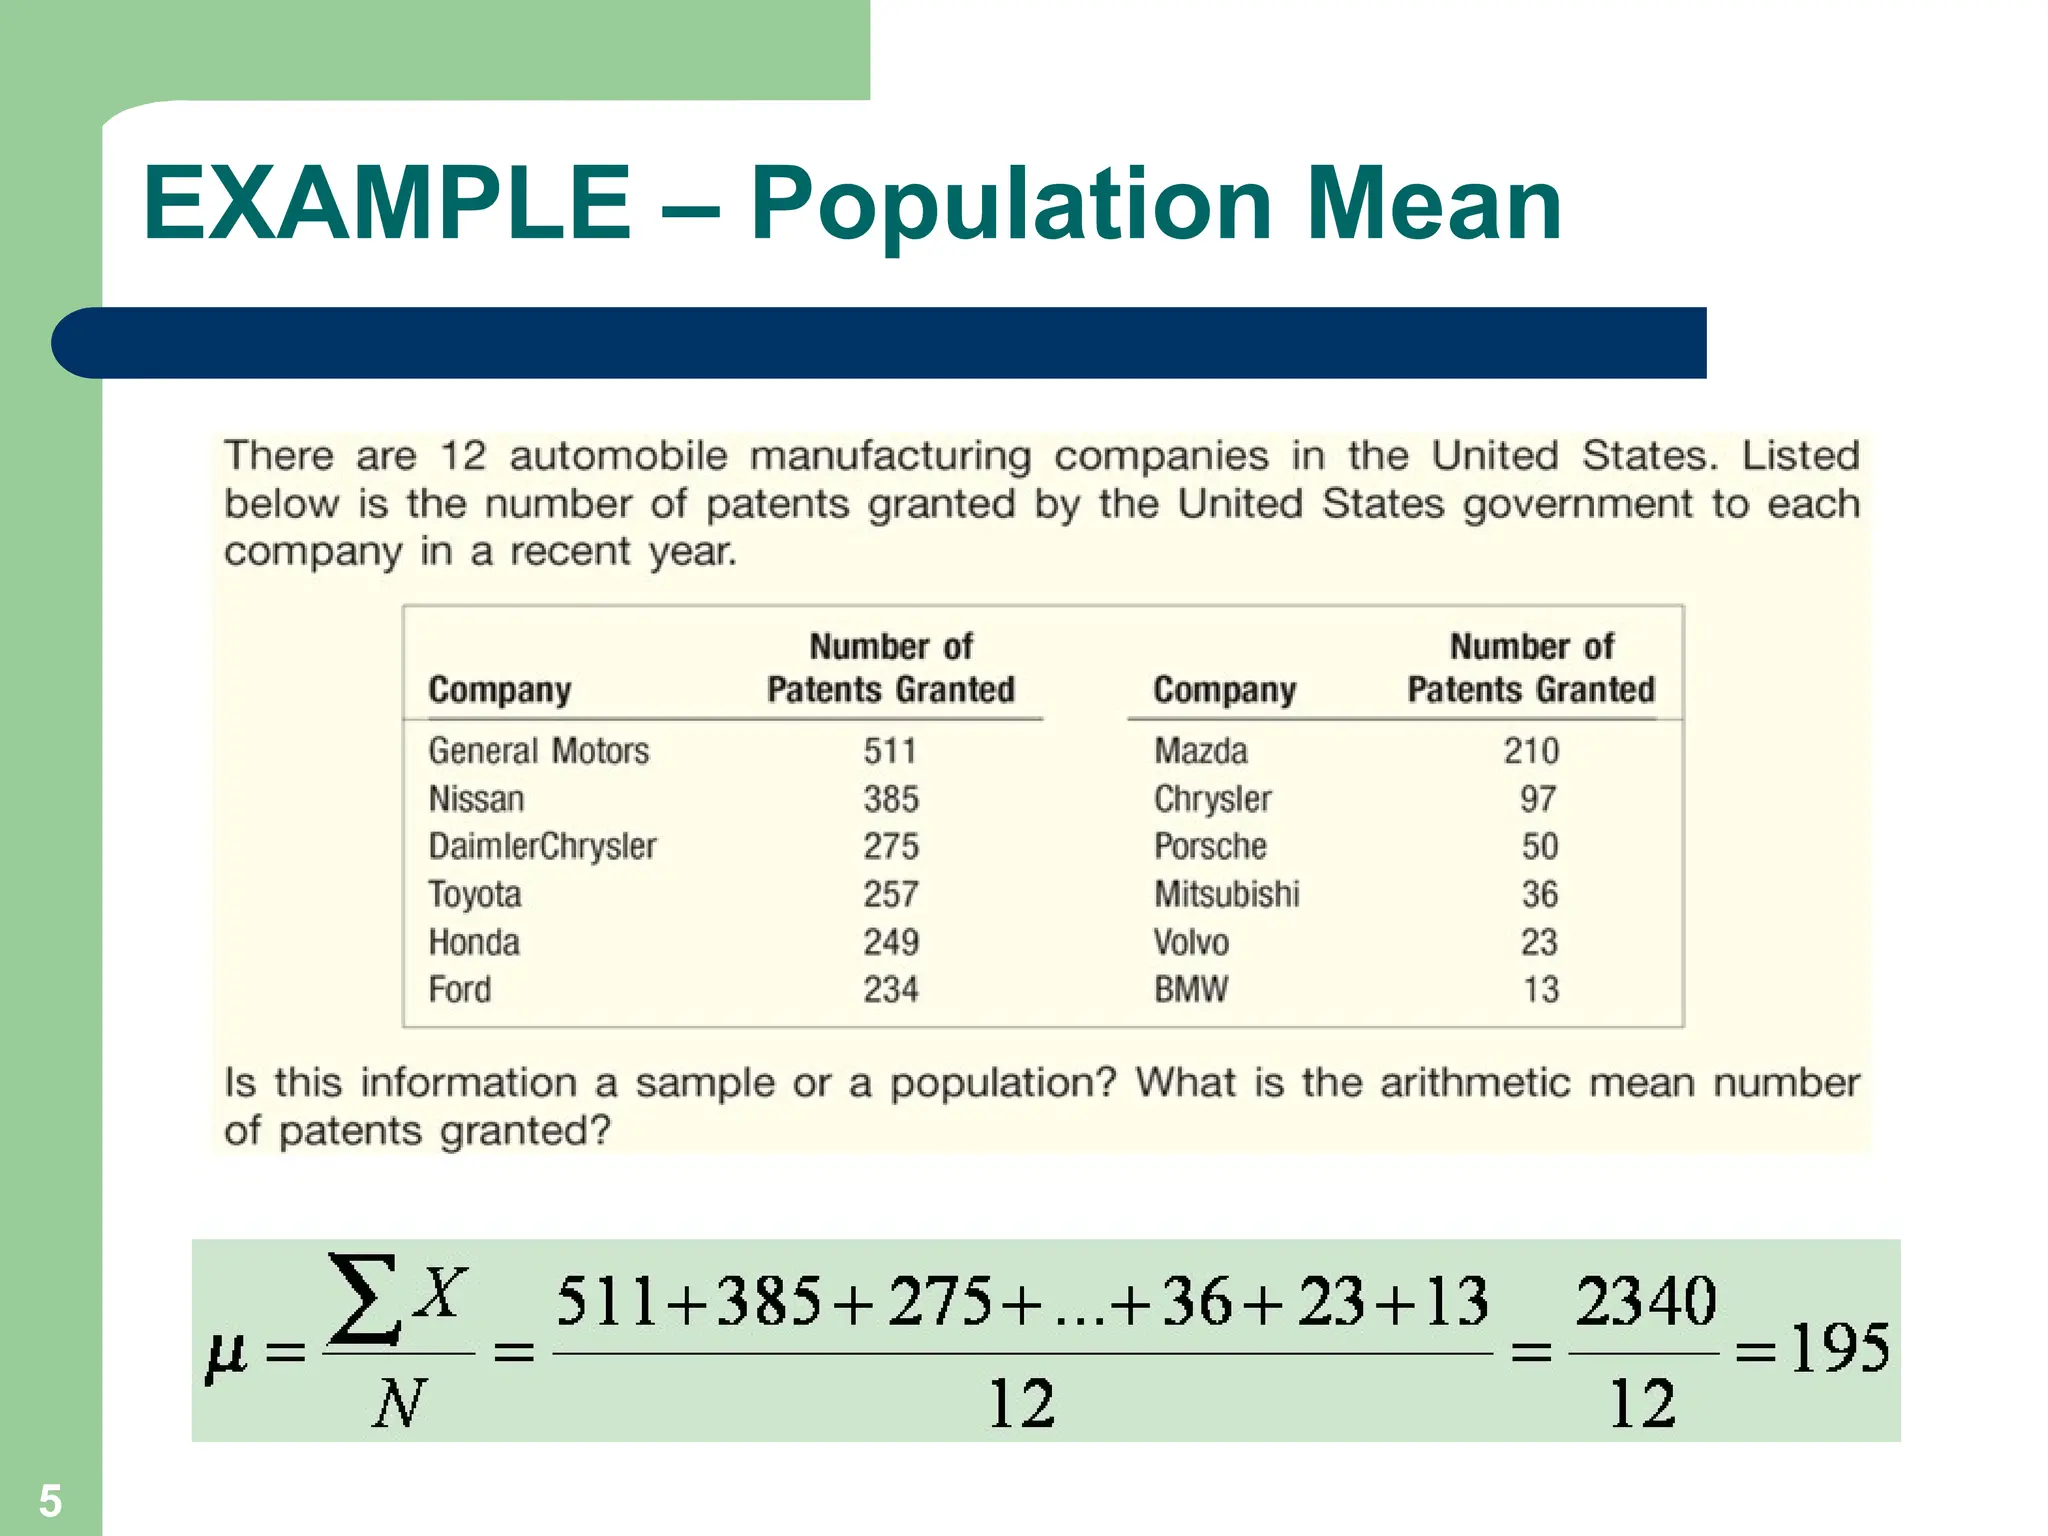
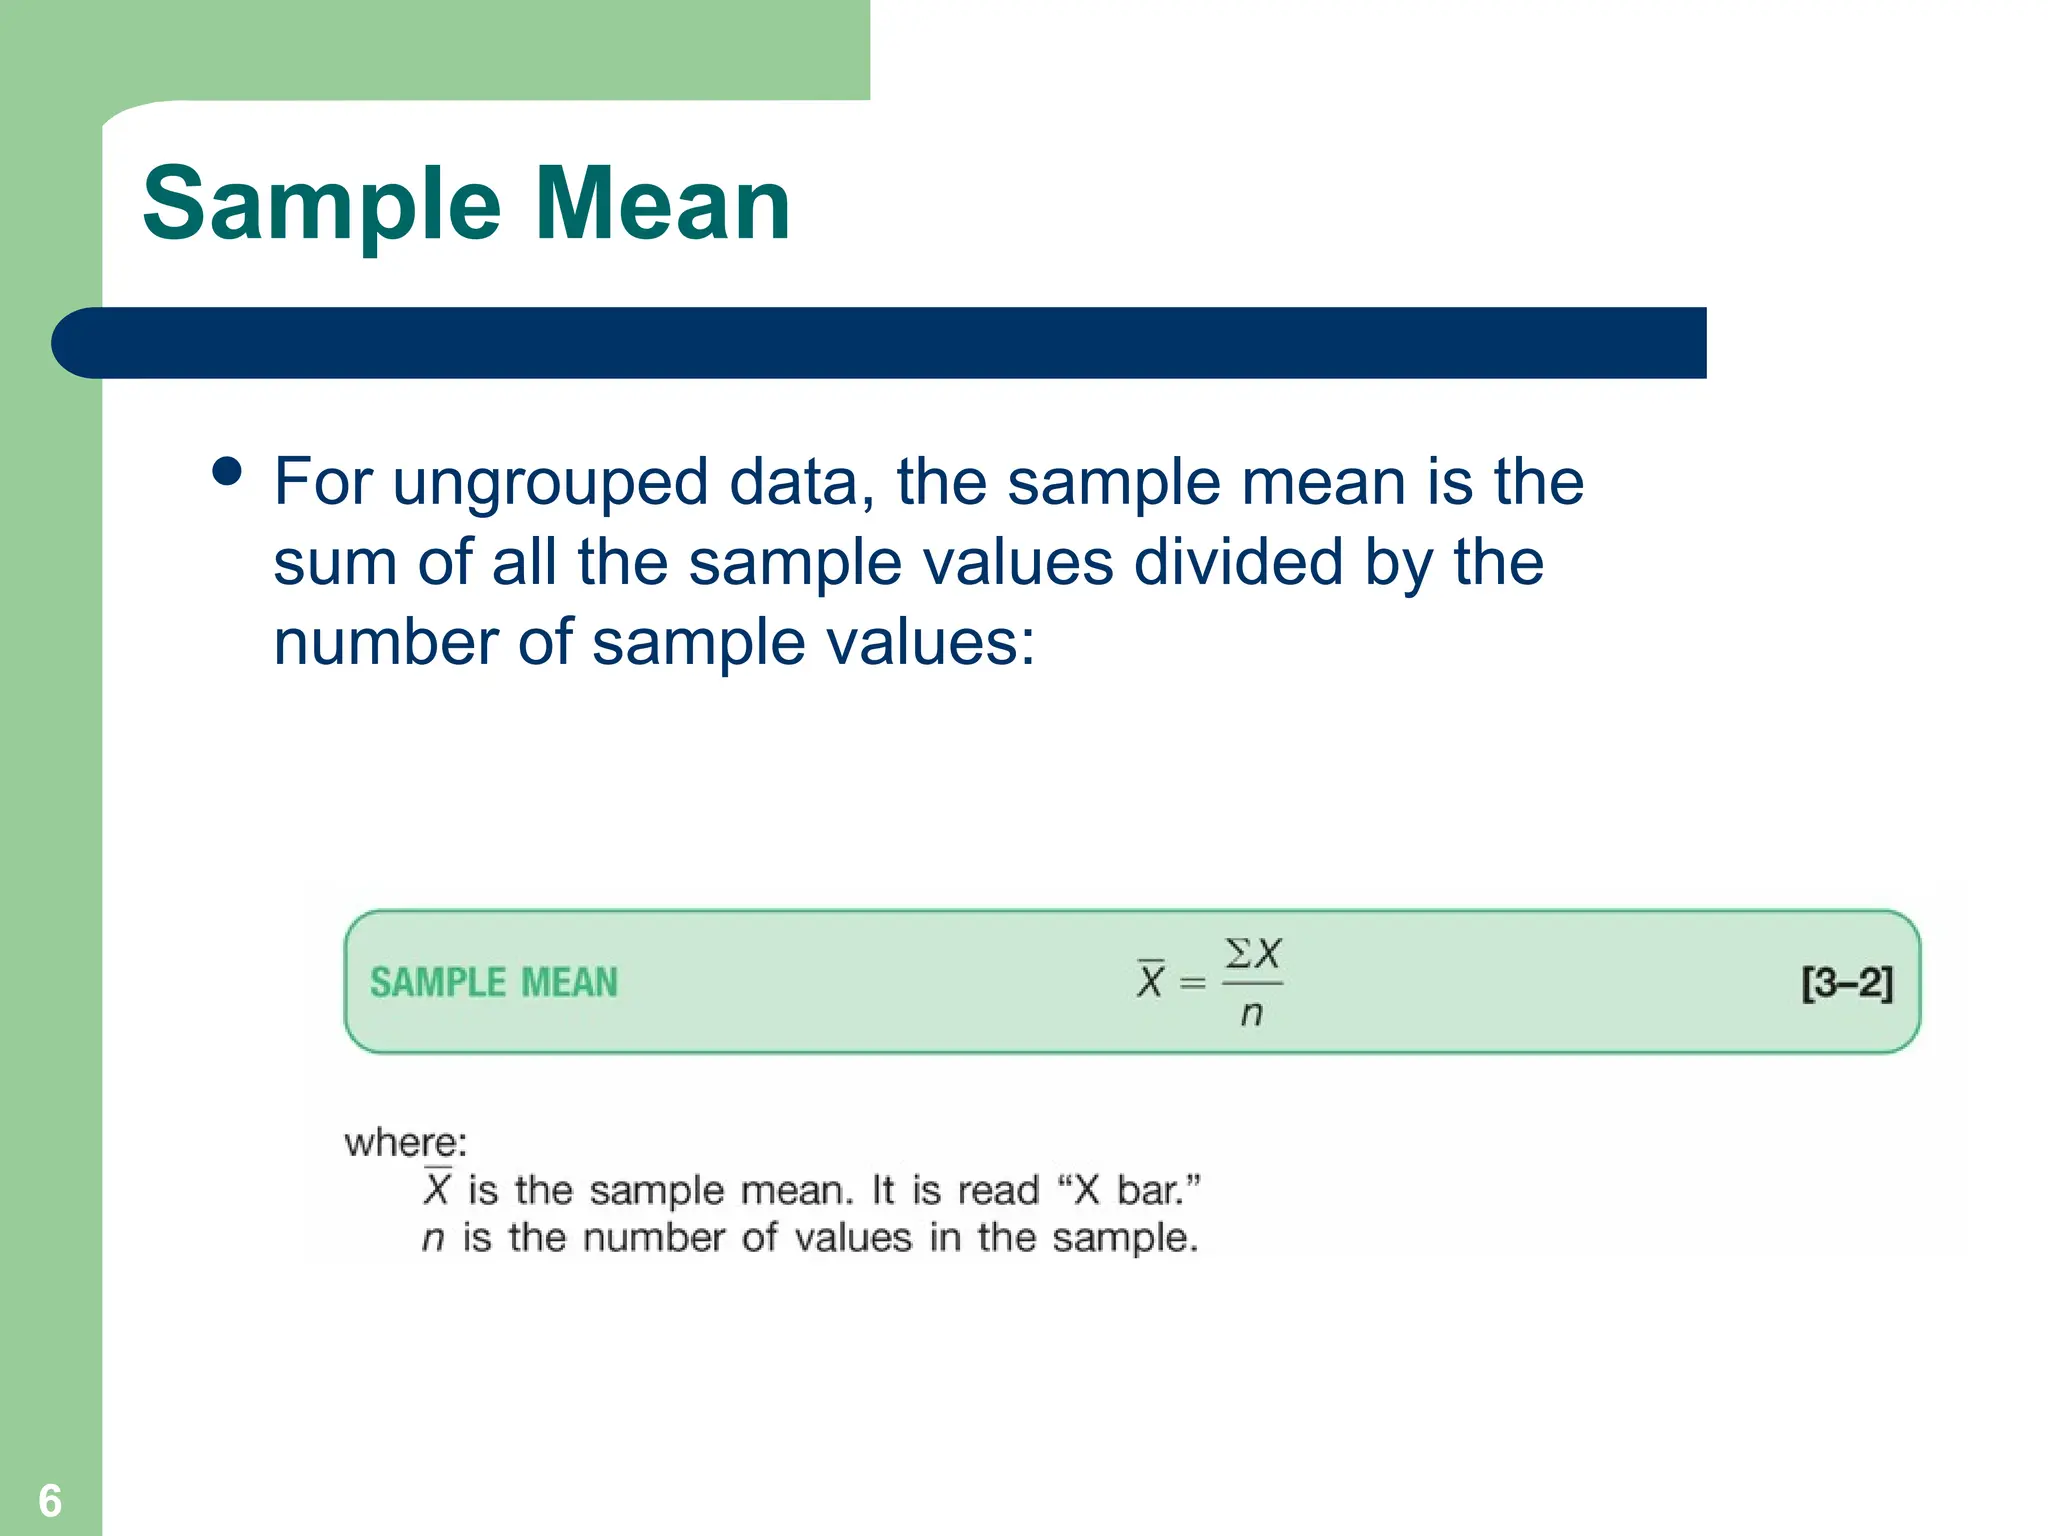
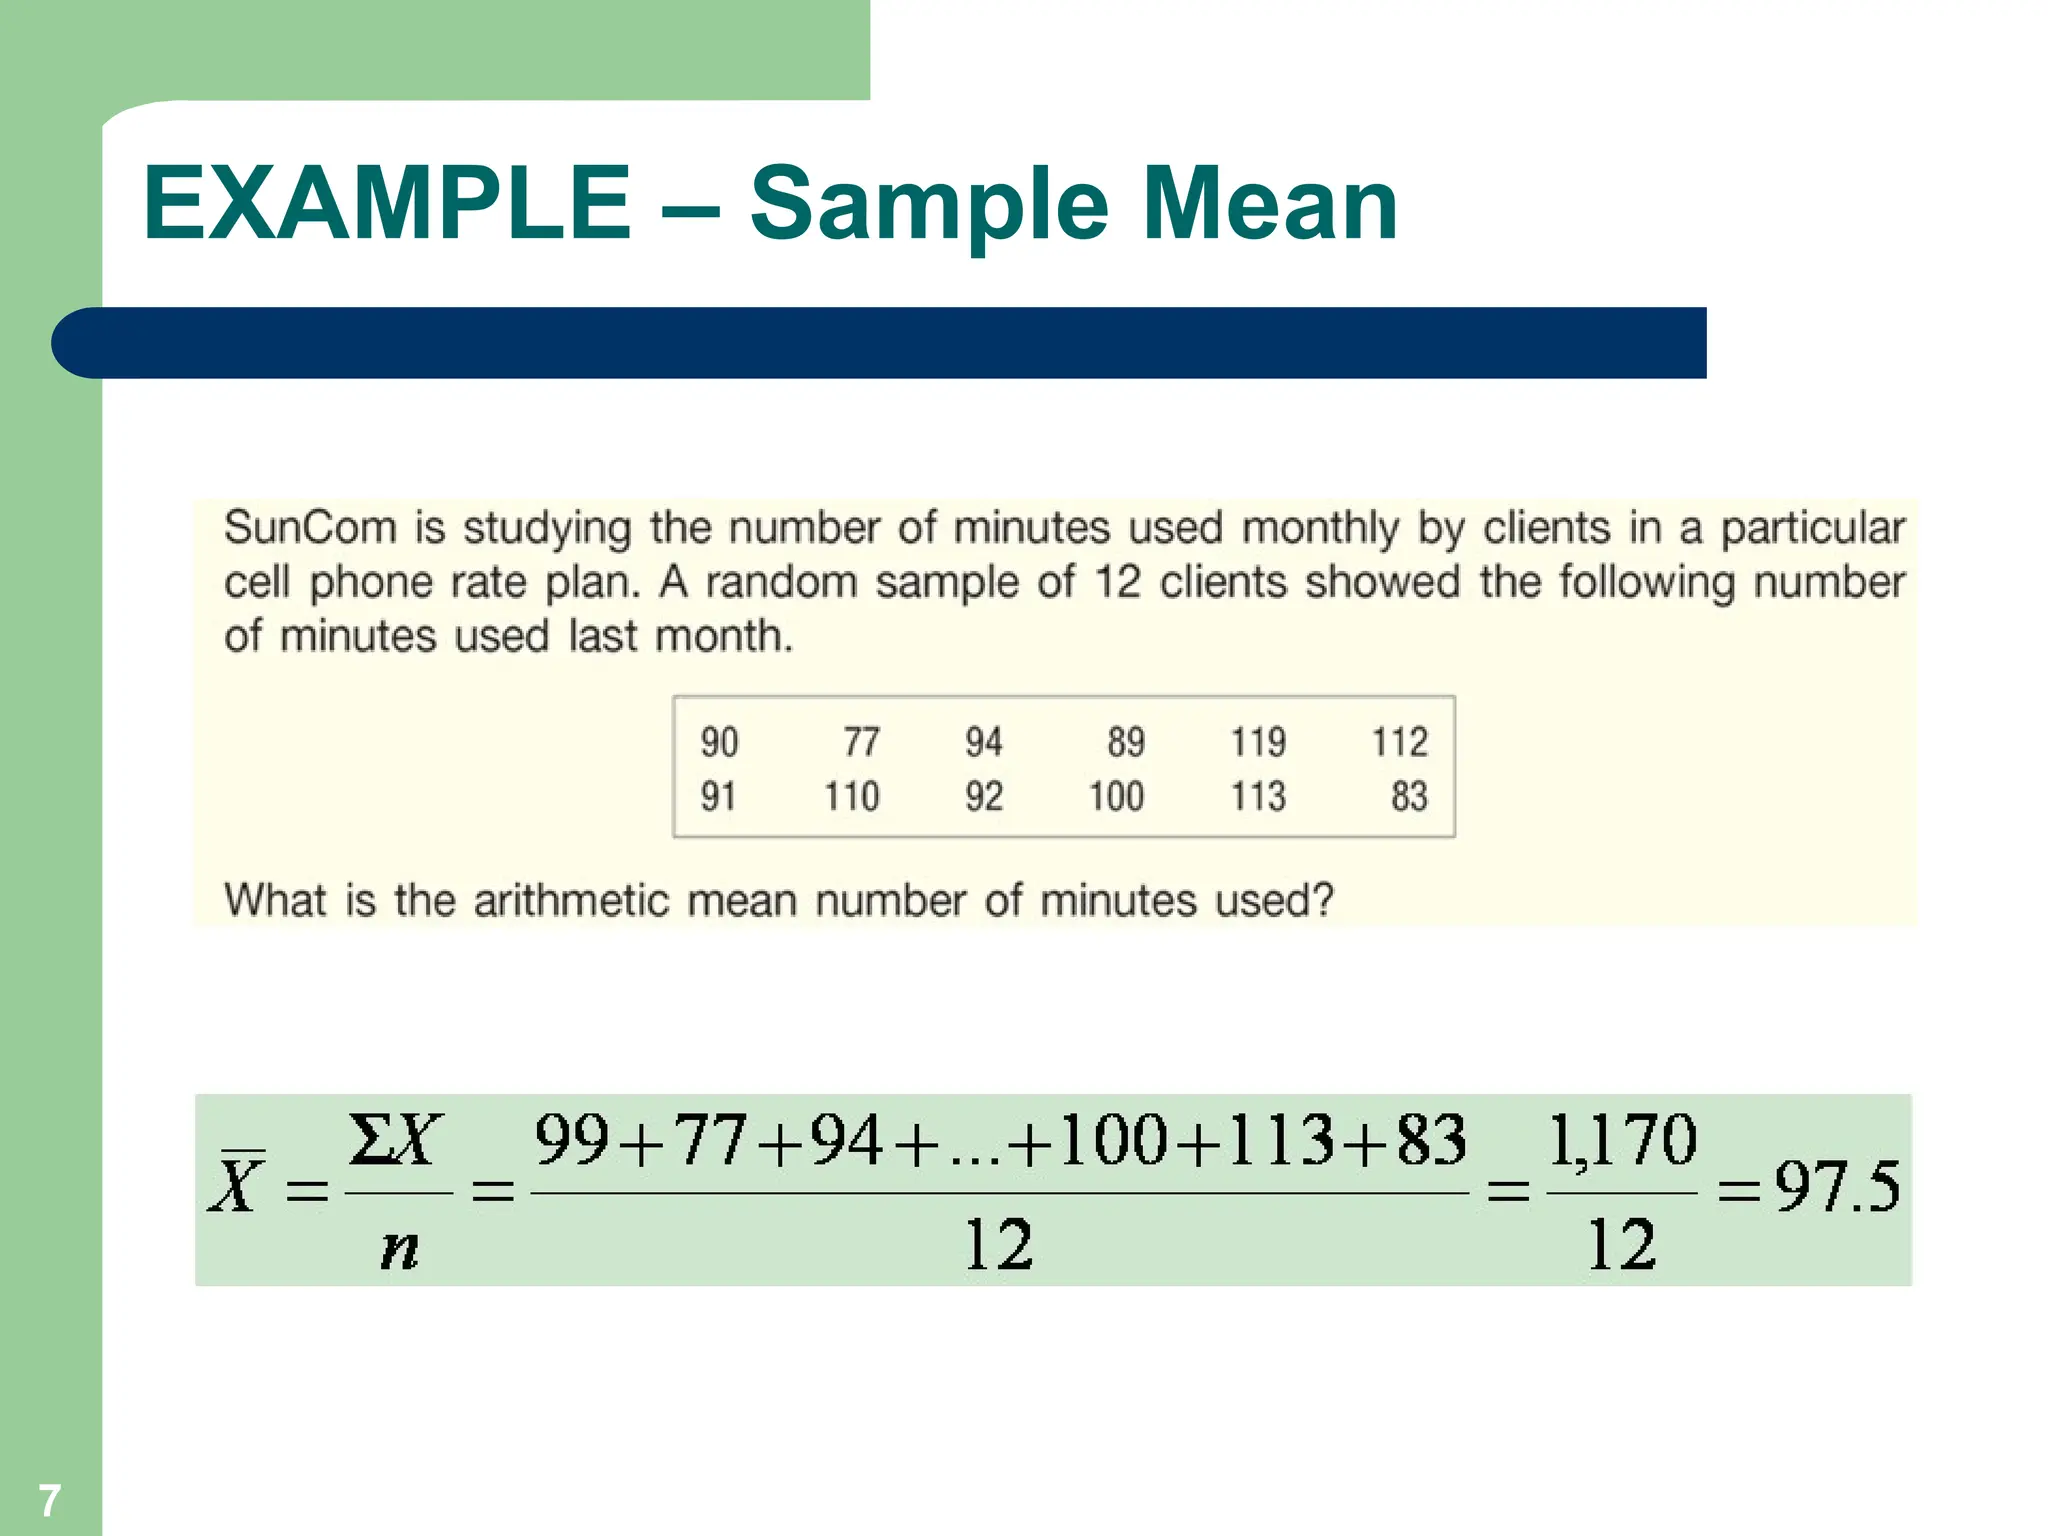
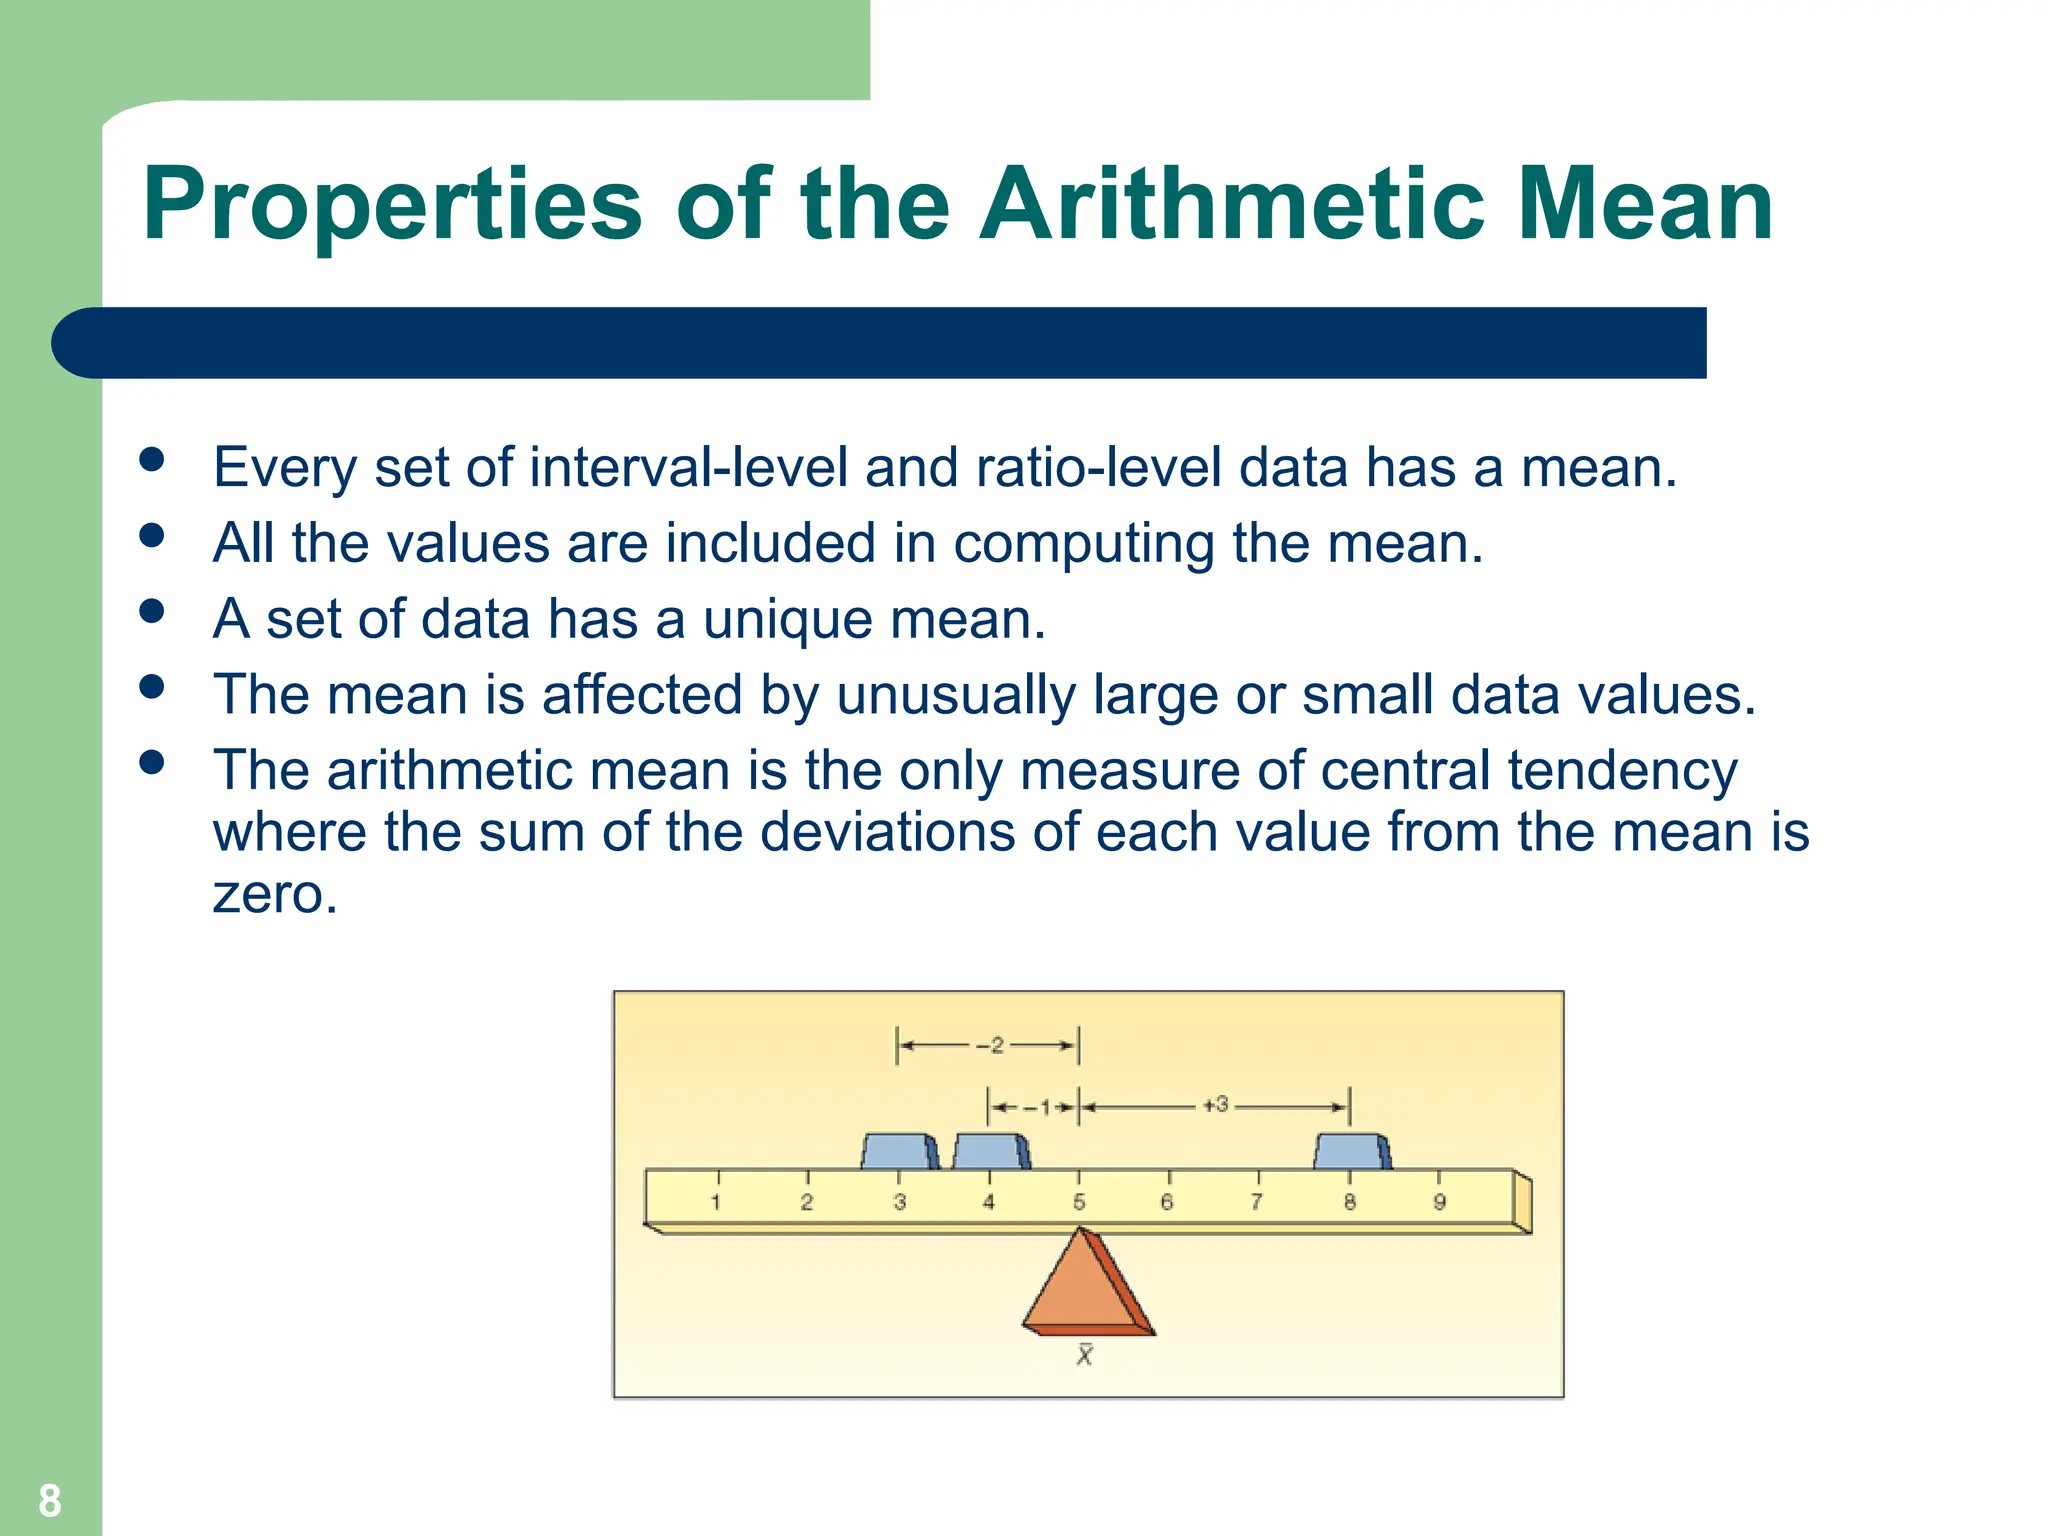
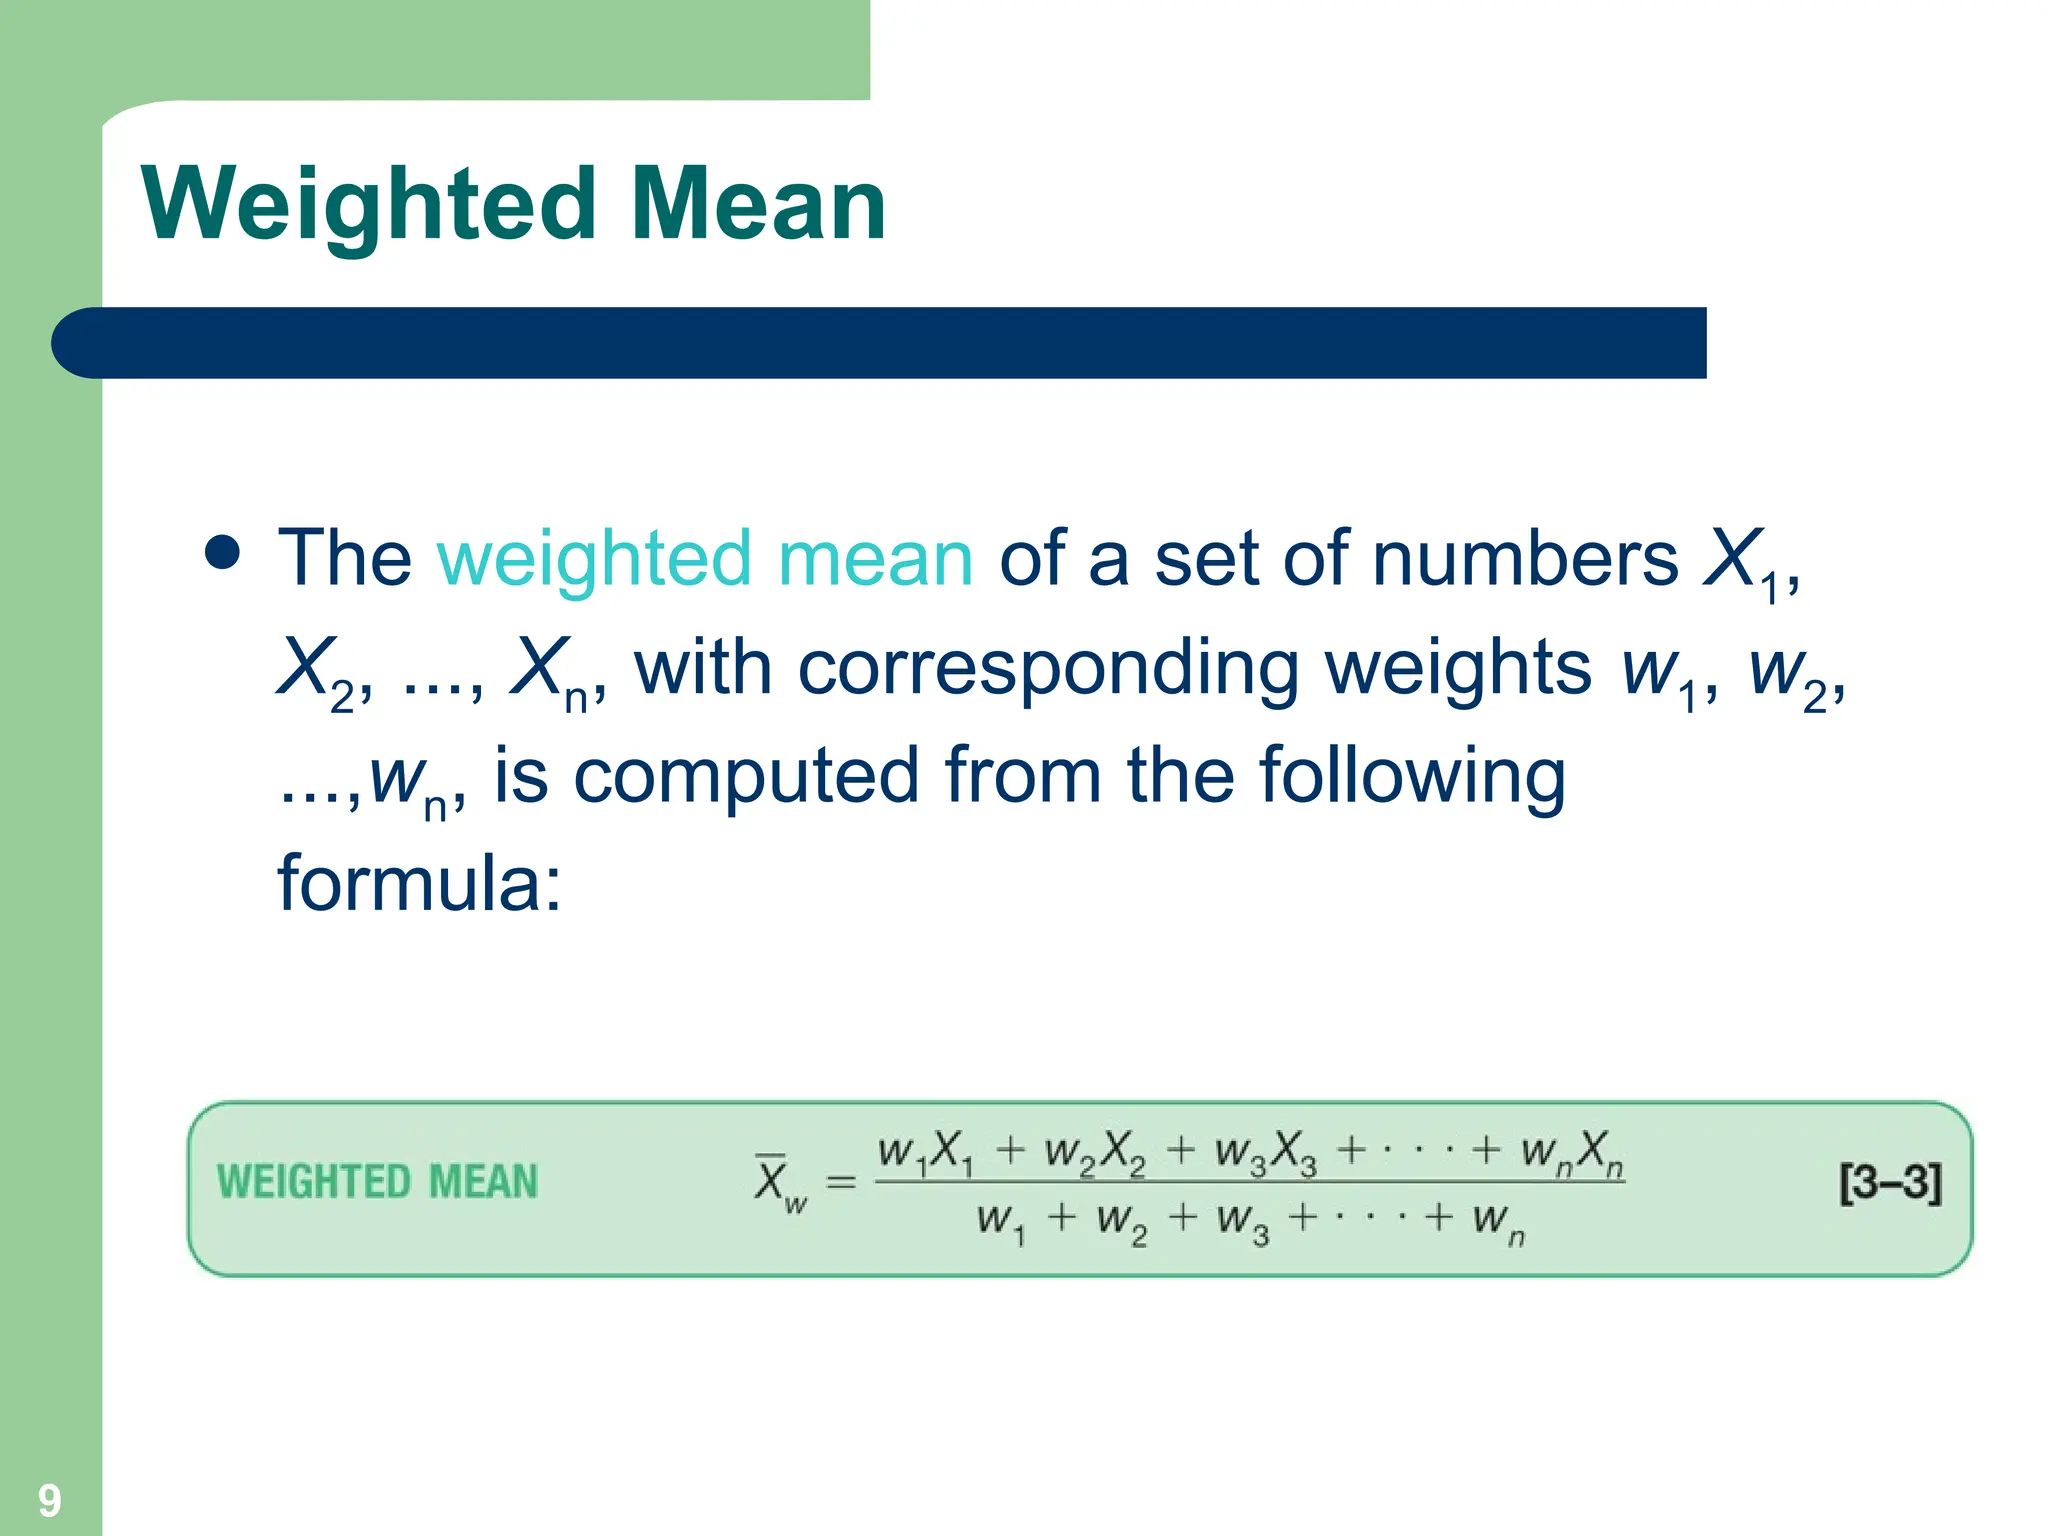
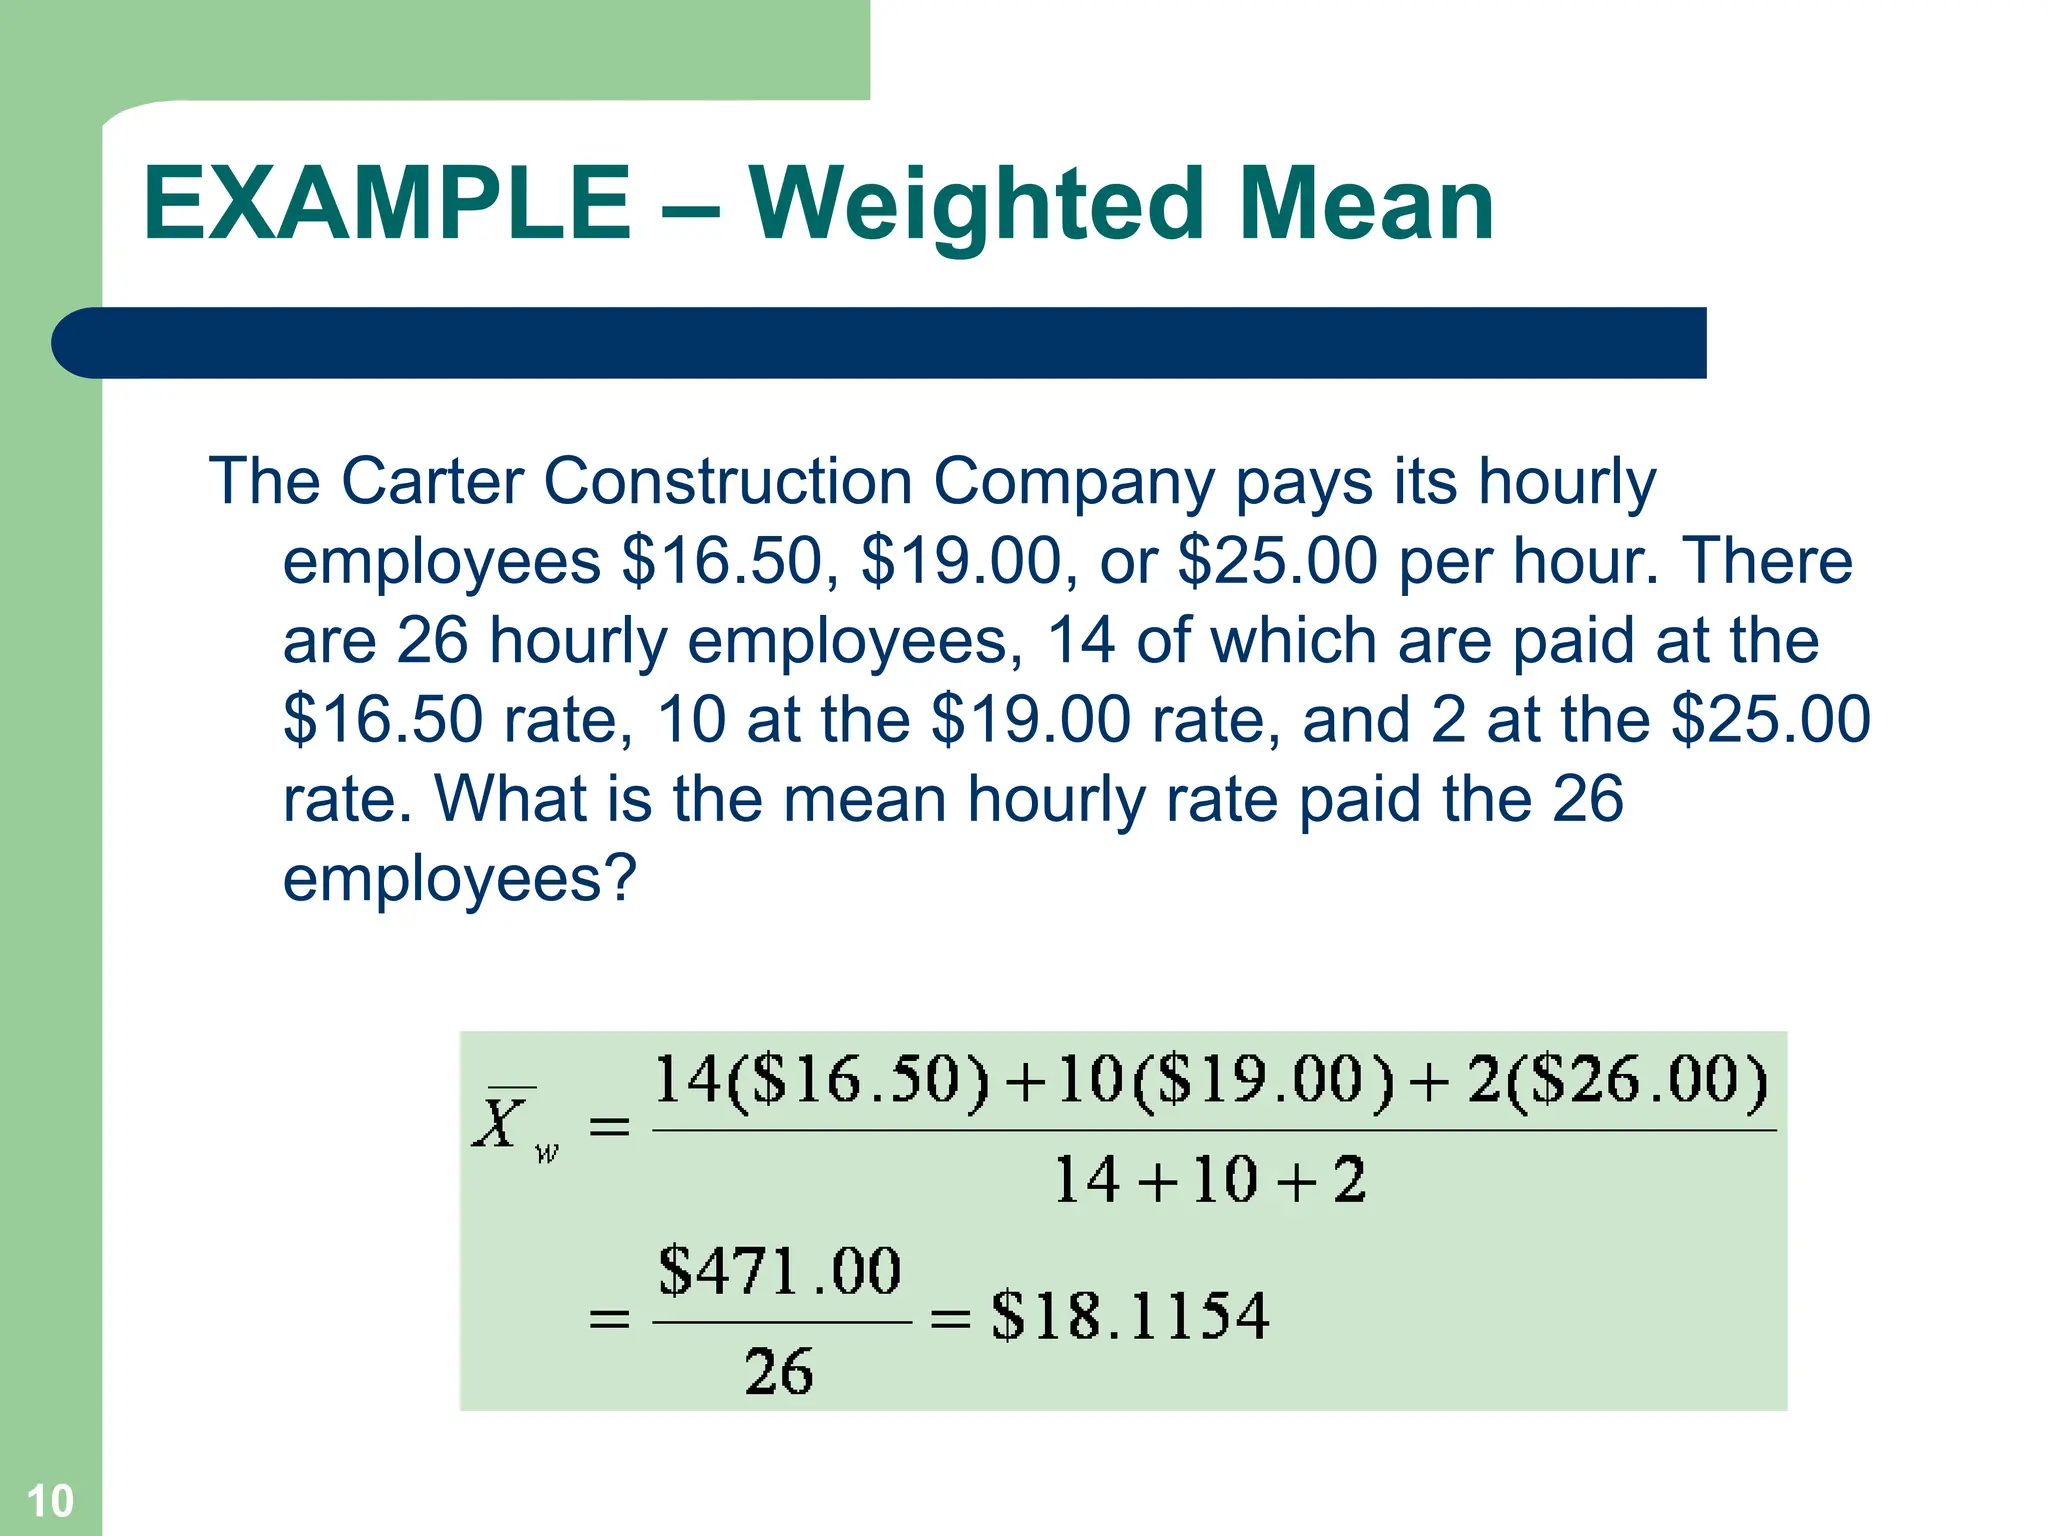
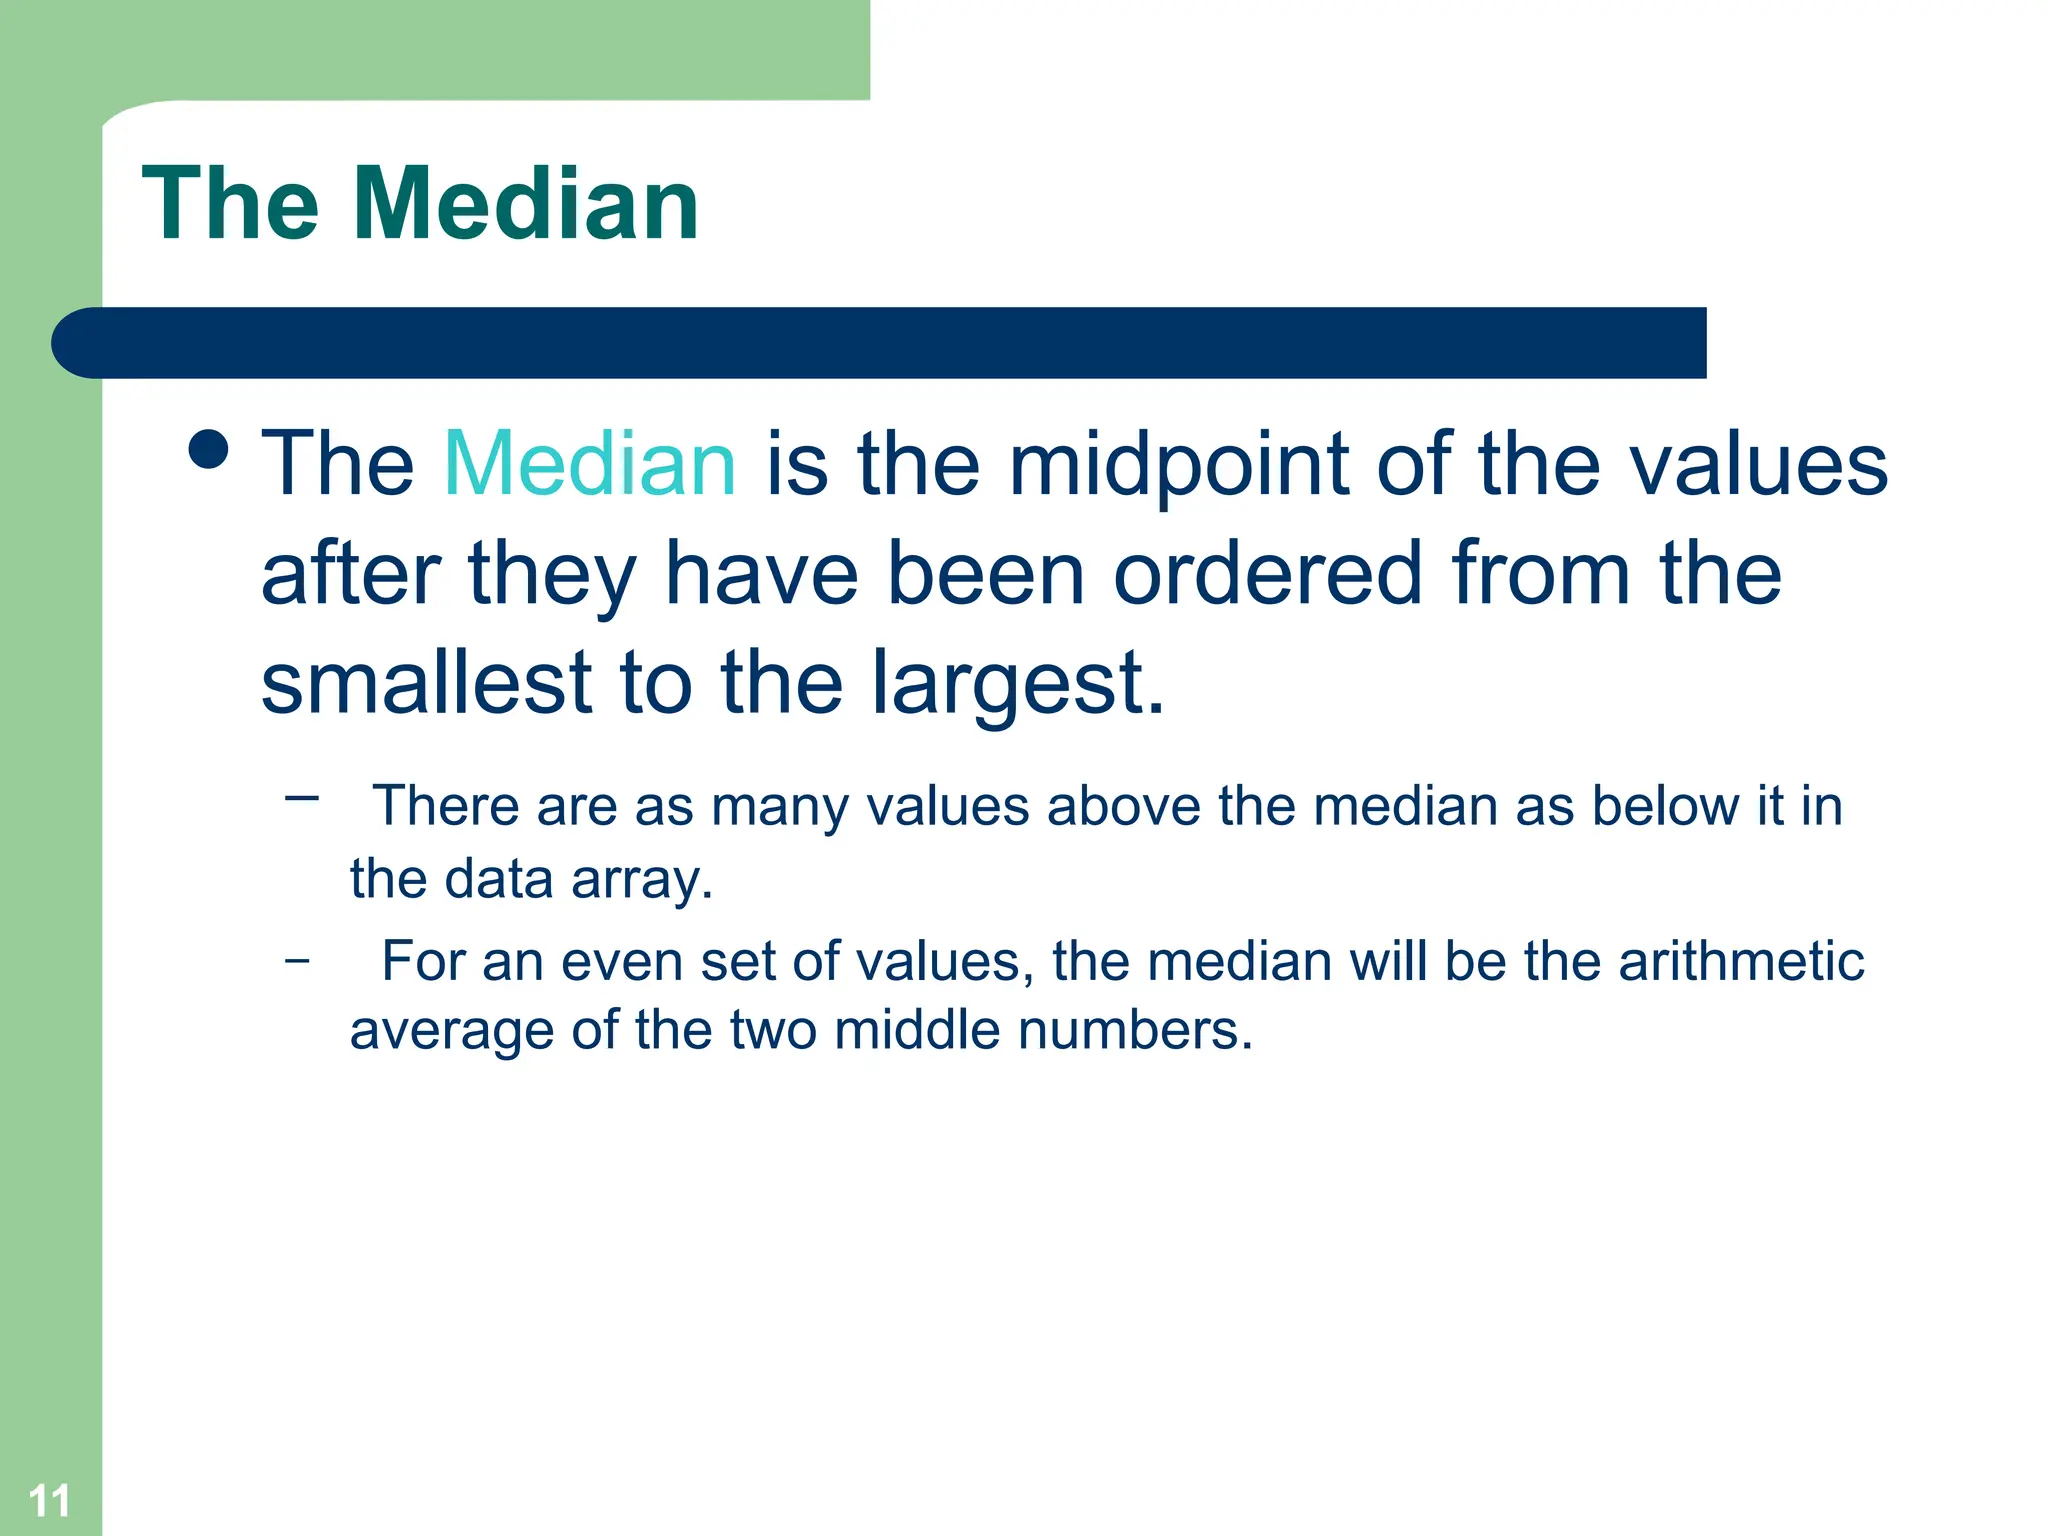
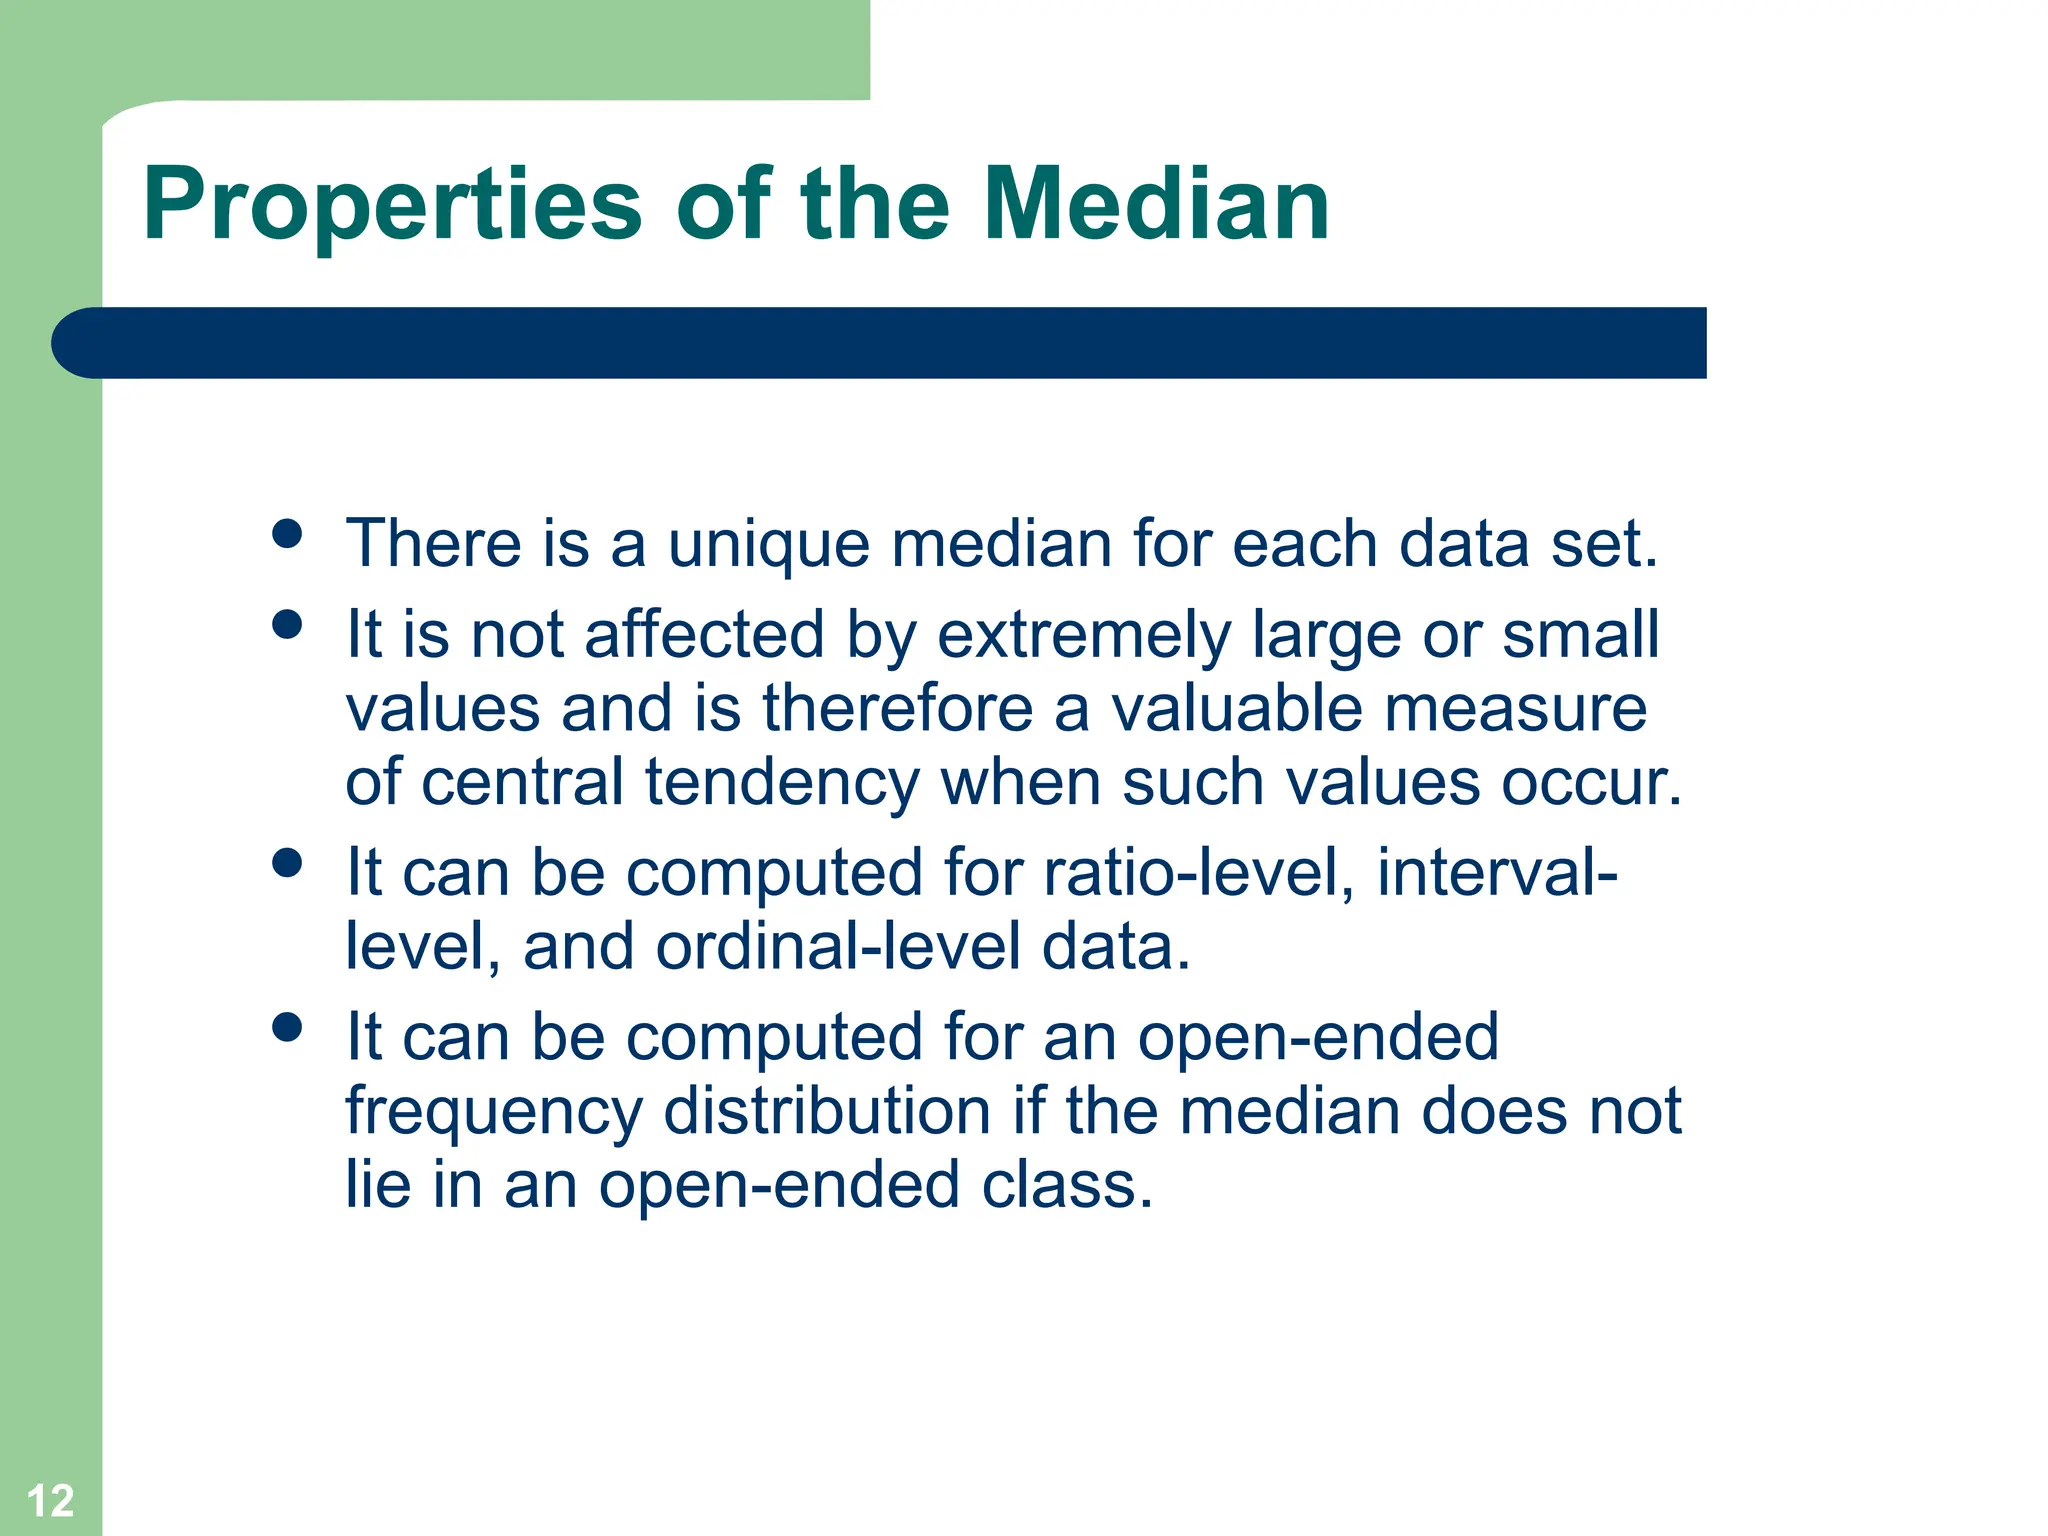
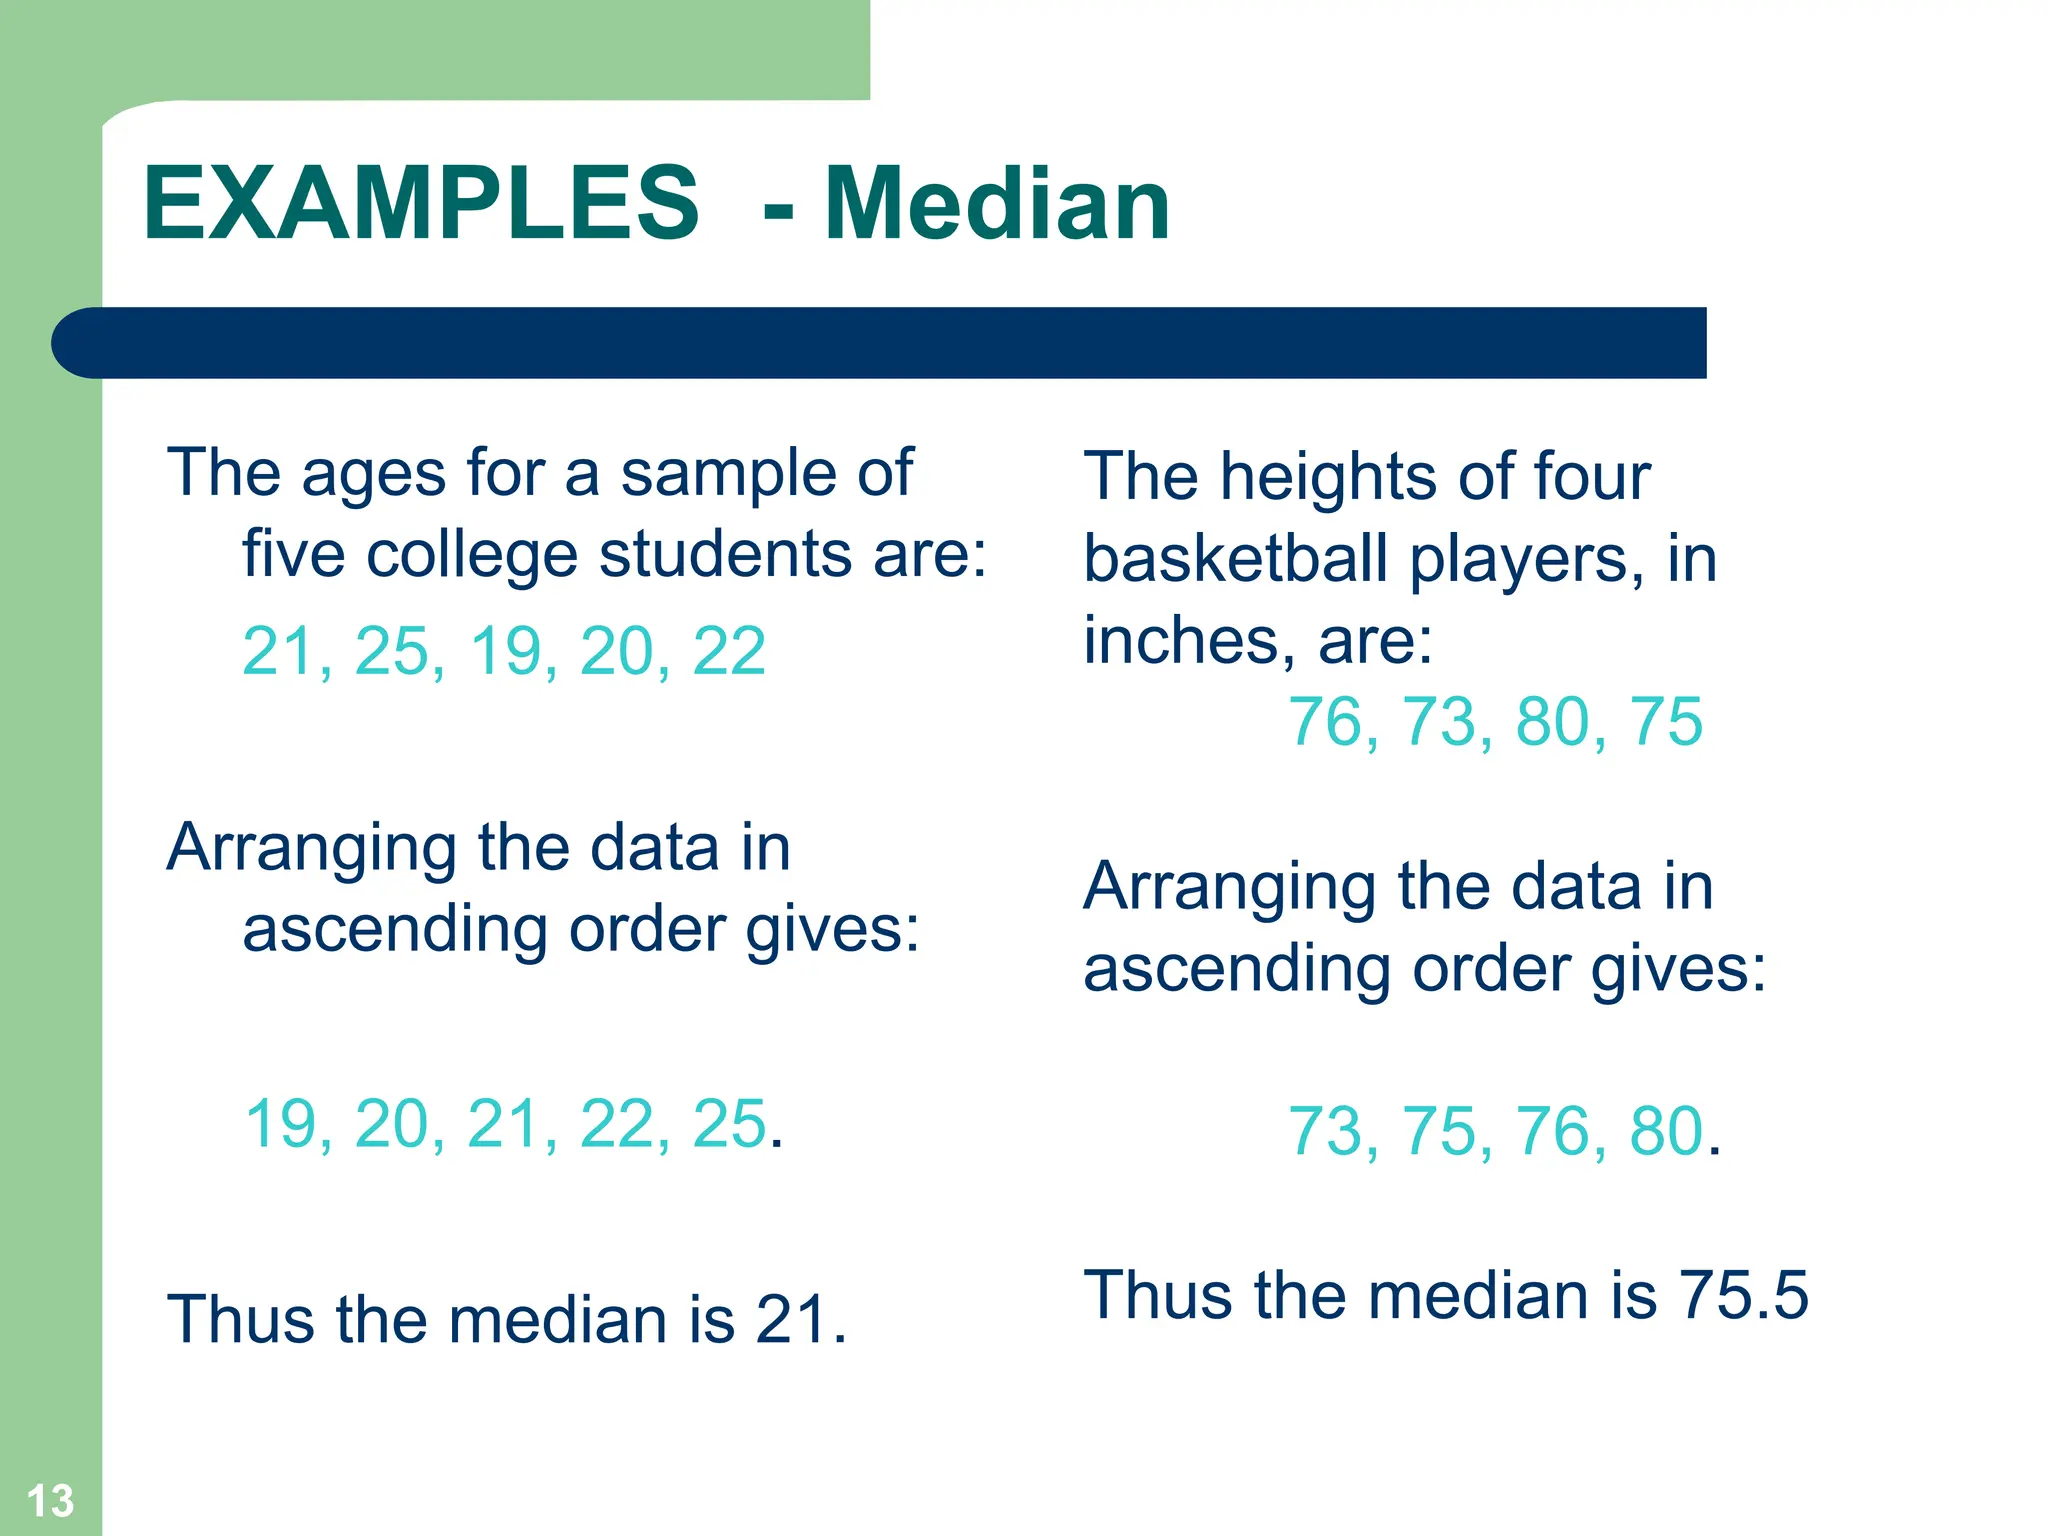
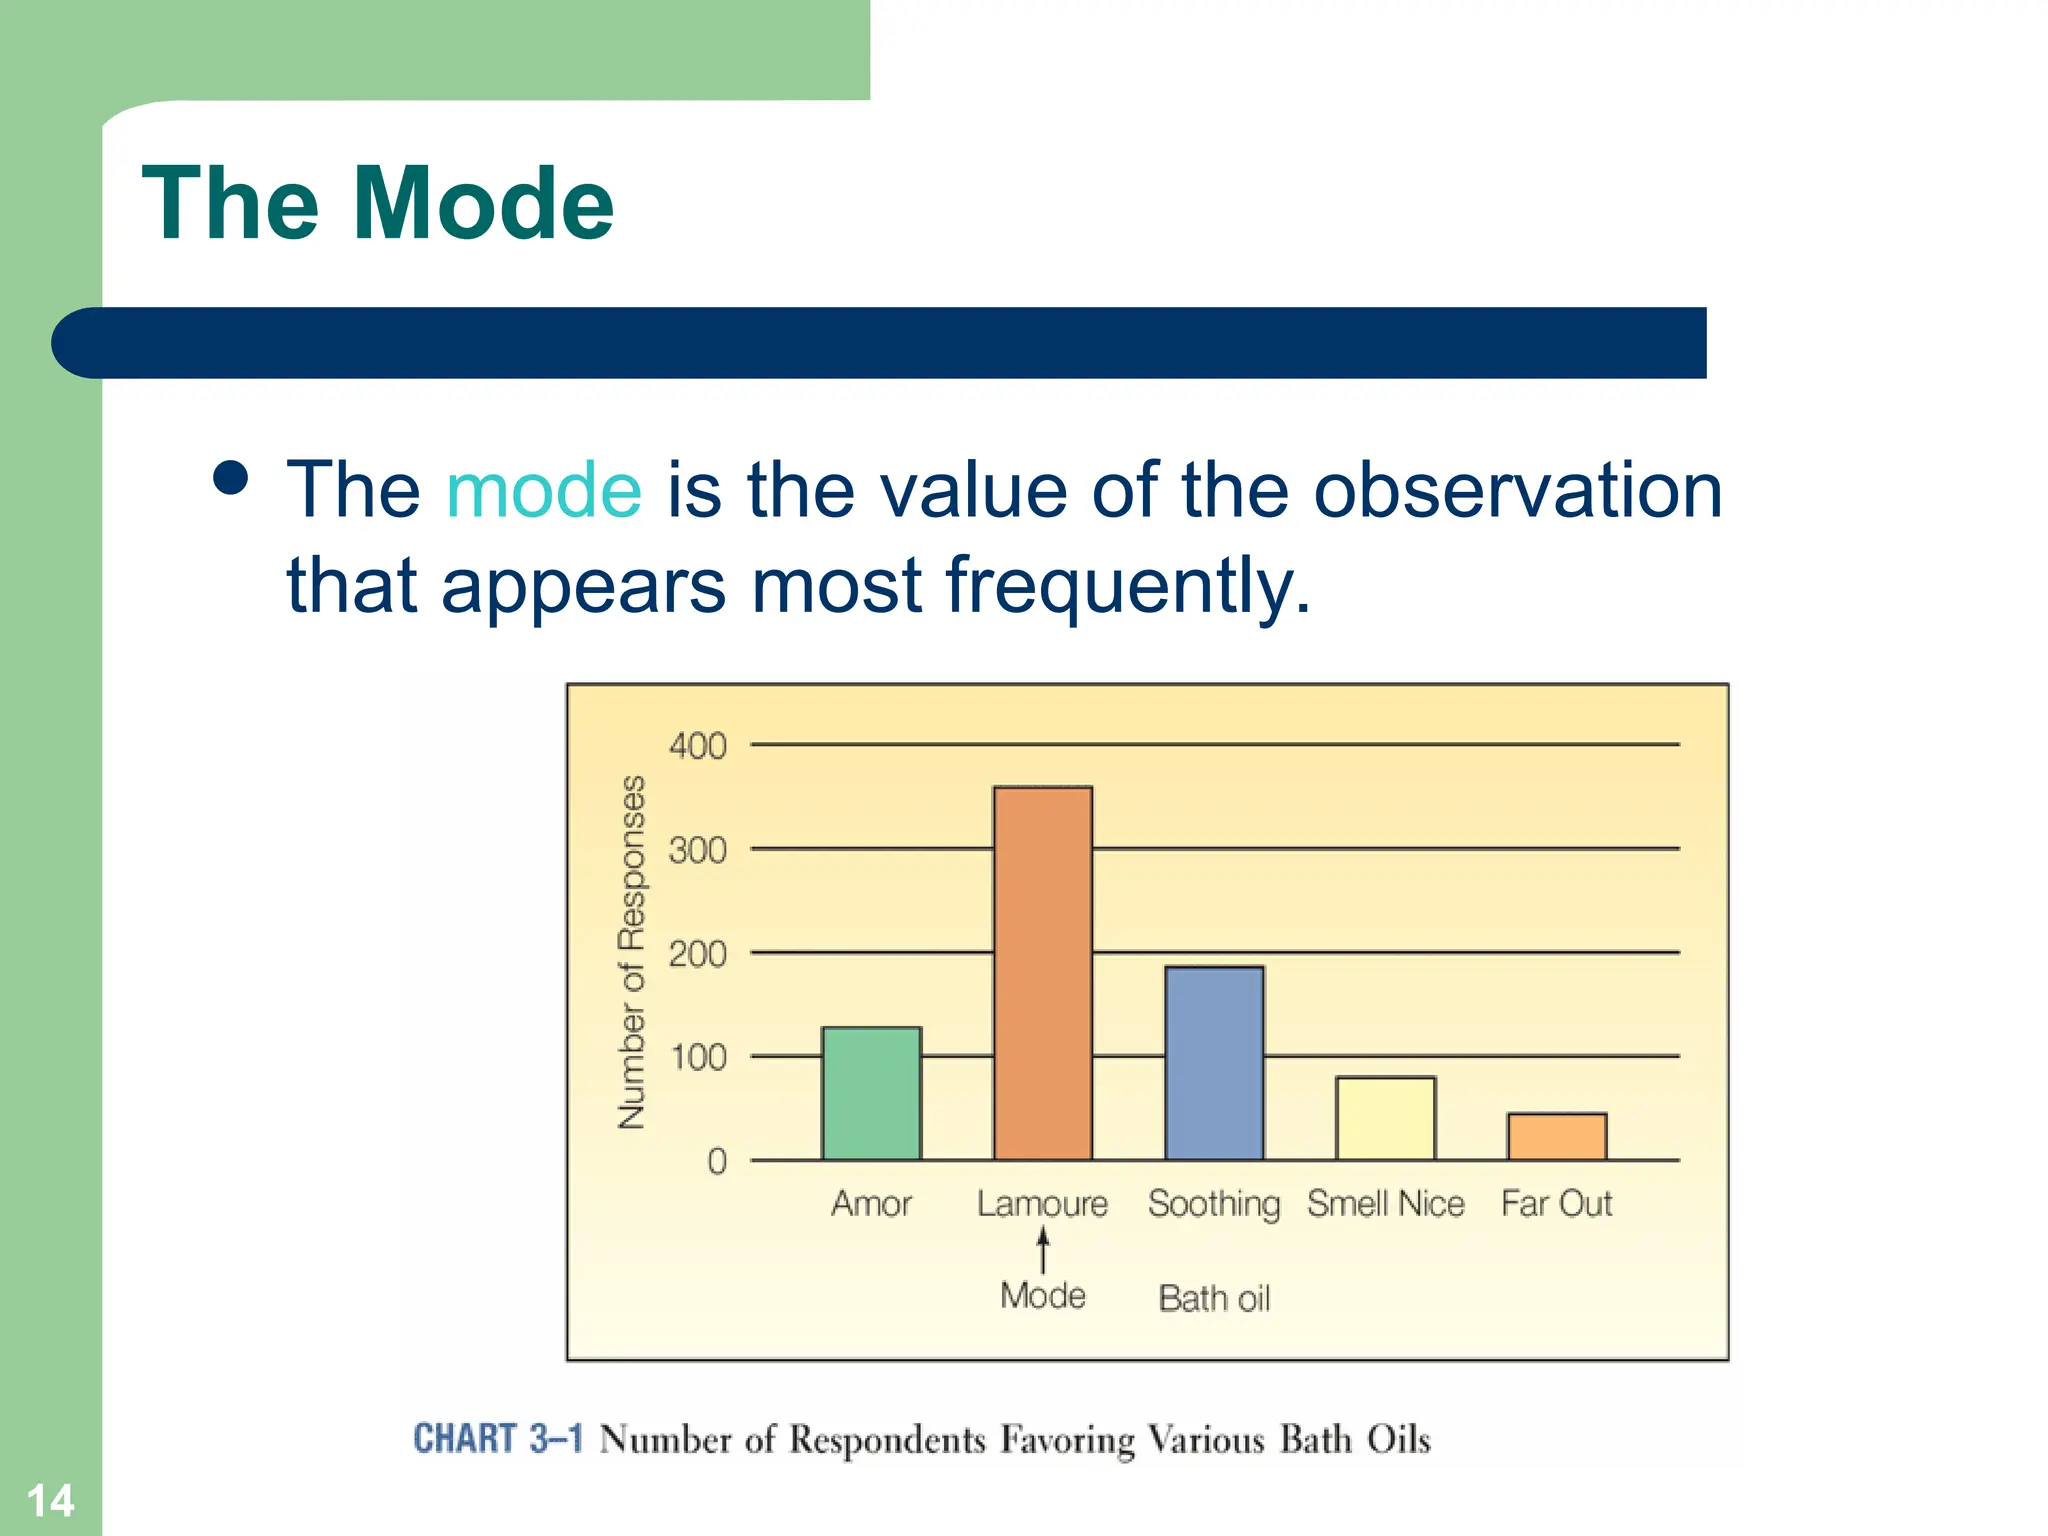
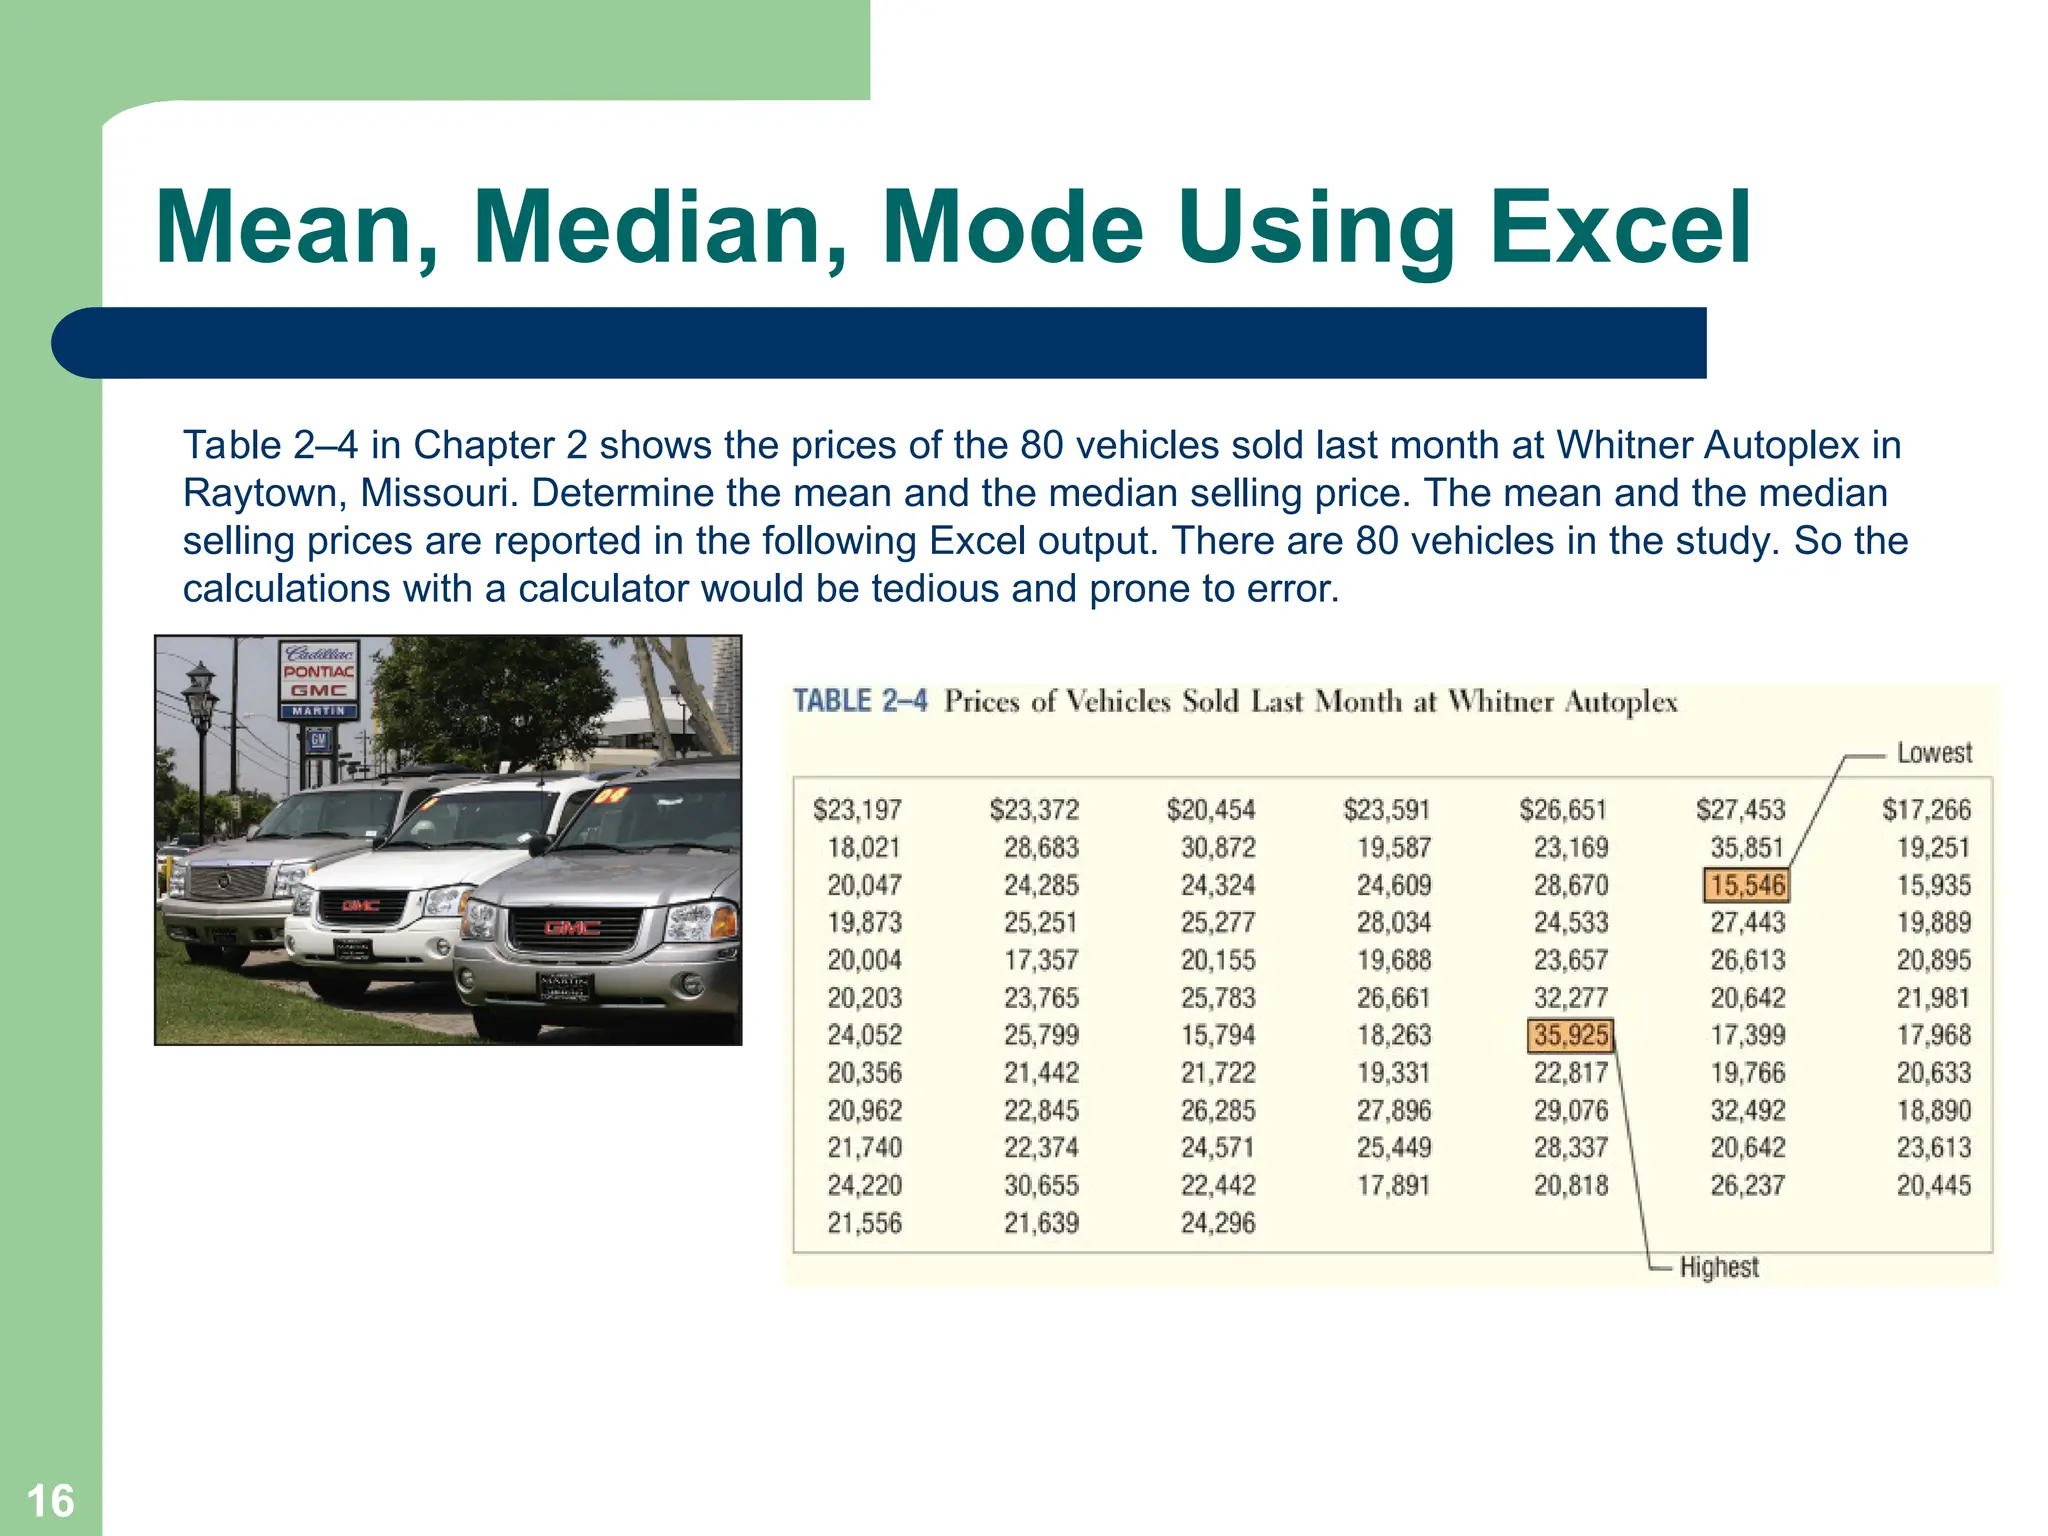
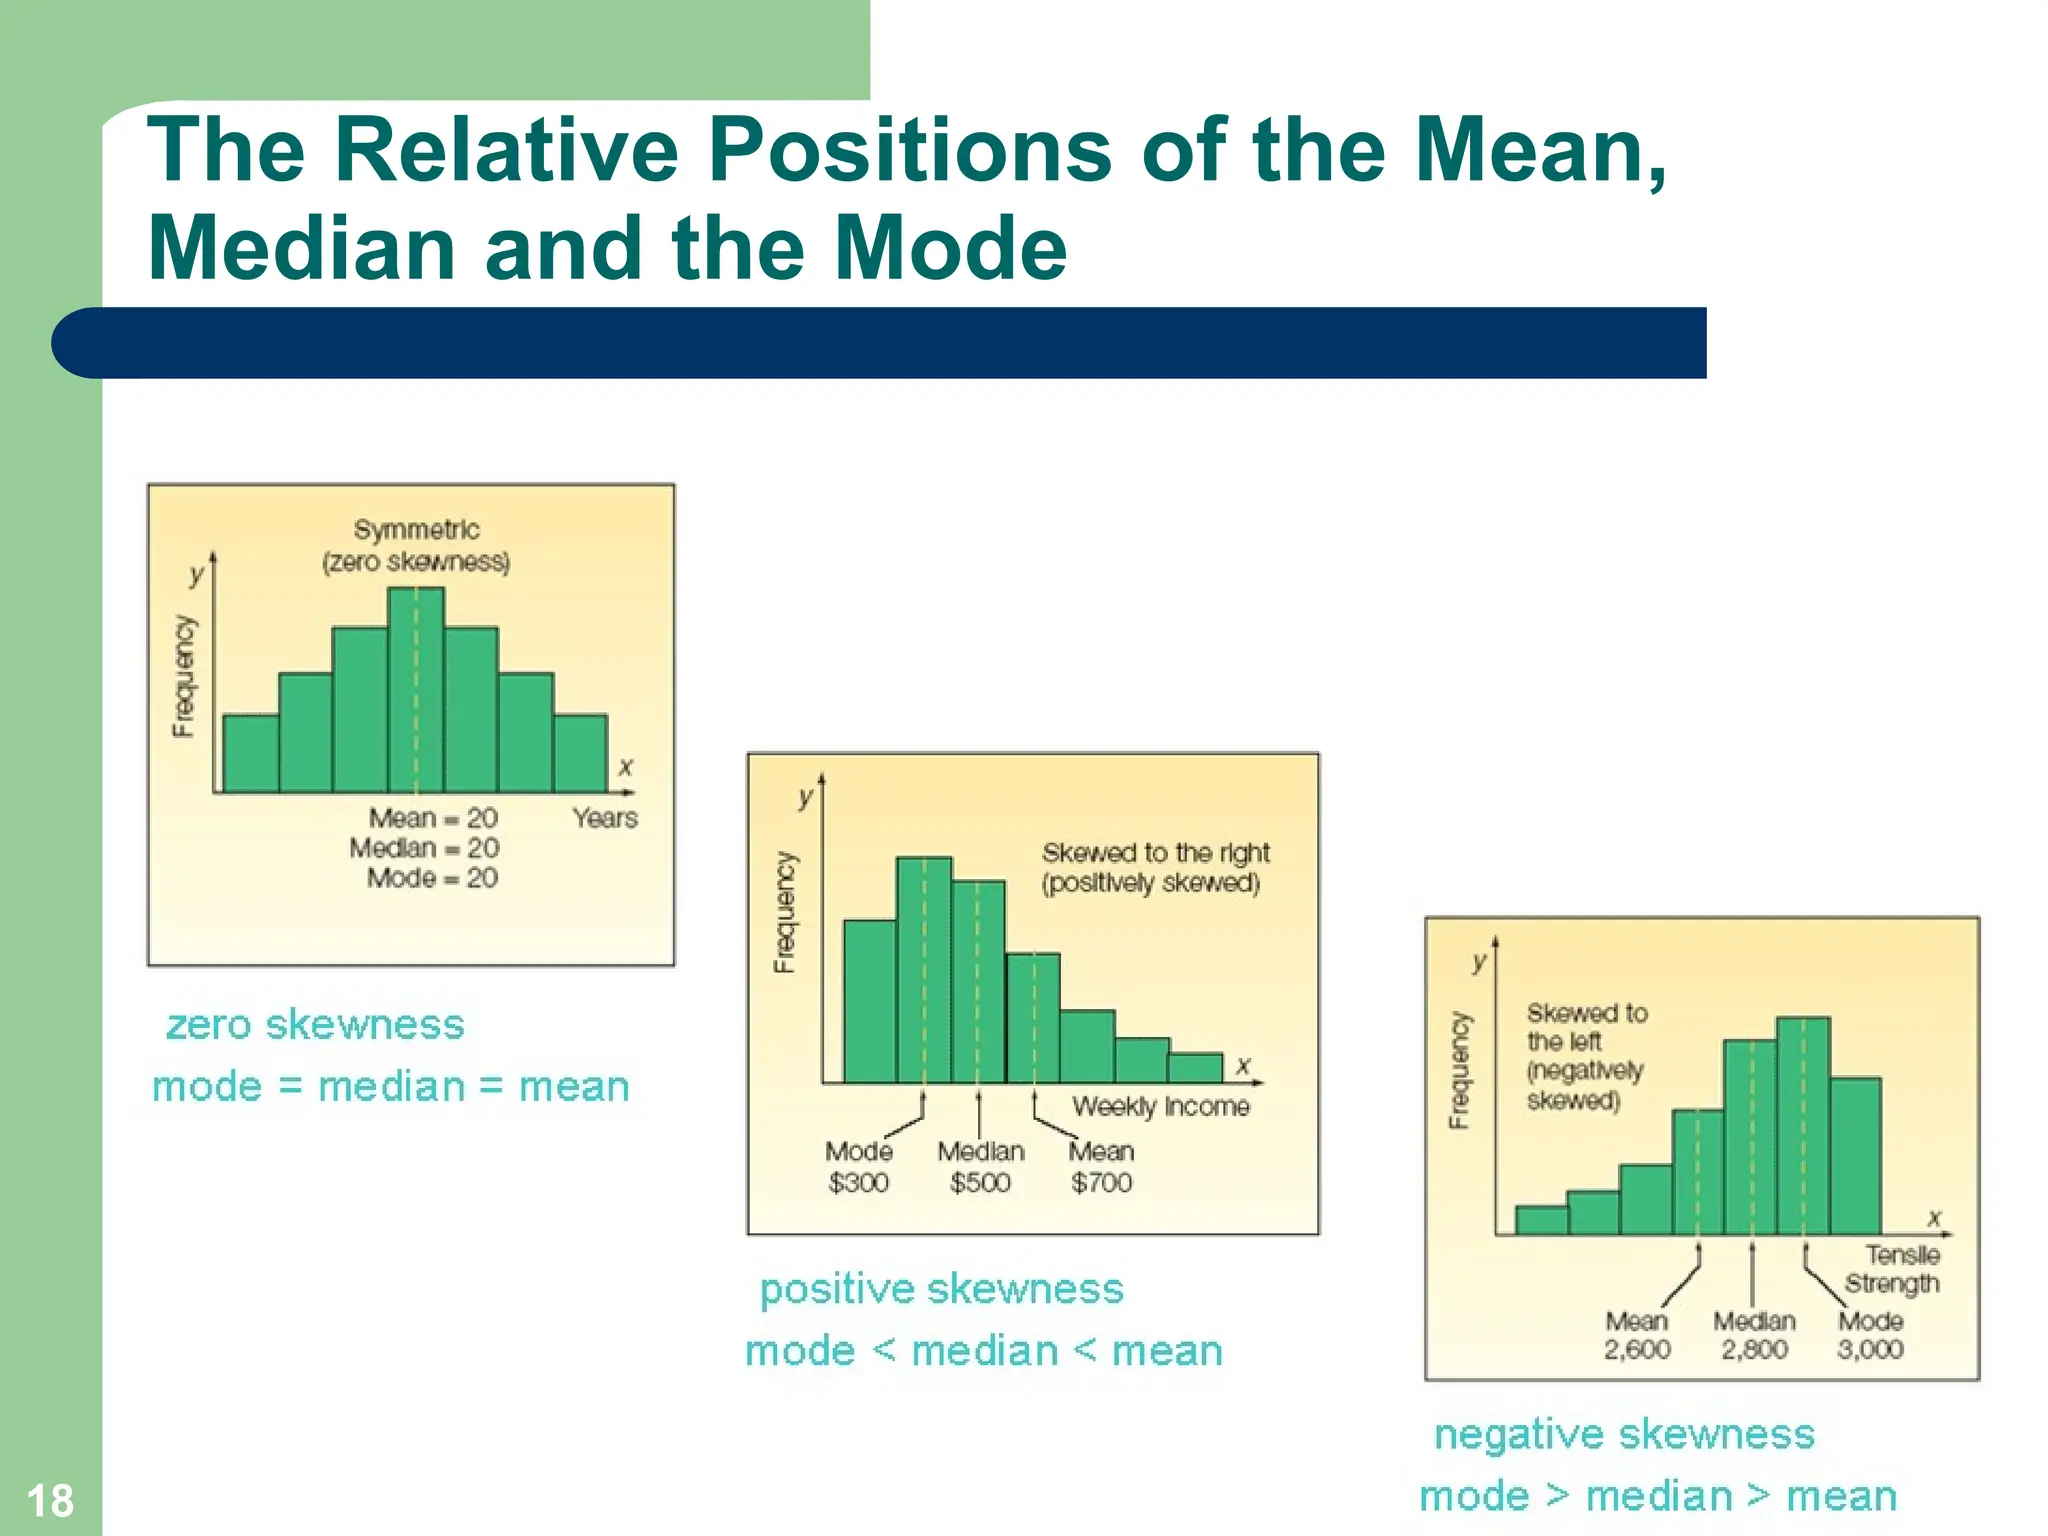
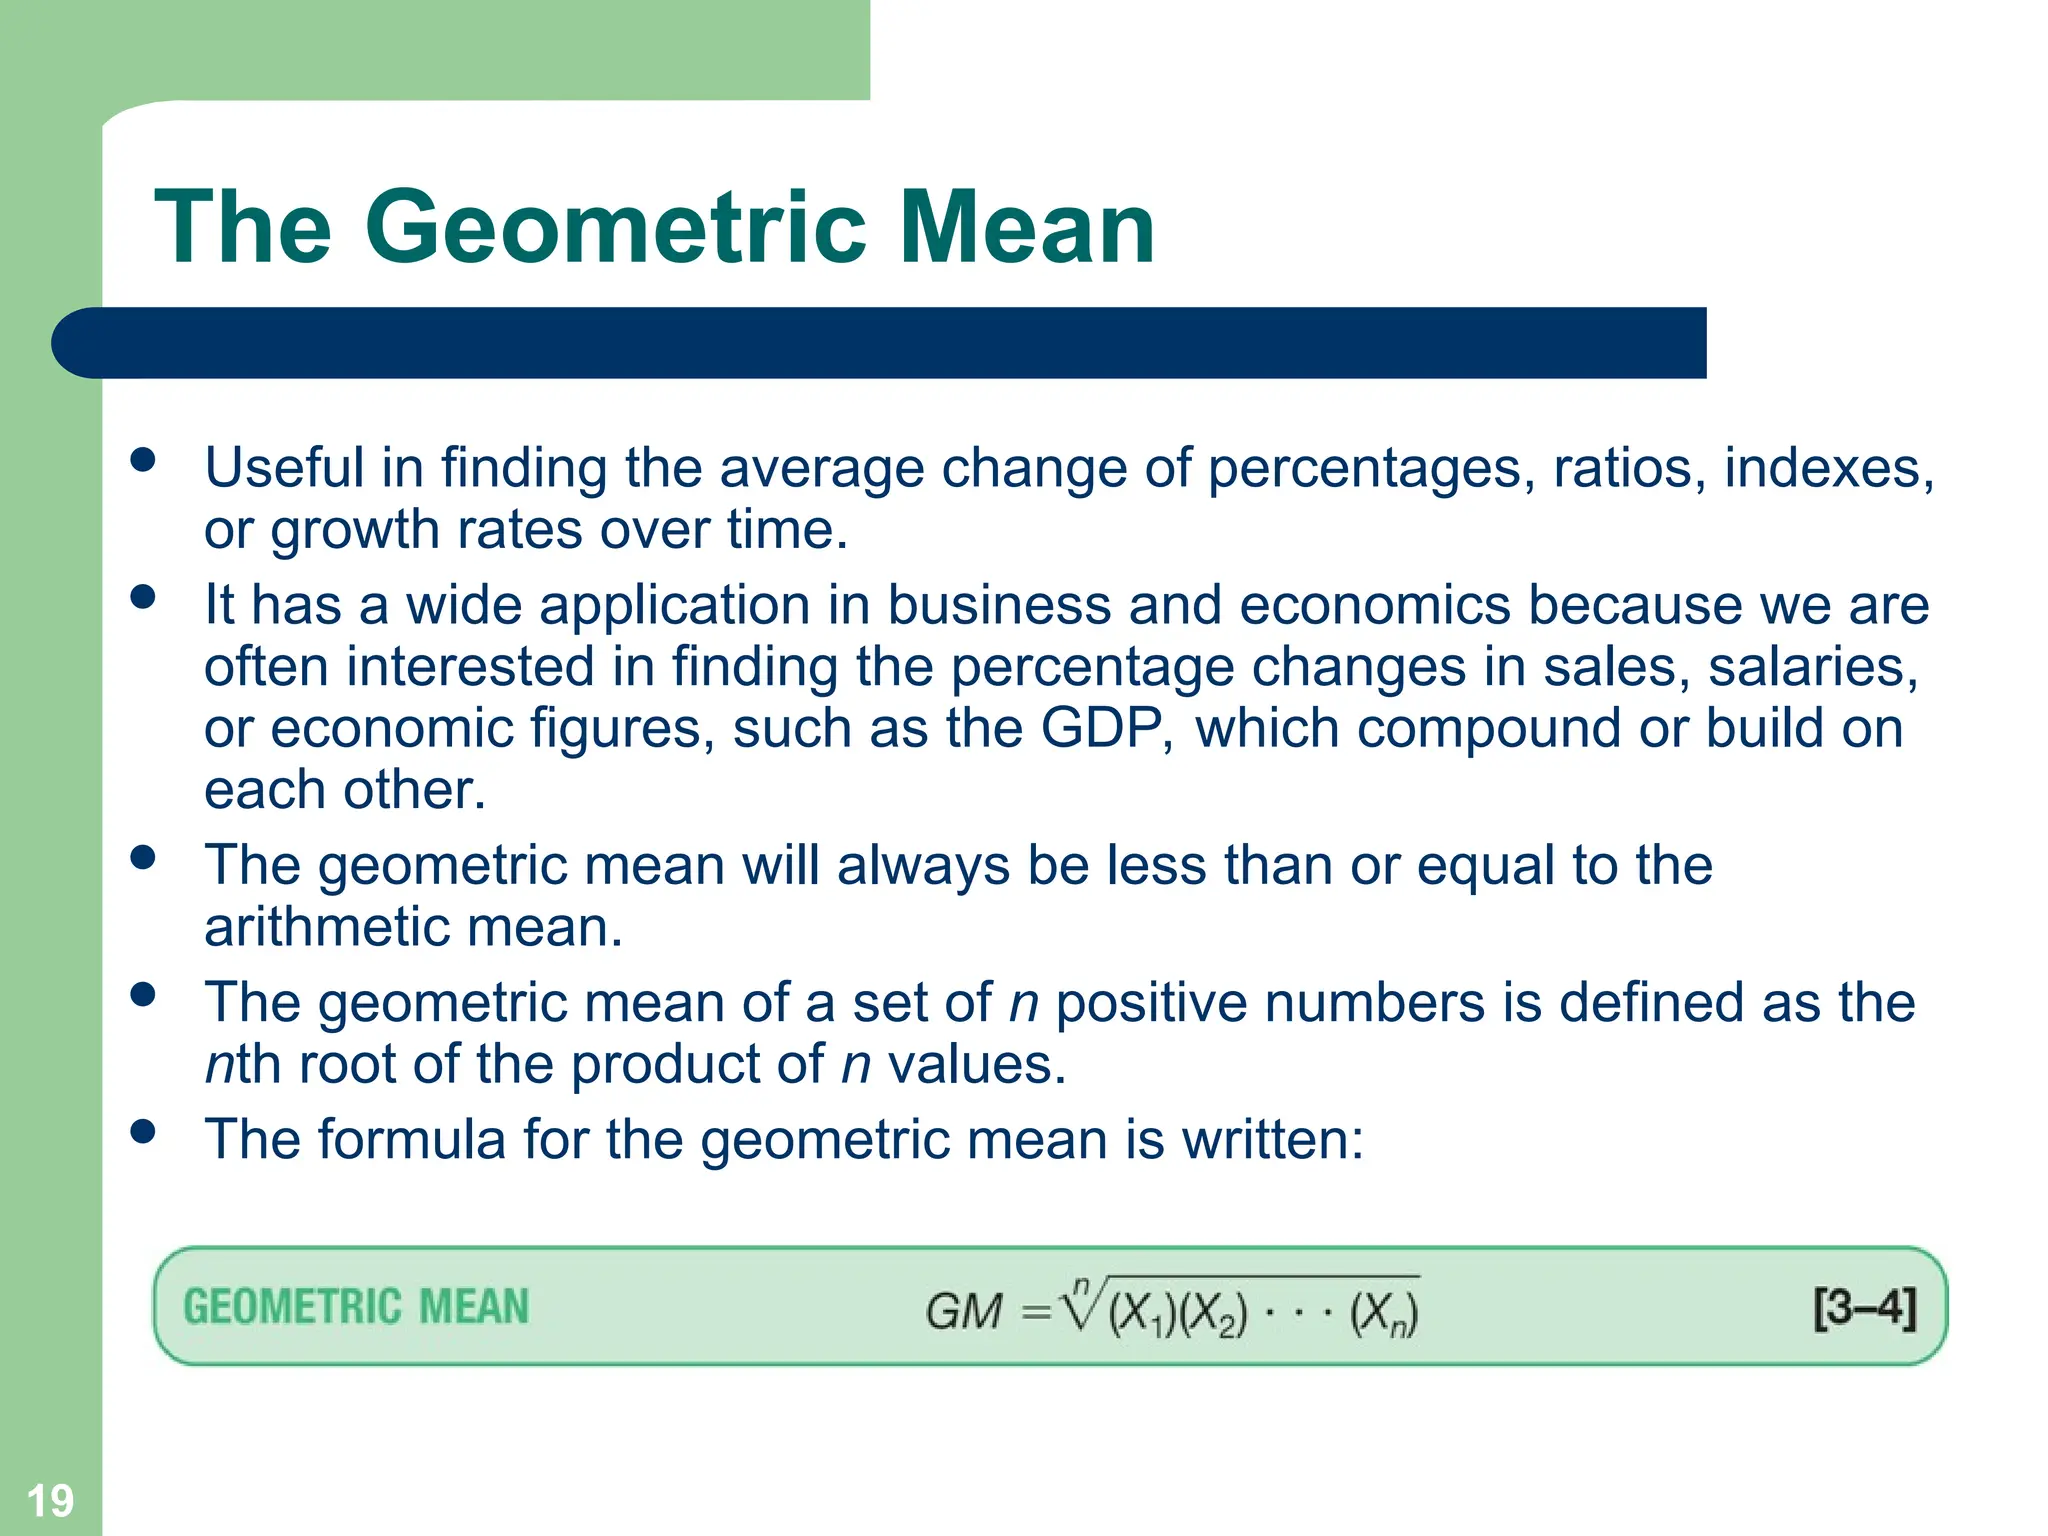
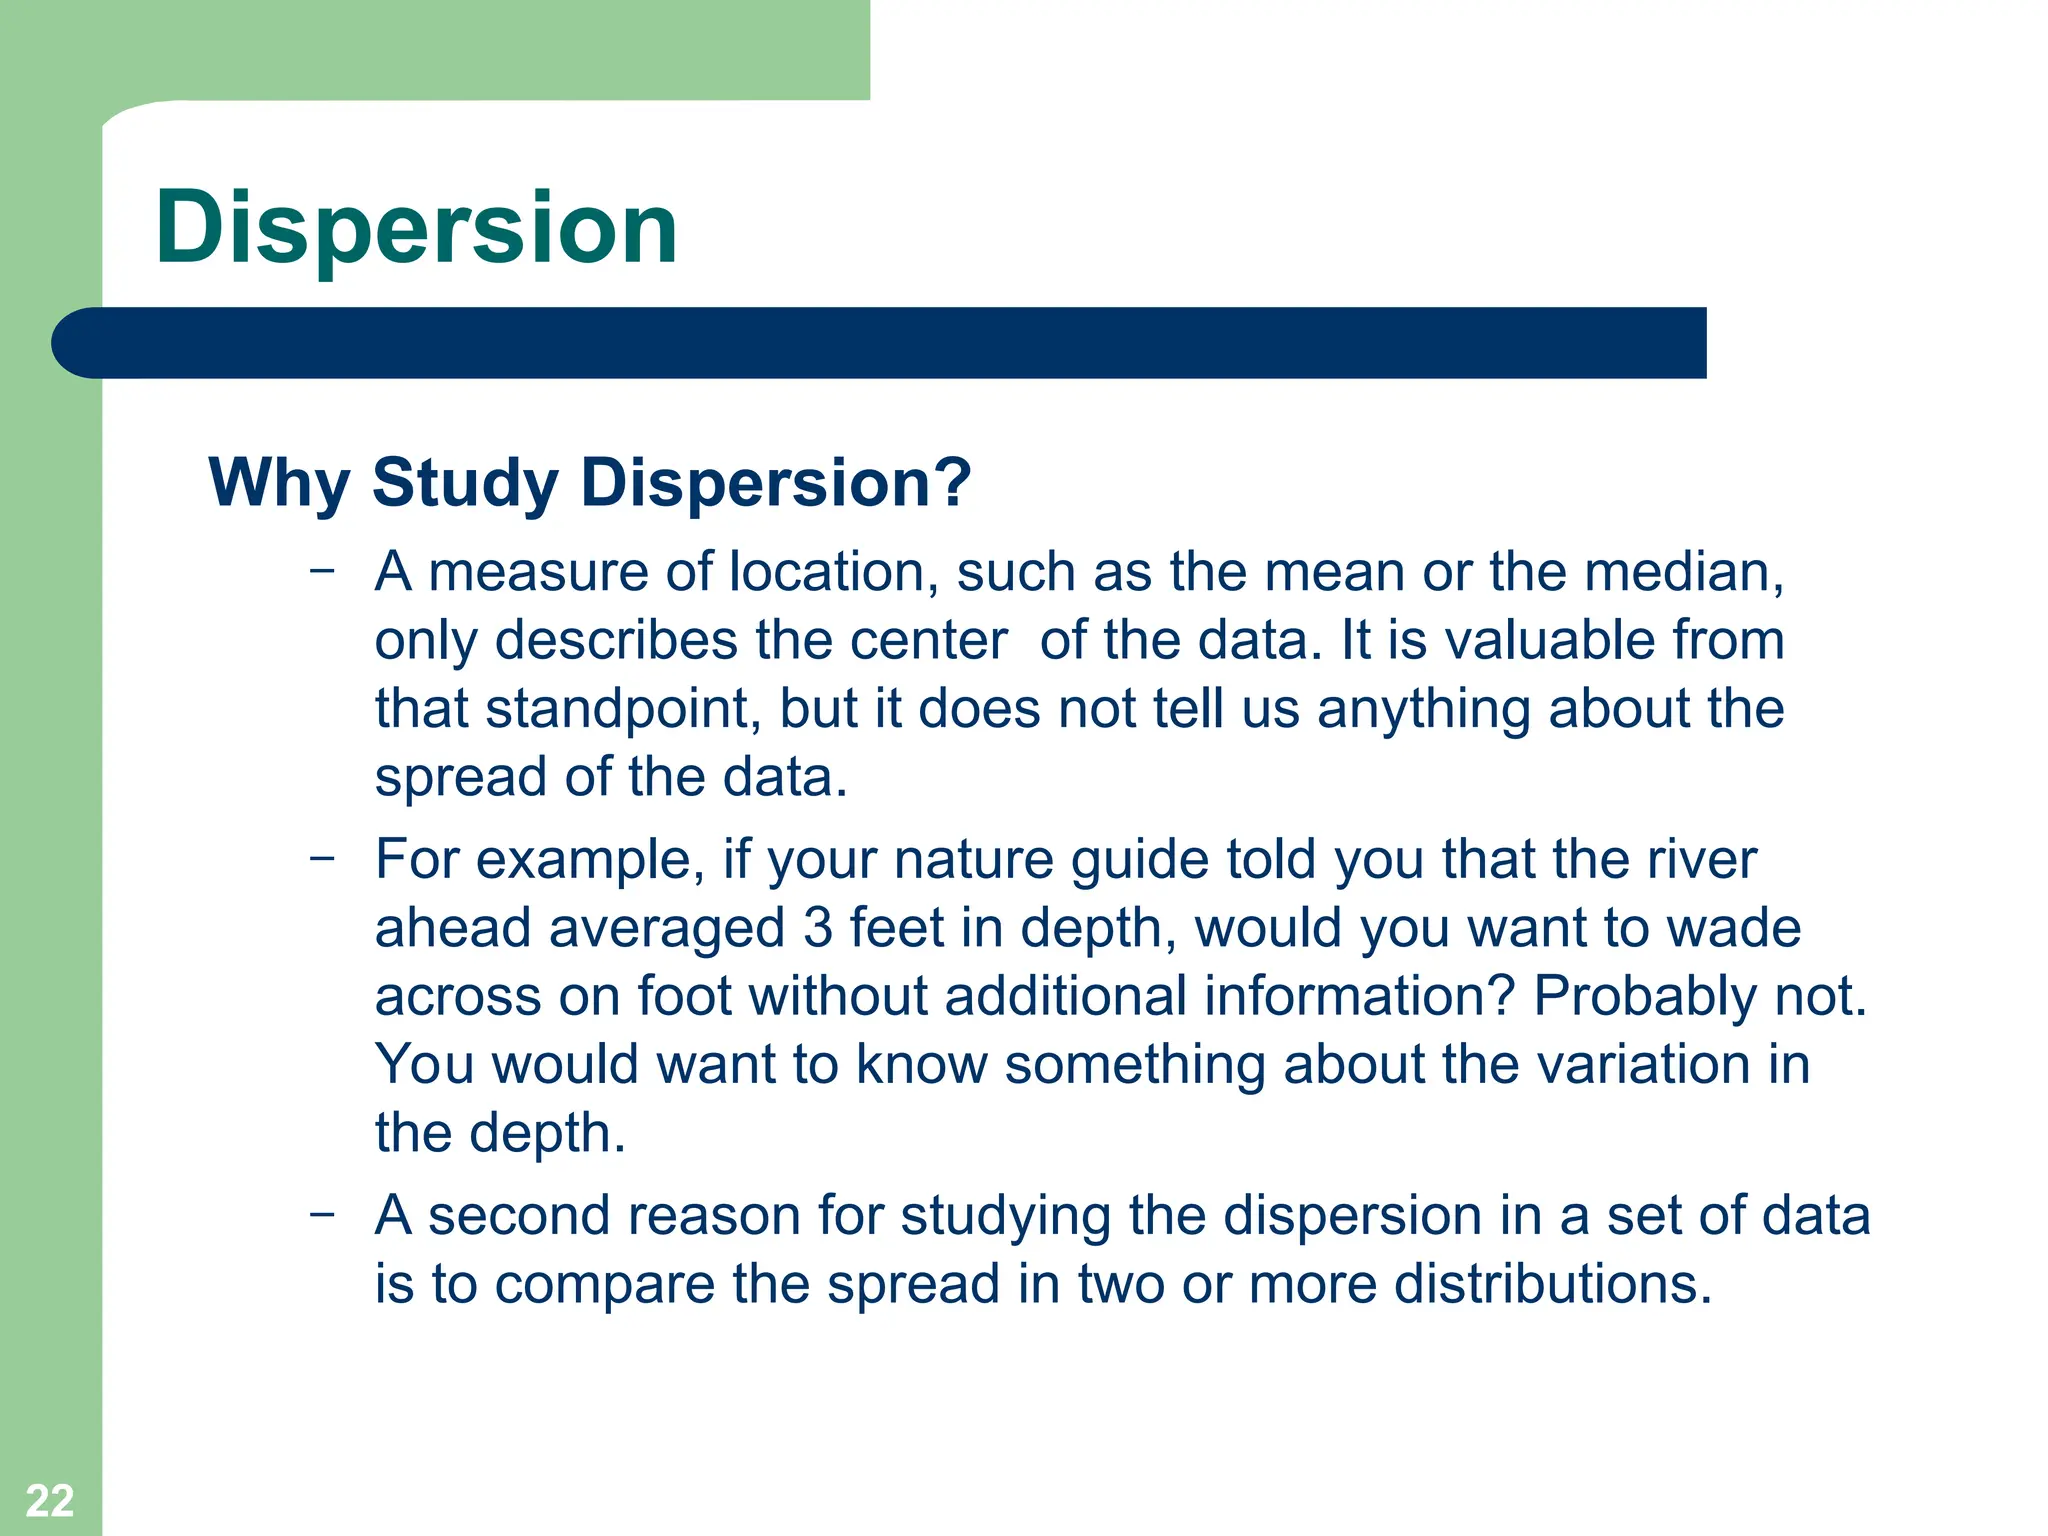
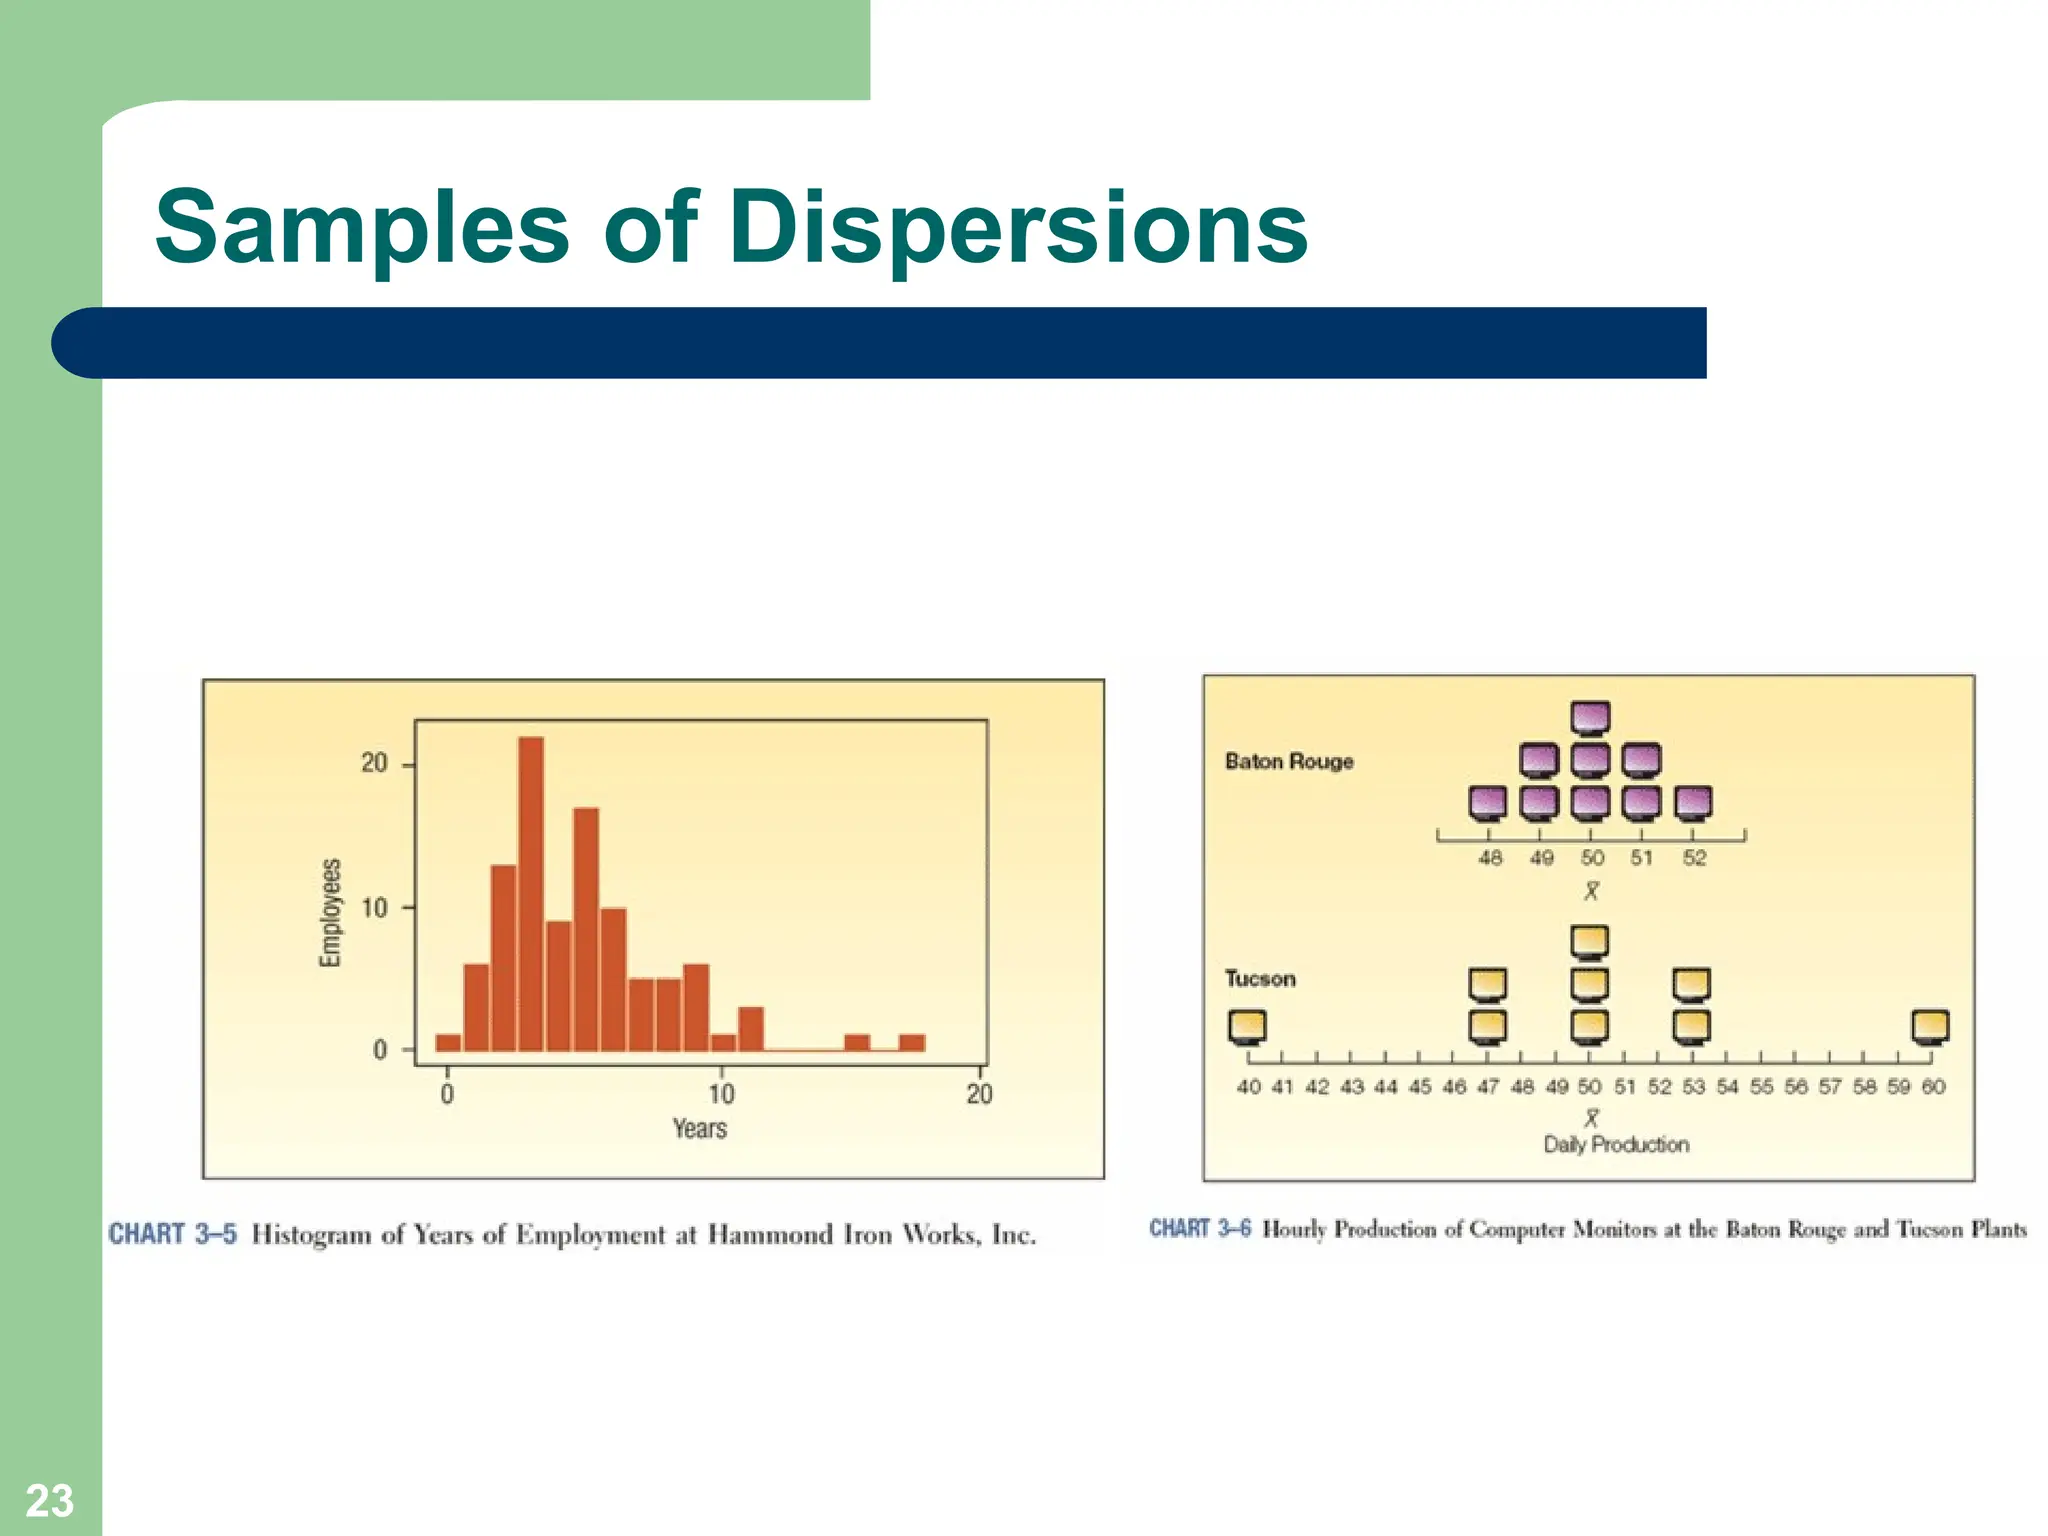
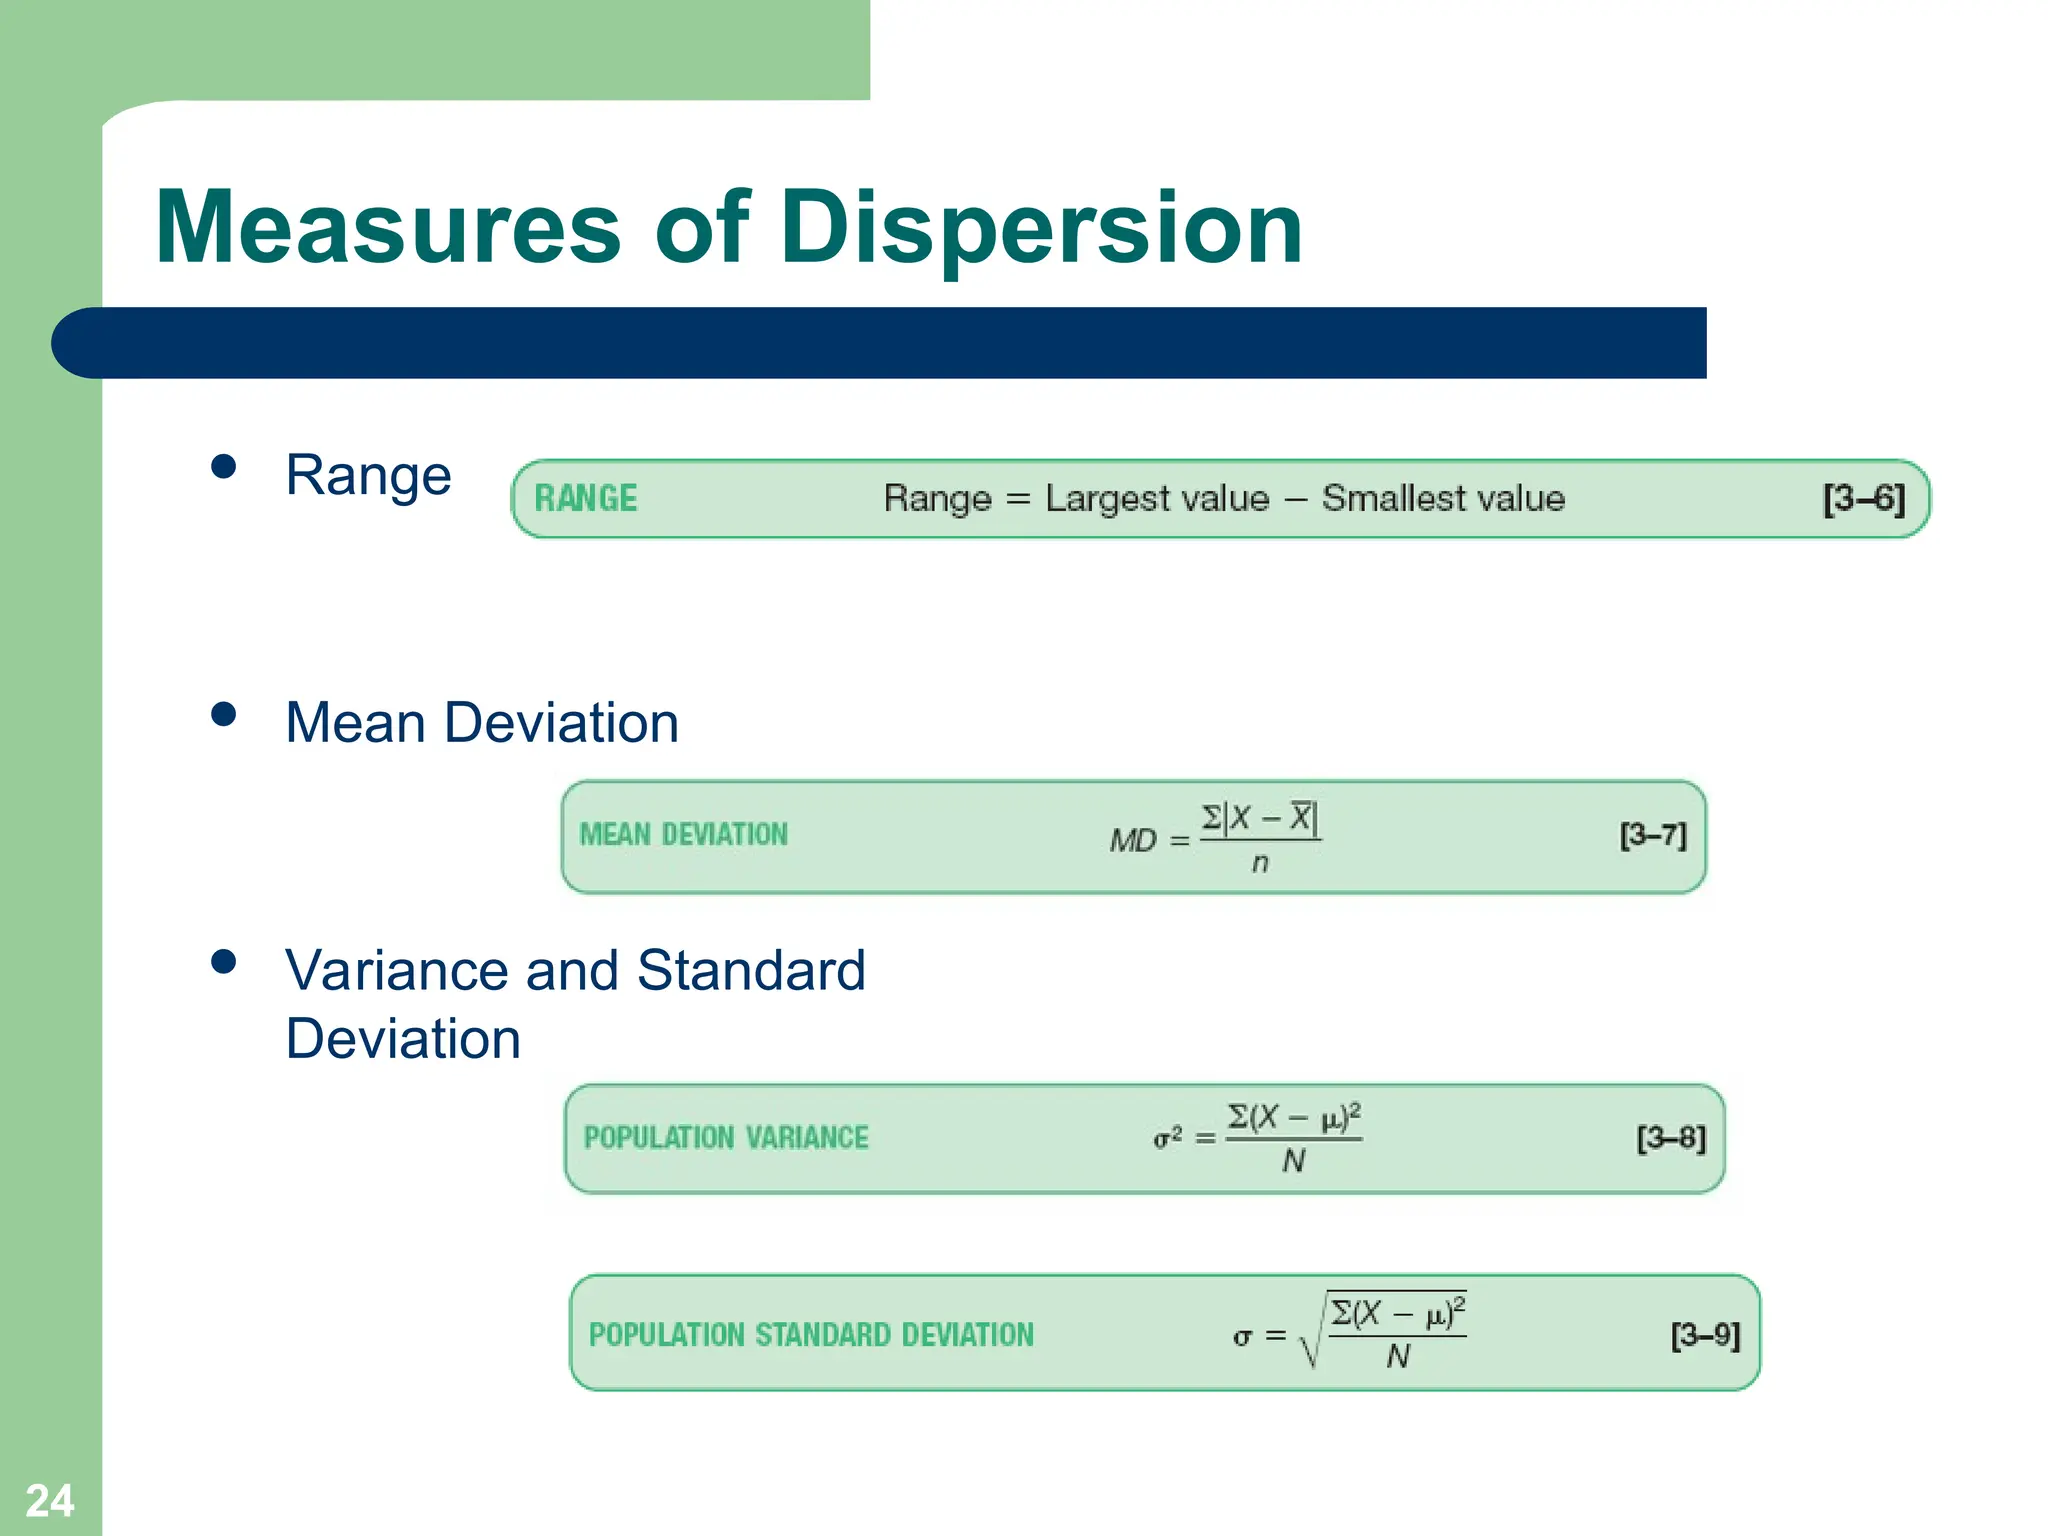
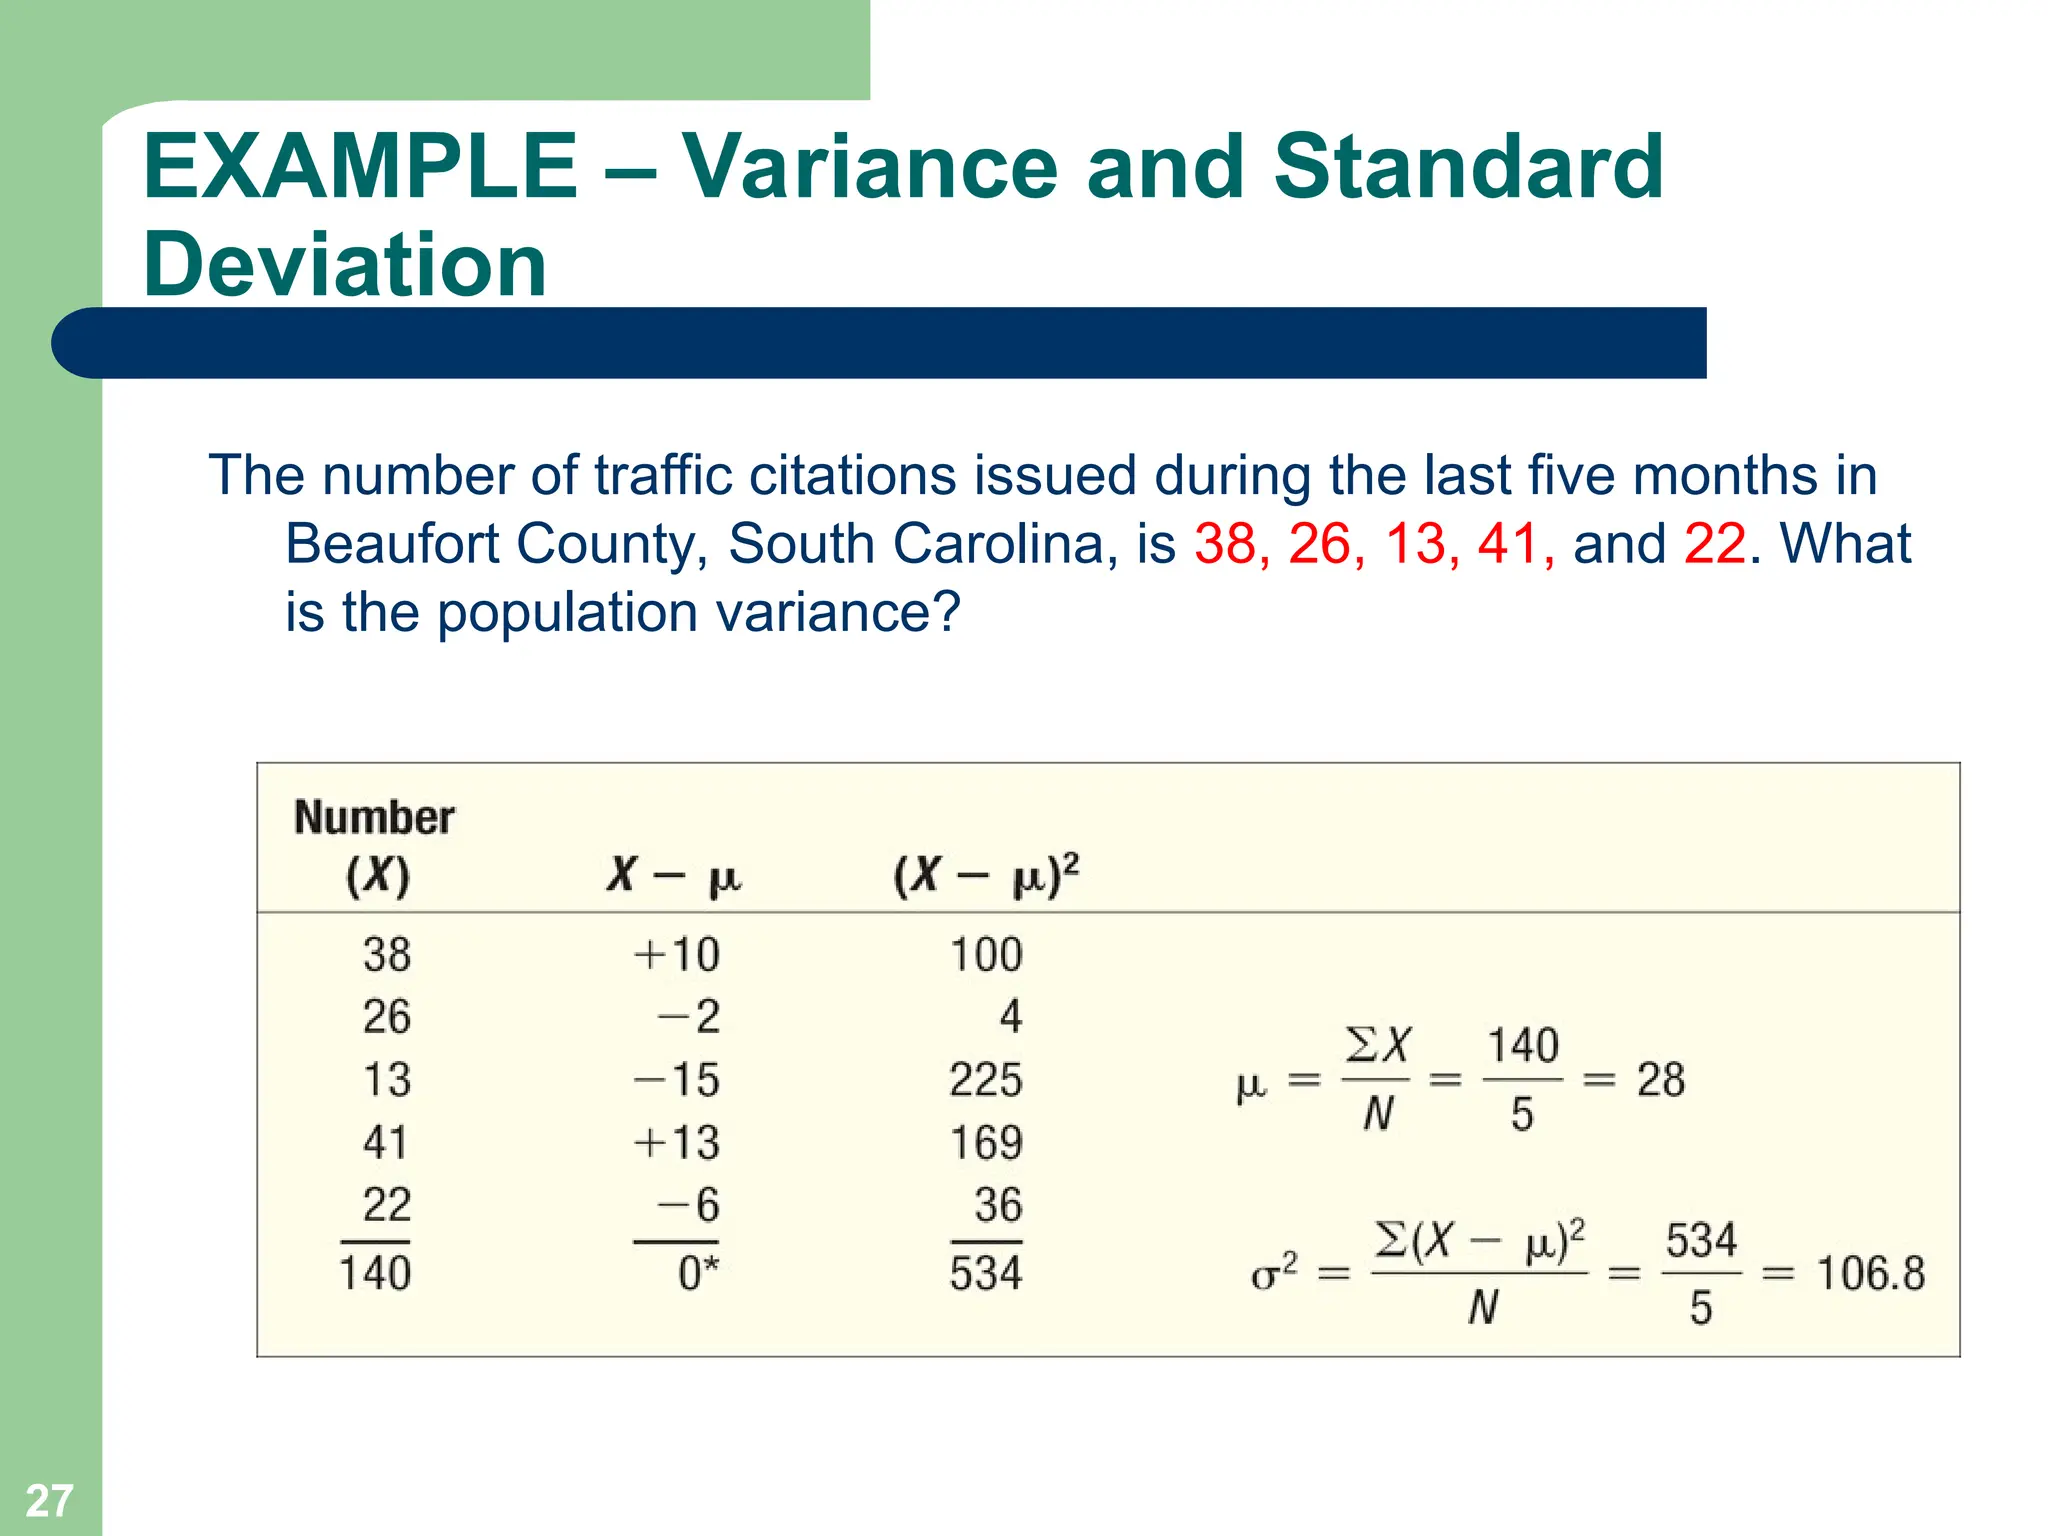
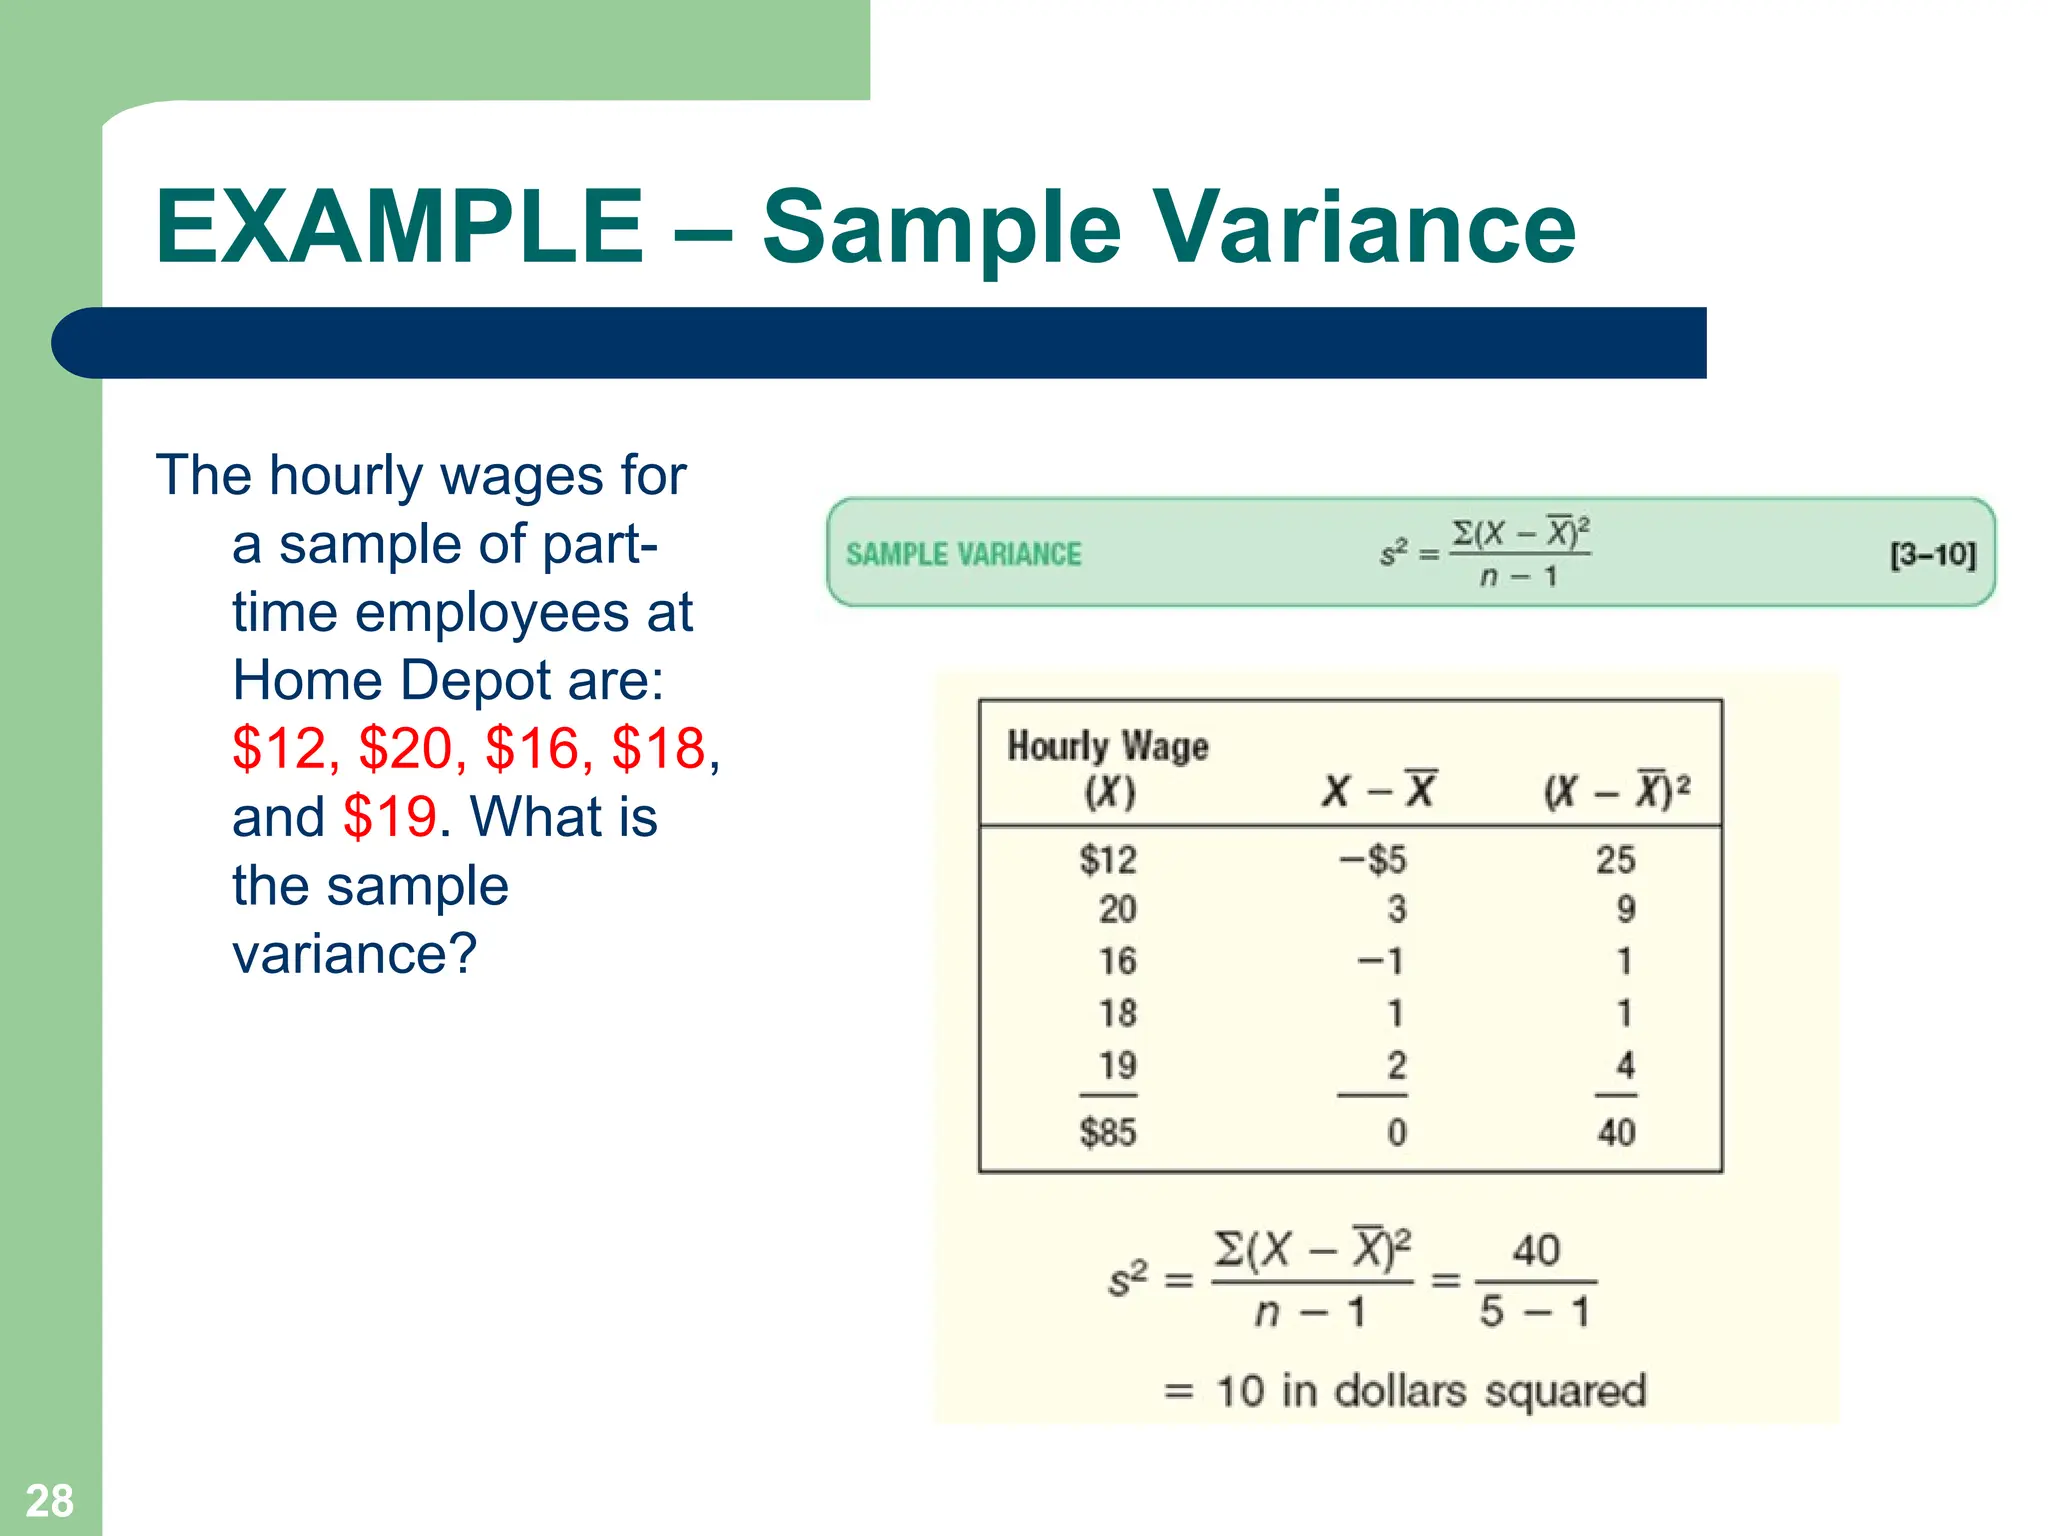
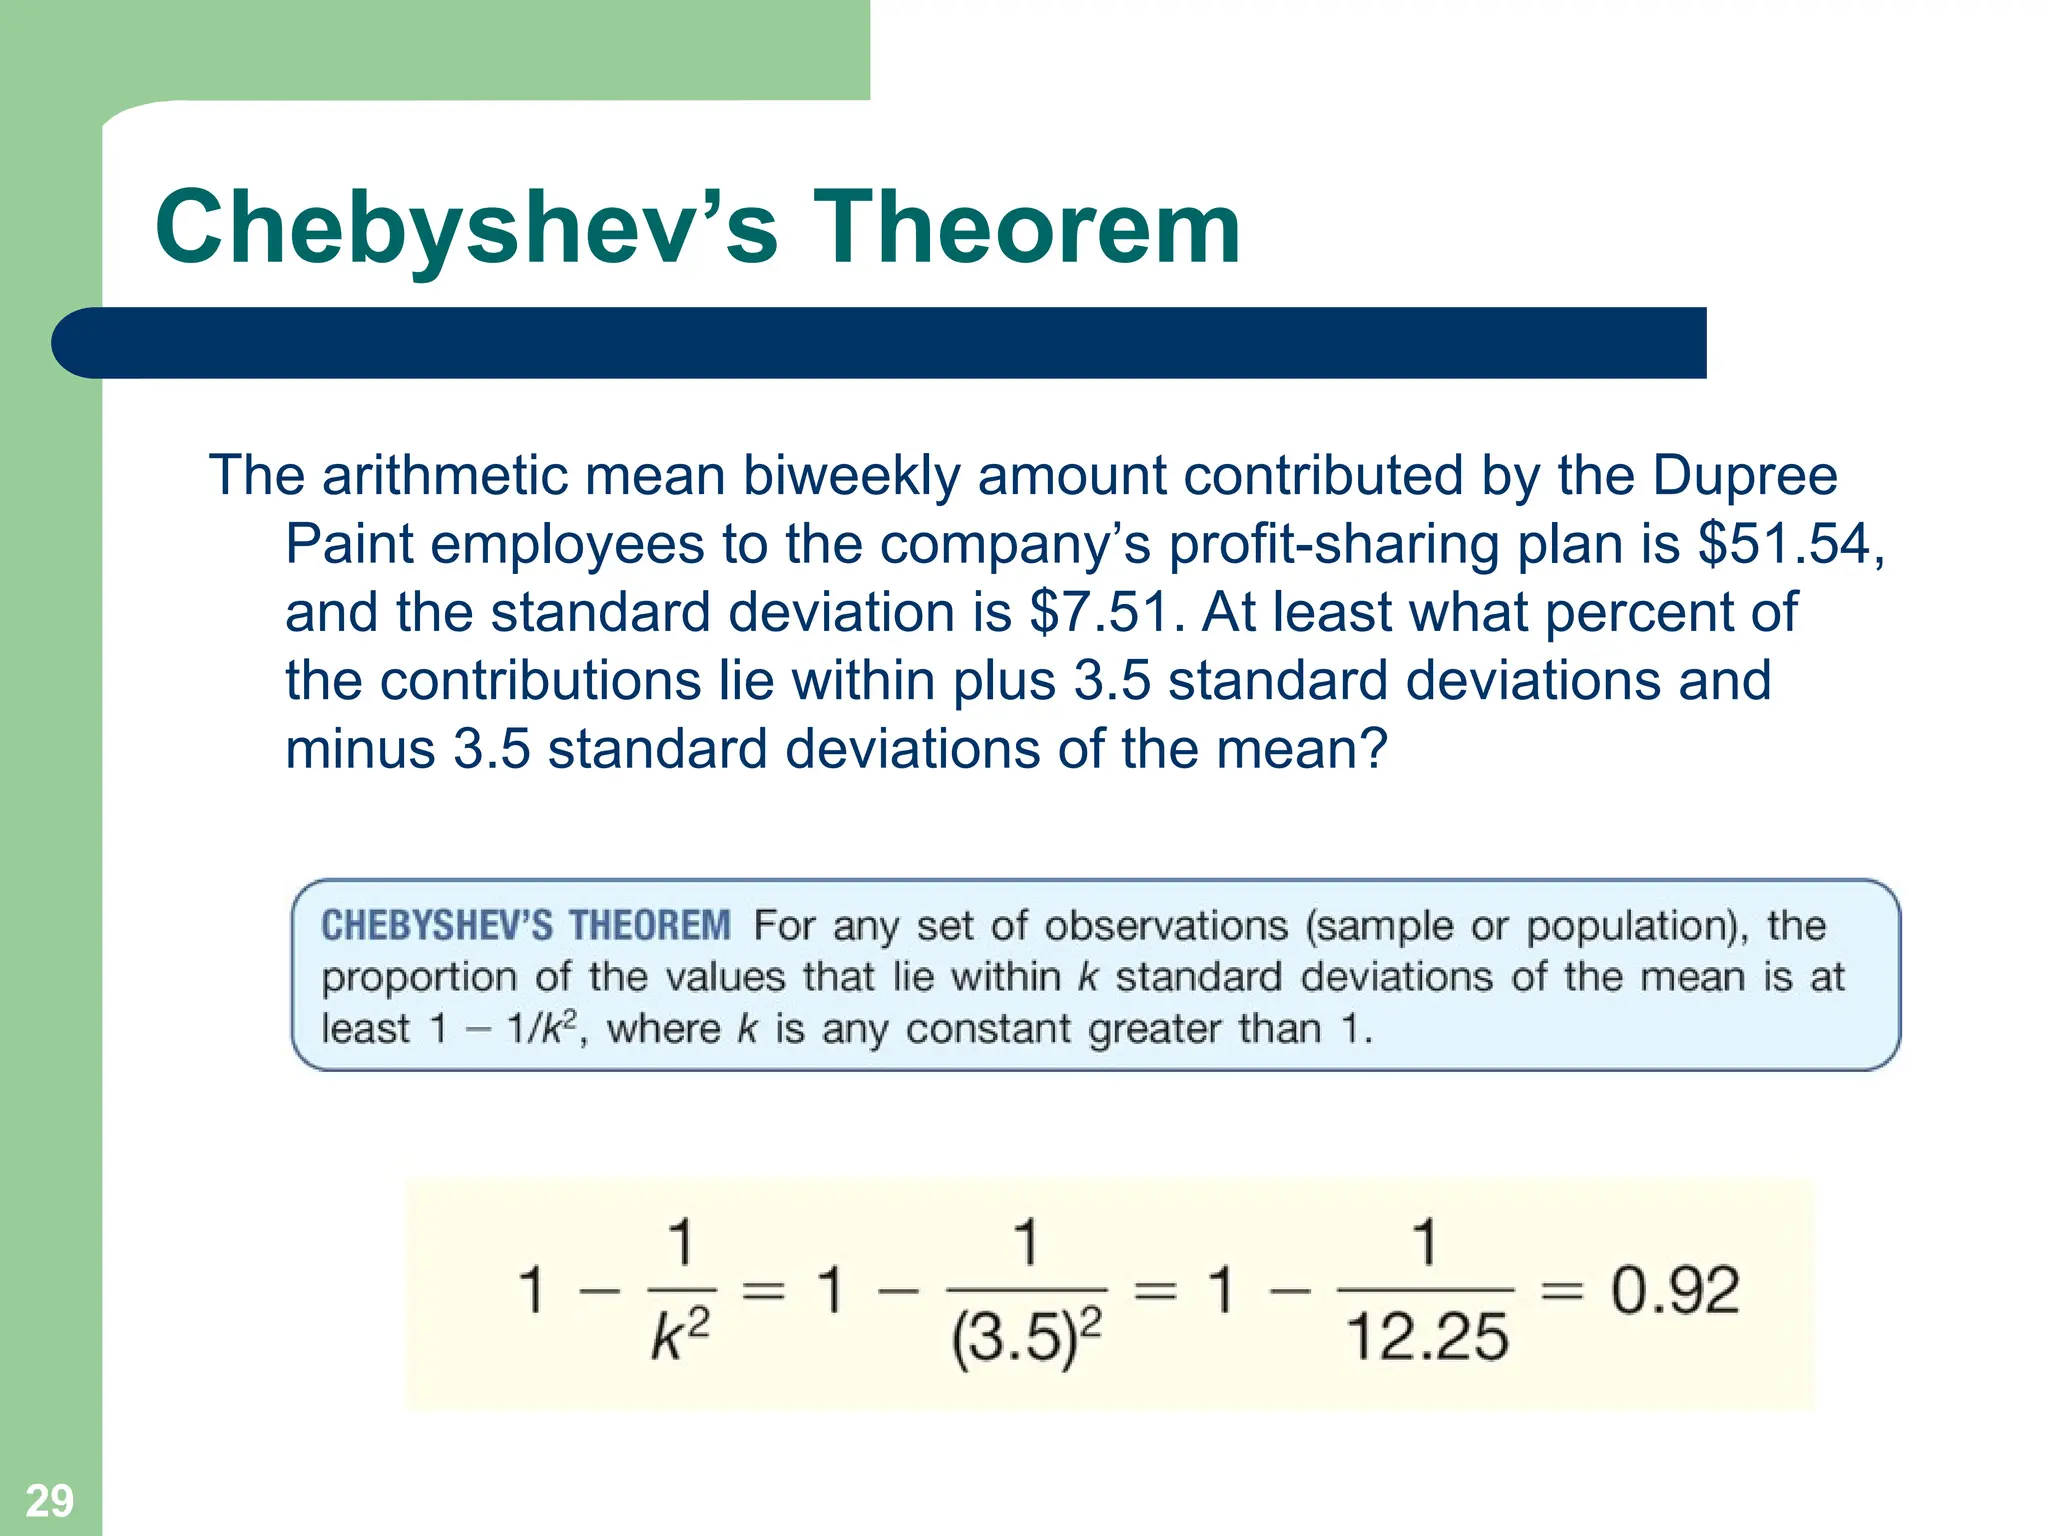
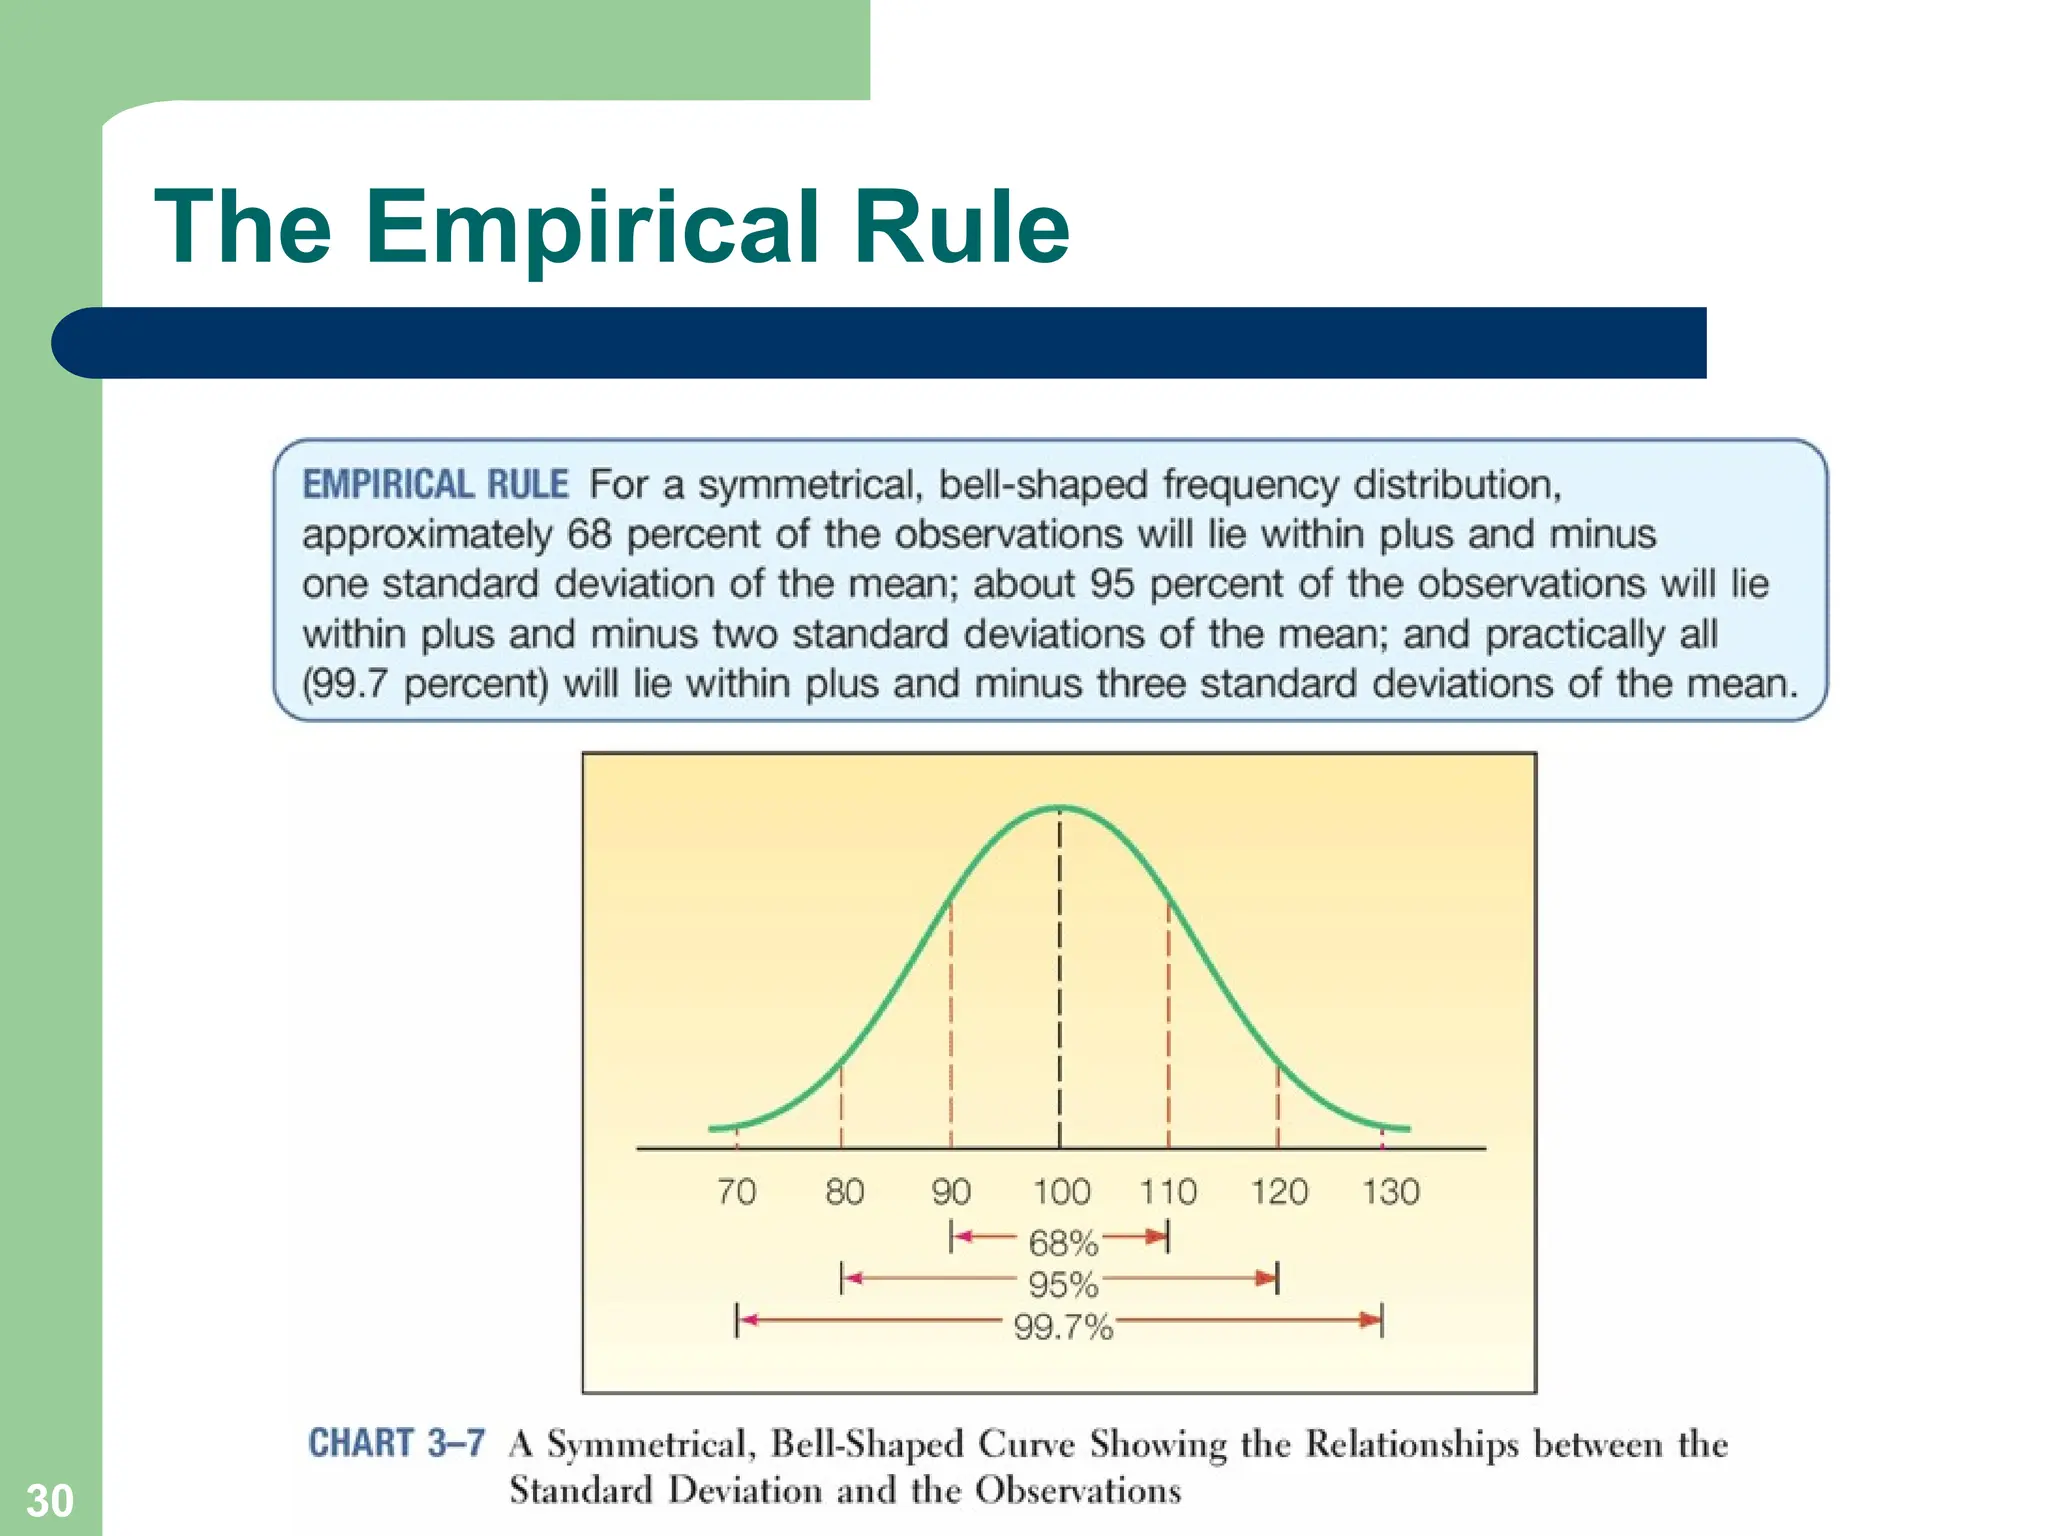
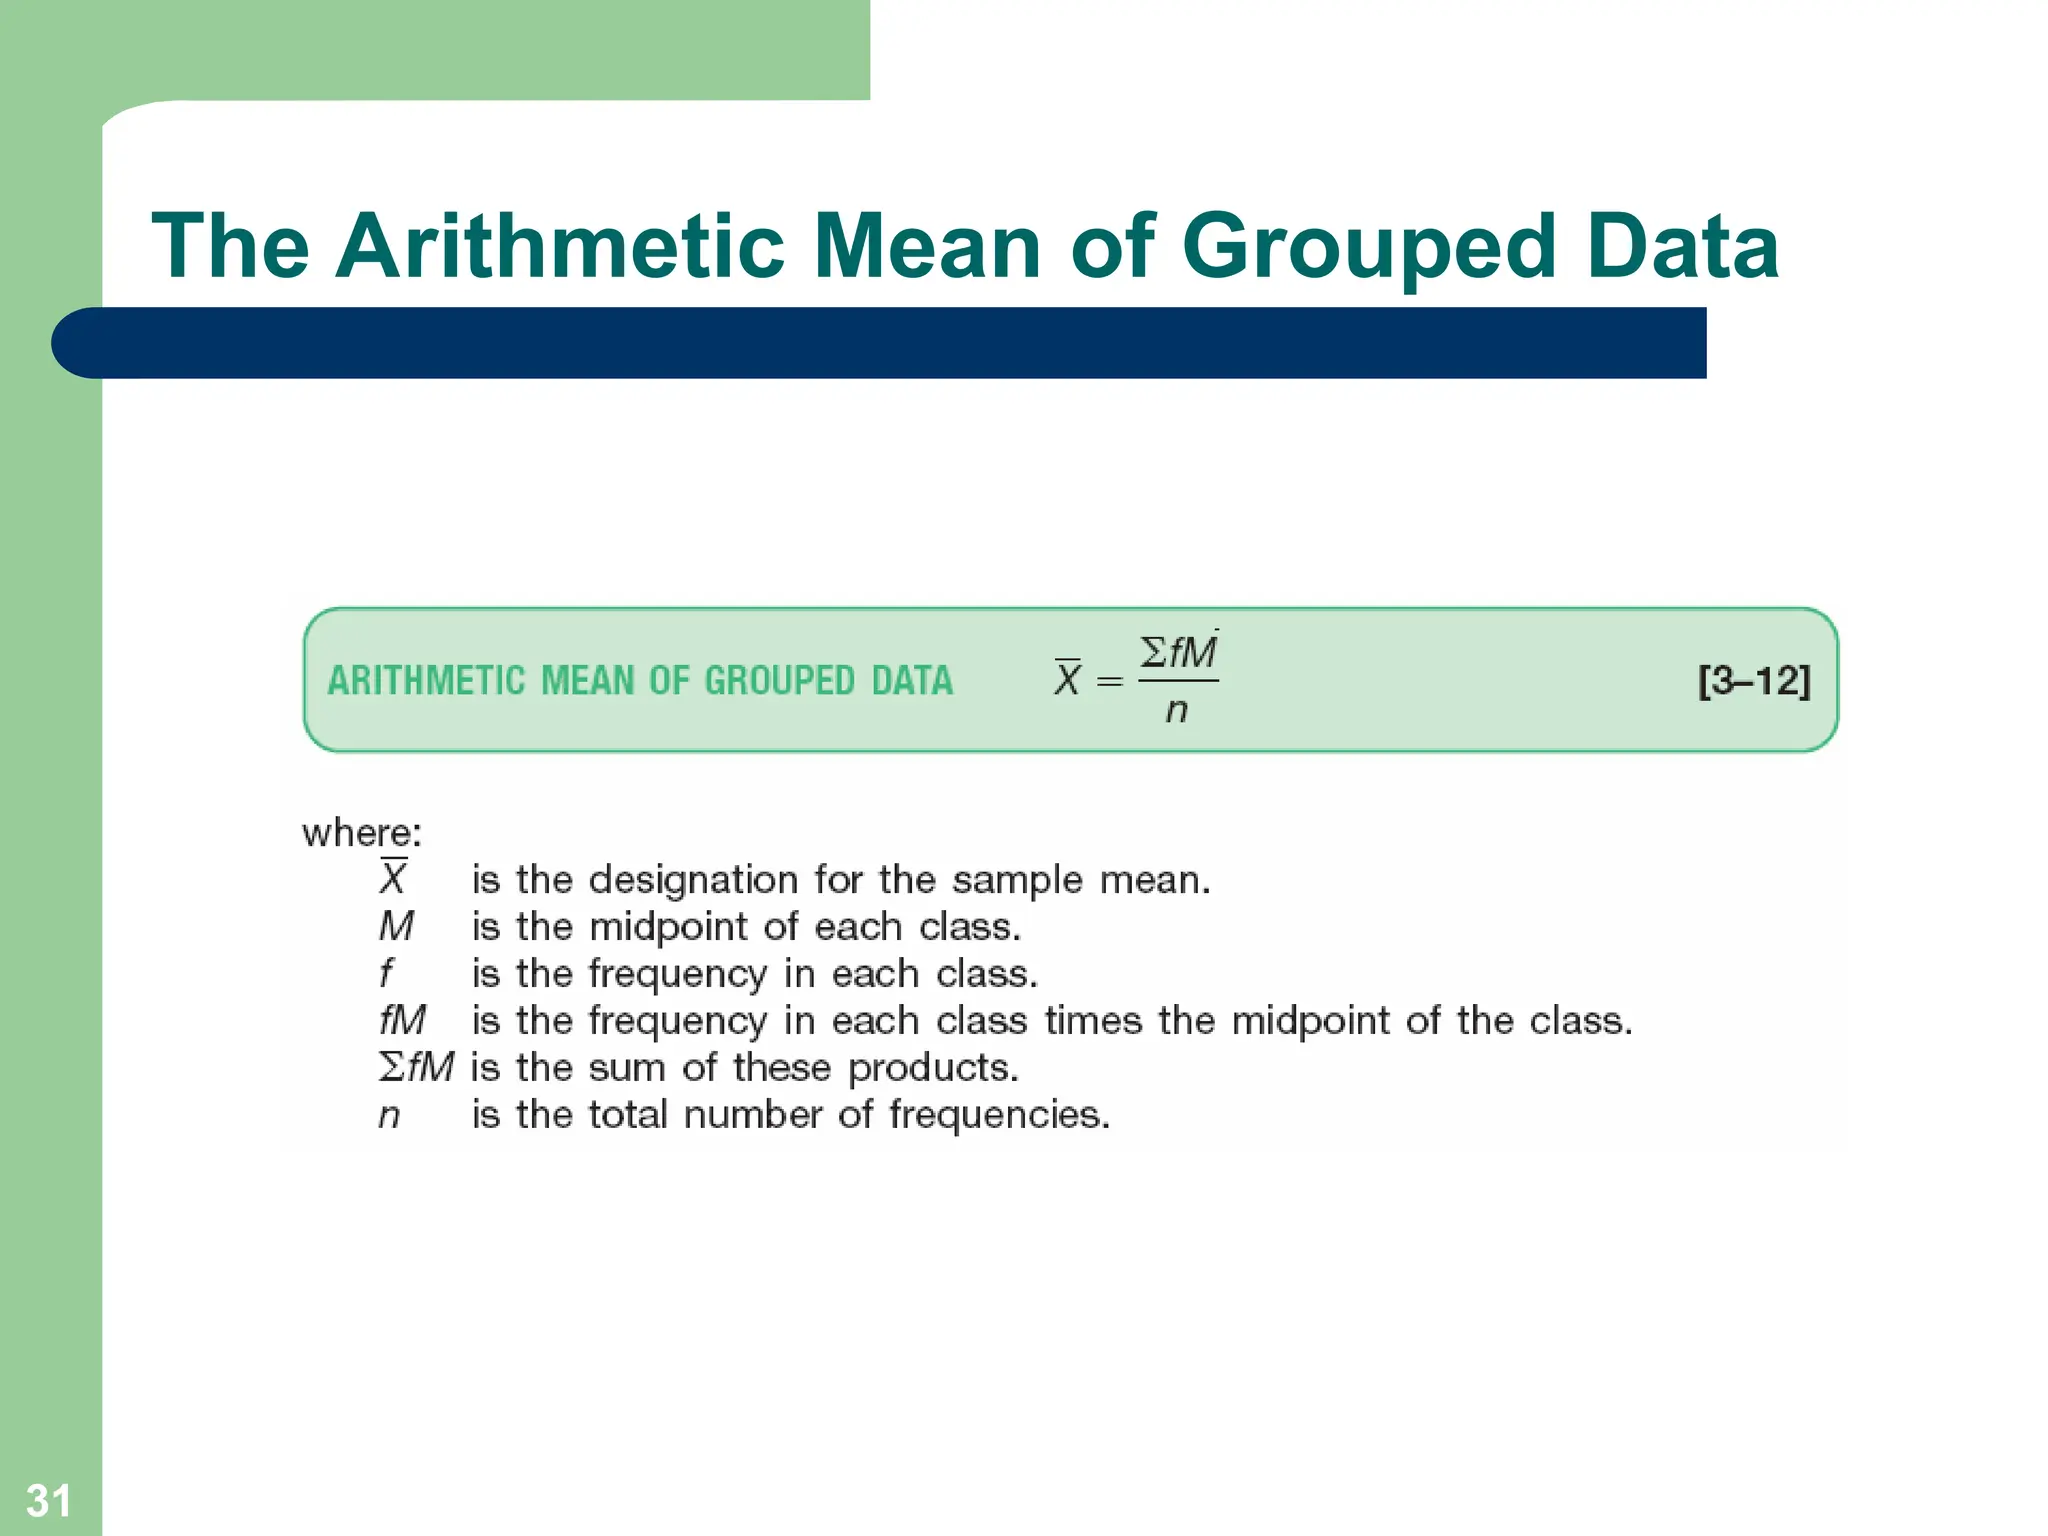
©The McGraw-Hill Companies, Inc. 2008
McGraw-Hill/Irwin
Describing Data:
Numerical Measures
Chapter 3
2
GOALS
• Calculate the arithmetic mean, weighted mean, median,
mode, and geometric mean.
• Explain the characteristics, uses, advantages, and
disadvantages of each measure of location.
• Identify the position of the mean, median, and mode for
both symmetric and skewed distributions.
• Compute and interpret the range, mean deviation,
variance, and standard deviation.
• Understand the characteristics, uses, advantages, and
disadvantages of each measure of dispersion.
• Understand Chebyshev’s theorem and the Empirical
Rule as they relate to a set of observations.
3
Characteristics of the Mean
The arithmetic mean is the most widely used
measure of location. It requires the interval
scale. Its major characteristics are:
– All values are used.
– It is unique.
– The sum of the deviations from the mean is 0.
– It is calculated by summing the values and dividing by the
number of values.
4
Population Mean
For ungrouped data, the population mean is the
sum of all the population values divided by the
total number of population values:
5
EXAMPLE – Population Mean
6
Sample Mean
 For ungrouped data, the sample mean is the
sum of all the sample values divided by the
number of sample values:
7
EXAMPLE – Sample Mean
8
Properties of the Arithmetic Mean
 Every set of interval-level and ratio-level data has a mean.
 All the values are included in computing the mean.
 A set of data has a unique mean.
 The mean is affected by unusually large or small data values.
 The arithmetic mean is the only measure of central tendency
where the sum of the deviations of each value from the mean is
zero.
9
Weighted Mean
 The weighted mean of a set of numbers X1,
X2, ..., Xn, with corresponding weights w1, w2,
...,wn, is computed from the following
formula:
10
EXAMPLE – Weighted Mean
The Carter Construction Company pays its hourly
employees $16.50, $19.00, or $25.00 per hour. There
are 26 hourly employees, 14 of which are paid at the
$16.50 rate, 10 at the $19.00 rate, and 2 at the $25.00
rate. What is the mean hourly rate paid the 26
employees?
11
The Median
The Median is the midpoint of the values
after they have been ordered from the
smallest to the largest.
– There are as many values above the median as below it in
the data array.
– For an even set of values, the median will be the arithmetic
average of the two middle numbers.
12
Properties of the Median
 There is a unique median for each data set.
 It is not affected by extremely large or small
values and is therefore a valuable measure
of central tendency when such values occur.
 It can be computed for ratio-level, interval-
level, and ordinal-level data.
 It can be computed for an open-ended
frequency distribution if the median does not
lie in an open-ended class.
13
EXAMPLES - Median
The ages for a sample of
five college students are:
21, 25, 19, 20, 22
Arranging the data in
ascending order gives:
19, 20, 21, 22, 25.
Thus the median is 21.
The heights of four
basketball players, in
inches, are:
76, 73, 80, 75
Arranging the data in
ascending order gives:
73, 75, 76, 80.
Thus the median is 75.5
14
The Mode
 The mode is the value of the observation
that appears most frequently.
15
Example - Mode
16
Mean, Median, Mode Using Excel
Table 2–4 in Chapter 2 shows the prices of the 80 vehicles sold last month at Whitner Autoplex in
Raytown, Missouri. Determine the mean and the median selling price. The mean and the median
selling prices are reported in the following Excel output. There are 80 vehicles in the study. So the
calculations with a calculator would be tedious and prone to error.
17
Mean, Median, Mode Using Excel
18
The Relative Positions of the Mean,
Median and the Mode
19
The Geometric Mean
 Useful in finding the average change of percentages, ratios, indexes,
or growth rates over time.
 It has a wide application in business and economics because we are
often interested in finding the percentage changes in sales, salaries,
or economic figures, such as the GDP, which compound or build on
each other.
 The geometric mean will always be less than or equal to the
arithmetic mean.
 The geometric mean of a set of n positive numbers is defined as the
nth root of the product of n values.
 The formula for the geometric mean is written:
20
EXAMPLE – Geometric Mean
Suppose you receive a 5 percent increase in
salary this year and a 15 percent increase
next year. The average annual percent
increase is 9.886, not 10.0. Why is this so?
We begin by calculating the geometric mean.
09886
1
15
1
05
1 .
)
.
)(
.
(
GM 

21
EXAMPLE – Geometric Mean (2)
The return on investment earned by Atkins
construction Company for four successive
years was: 30 percent, 20 percent, 40 percent,
and 200 percent. What is the geometric mean
rate of return on investment?
.
.
)
.
)(
.
)(
.
)(
.
(
GM 294
1
808
2
0
3
6
0
2
1
3
1 4
4 


22
Dispersion
Why Study Dispersion?
– A measure of location, such as the mean or the median,
only describes the center of the data. It is valuable from
that standpoint, but it does not tell us anything about the
spread of the data.
– For example, if your nature guide told you that the river
ahead averaged 3 feet in depth, would you want to wade
across on foot without additional information? Probably not.
You would want to know something about the variation in
the depth.
– A second reason for studying the dispersion in a set of data
is to compare the spread in two or more distributions.
23
Samples of Dispersions
24
Measures of Dispersion
 Range
 Mean Deviation
 Variance and Standard
Deviation
25
EXAMPLE – Range
The number of cappuccinos sold at the Starbucks location in the
Orange Country Airport between 4 and 7 p.m. for a sample of 5
days last year were 20, 40, 50, 60, and 80. Determine the mean
deviation for the number of cappuccinos sold.
Range = Largest – Smallest value
= 80 – 20 = 60
26
EXAMPLE – Mean Deviation
The number of cappuccinos sold at the Starbucks location in the
Orange Country Airport between 4 and 7 p.m. for a sample of 5
days last year were 20, 40, 50, 60, and 80. Determine the mean
deviation for the number of cappuccinos sold.
27
EXAMPLE – Variance and Standard
Deviation
The number of traffic citations issued during the last five months in
Beaufort County, South Carolina, is 38, 26, 13, 41, and 22. What
is the population variance?
28
EXAMPLE – Sample Variance
The hourly wages for
a sample of part-
time employees at
Home Depot are:
$12, $20, $16, $18,
and $19. What is
the sample
variance?
29
Chebyshev’s Theorem
The arithmetic mean biweekly amount contributed by the Dupree
Paint employees to the company’s profit-sharing plan is $51.54,
and the standard deviation is $7.51. At least what percent of
the contributions lie within plus 3.5 standard deviations and
minus 3.5 standard deviations of the mean?
30
The Empirical Rule
31
The Arithmetic Mean of Grouped Data
32
Recall in Chapter 2, we
constructed a frequency
distribution for the vehicle
selling prices. The
information is repeated
below. Determine the
arithmetic mean vehicle
selling price.
The Arithmetic Mean of Grouped Data -
Example
33
The Arithmetic Mean of Grouped Data -
Example
34
Standard Deviation of Grouped Data
35
Standard Deviation of Grouped Data -
Example
Refer to the frequency distribution for the Whitner Autoplex data
used earlier. Compute the standard deviation of the vehicle
selling prices
36
End of Chapter 3

Probability and statistics : basics understanding of describing data

  • 1.
    ©The McGraw-Hill Companies,Inc. 2008 McGraw-Hill/Irwin Describing Data: Numerical Measures Chapter 3
  • 2.
    2 GOALS • Calculate thearithmetic mean, weighted mean, median, mode, and geometric mean. • Explain the characteristics, uses, advantages, and disadvantages of each measure of location. • Identify the position of the mean, median, and mode for both symmetric and skewed distributions. • Compute and interpret the range, mean deviation, variance, and standard deviation. • Understand the characteristics, uses, advantages, and disadvantages of each measure of dispersion. • Understand Chebyshev’s theorem and the Empirical Rule as they relate to a set of observations.
  • 3.
    3 Characteristics of theMean The arithmetic mean is the most widely used measure of location. It requires the interval scale. Its major characteristics are: – All values are used. – It is unique. – The sum of the deviations from the mean is 0. – It is calculated by summing the values and dividing by the number of values.
  • 4.
    4 Population Mean For ungroupeddata, the population mean is the sum of all the population values divided by the total number of population values:
  • 5.
  • 6.
    6 Sample Mean  Forungrouped data, the sample mean is the sum of all the sample values divided by the number of sample values:
  • 7.
  • 8.
    8 Properties of theArithmetic Mean  Every set of interval-level and ratio-level data has a mean.  All the values are included in computing the mean.  A set of data has a unique mean.  The mean is affected by unusually large or small data values.  The arithmetic mean is the only measure of central tendency where the sum of the deviations of each value from the mean is zero.
  • 9.
    9 Weighted Mean  Theweighted mean of a set of numbers X1, X2, ..., Xn, with corresponding weights w1, w2, ...,wn, is computed from the following formula:
  • 10.
    10 EXAMPLE – WeightedMean The Carter Construction Company pays its hourly employees $16.50, $19.00, or $25.00 per hour. There are 26 hourly employees, 14 of which are paid at the $16.50 rate, 10 at the $19.00 rate, and 2 at the $25.00 rate. What is the mean hourly rate paid the 26 employees?
  • 11.
    11 The Median The Medianis the midpoint of the values after they have been ordered from the smallest to the largest. – There are as many values above the median as below it in the data array. – For an even set of values, the median will be the arithmetic average of the two middle numbers.
  • 12.
    12 Properties of theMedian  There is a unique median for each data set.  It is not affected by extremely large or small values and is therefore a valuable measure of central tendency when such values occur.  It can be computed for ratio-level, interval- level, and ordinal-level data.  It can be computed for an open-ended frequency distribution if the median does not lie in an open-ended class.
  • 13.
    13 EXAMPLES - Median Theages for a sample of five college students are: 21, 25, 19, 20, 22 Arranging the data in ascending order gives: 19, 20, 21, 22, 25. Thus the median is 21. The heights of four basketball players, in inches, are: 76, 73, 80, 75 Arranging the data in ascending order gives: 73, 75, 76, 80. Thus the median is 75.5
  • 14.
    14 The Mode  Themode is the value of the observation that appears most frequently.
  • 15.
  • 16.
    16 Mean, Median, ModeUsing Excel Table 2–4 in Chapter 2 shows the prices of the 80 vehicles sold last month at Whitner Autoplex in Raytown, Missouri. Determine the mean and the median selling price. The mean and the median selling prices are reported in the following Excel output. There are 80 vehicles in the study. So the calculations with a calculator would be tedious and prone to error.
  • 17.
  • 18.
    18 The Relative Positionsof the Mean, Median and the Mode
  • 19.
    19 The Geometric Mean Useful in finding the average change of percentages, ratios, indexes, or growth rates over time.  It has a wide application in business and economics because we are often interested in finding the percentage changes in sales, salaries, or economic figures, such as the GDP, which compound or build on each other.  The geometric mean will always be less than or equal to the arithmetic mean.  The geometric mean of a set of n positive numbers is defined as the nth root of the product of n values.  The formula for the geometric mean is written:
  • 20.
    20 EXAMPLE – GeometricMean Suppose you receive a 5 percent increase in salary this year and a 15 percent increase next year. The average annual percent increase is 9.886, not 10.0. Why is this so? We begin by calculating the geometric mean. 09886 1 15 1 05 1 . ) . )( . ( GM  
  • 21.
    21 EXAMPLE – GeometricMean (2) The return on investment earned by Atkins construction Company for four successive years was: 30 percent, 20 percent, 40 percent, and 200 percent. What is the geometric mean rate of return on investment? . . ) . )( . )( . )( . ( GM 294 1 808 2 0 3 6 0 2 1 3 1 4 4   
  • 22.
    22 Dispersion Why Study Dispersion? –A measure of location, such as the mean or the median, only describes the center of the data. It is valuable from that standpoint, but it does not tell us anything about the spread of the data. – For example, if your nature guide told you that the river ahead averaged 3 feet in depth, would you want to wade across on foot without additional information? Probably not. You would want to know something about the variation in the depth. – A second reason for studying the dispersion in a set of data is to compare the spread in two or more distributions.
  • 23.
  • 24.
    24 Measures of Dispersion Range  Mean Deviation  Variance and Standard Deviation
  • 25.
    25 EXAMPLE – Range Thenumber of cappuccinos sold at the Starbucks location in the Orange Country Airport between 4 and 7 p.m. for a sample of 5 days last year were 20, 40, 50, 60, and 80. Determine the mean deviation for the number of cappuccinos sold. Range = Largest – Smallest value = 80 – 20 = 60
  • 26.
    26 EXAMPLE – MeanDeviation The number of cappuccinos sold at the Starbucks location in the Orange Country Airport between 4 and 7 p.m. for a sample of 5 days last year were 20, 40, 50, 60, and 80. Determine the mean deviation for the number of cappuccinos sold.
  • 27.
    27 EXAMPLE – Varianceand Standard Deviation The number of traffic citations issued during the last five months in Beaufort County, South Carolina, is 38, 26, 13, 41, and 22. What is the population variance?
  • 28.
    28 EXAMPLE – SampleVariance The hourly wages for a sample of part- time employees at Home Depot are: $12, $20, $16, $18, and $19. What is the sample variance?
  • 29.
    29 Chebyshev’s Theorem The arithmeticmean biweekly amount contributed by the Dupree Paint employees to the company’s profit-sharing plan is $51.54, and the standard deviation is $7.51. At least what percent of the contributions lie within plus 3.5 standard deviations and minus 3.5 standard deviations of the mean?
  • 30.
  • 31.
    31 The Arithmetic Meanof Grouped Data
  • 32.
    32 Recall in Chapter2, we constructed a frequency distribution for the vehicle selling prices. The information is repeated below. Determine the arithmetic mean vehicle selling price. The Arithmetic Mean of Grouped Data - Example
  • 33.
    33 The Arithmetic Meanof Grouped Data - Example
  • 34.
  • 35.
    35 Standard Deviation ofGrouped Data - Example Refer to the frequency distribution for the Whitner Autoplex data used earlier. Compute the standard deviation of the vehicle selling prices
  • 36.