Downloaded 1,240 times


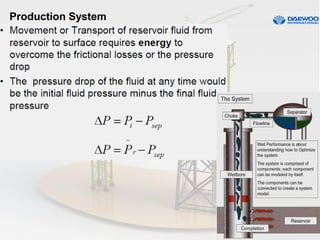


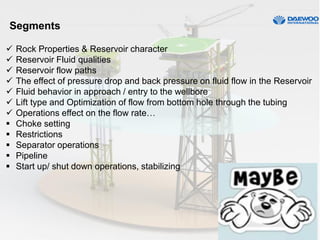


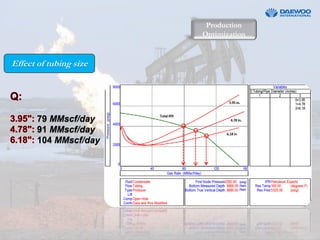


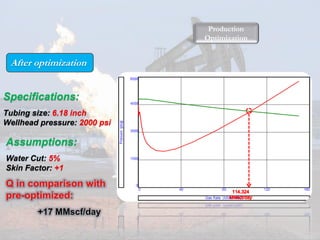


The document provides information on production optimization through system analysis using nodal analysis. It discusses key components of the production system including reservoir fluid properties, inflow performance, tubing performance, and how to analyze the combined system. The objectives are to understand inflow, vertical lift, and combined performance. Nodal analysis is introduced as a technique to simulate fluid flow by breaking the system into nodes and ensuring pressure continuity. An example application optimizes a well's production rate by analyzing effects of tubing size, wellhead pressure, water cut, and skin on the combined inflow and outflow curves. The optimized design achieves a production rate of 114 MMscf/d with a 6.18" tubing and 2,000 psi