SlideShare a Scribd company logo
1 of 10
Download to read offline
Customer Centric Sales Strategies supporting Cross Selling – WILLIAM SURMON
Proactive Cross selling / customer contact strategies, can be viewed from two important aspects.
The first aspect, involves Information Management, and the technologies which it employs to
generate Customer Insights, which in turn support & sustain customer specific sales and marketing
strategies, and the second aspect involves the Segment Business Unit, and their ability to generate
revenue growth & sales from the Customer Insights received. In both cases, the speed of Execution
from Insight to Action remains the critical success factor.
Information led proactive selling techniques create the opportunity for increasing ROI, using
Lifestage and affordability as two key dimensions for selecting product or service combinations
linked with appropriate product mix matrix, propensity models and event based triggers.
Cross Selling from a Reactive Selling Strategy, occurs through the maximisation of the sales interview
within the Physical Sales Force “Face to Face time”, strong self service offerings as well as the
inbound component of the Contact Centre.
This document focuses on creating the capability to optimise & grow an effective “proactive”
customer centric strategy, based on segmentation, customer profiling and the appropriate customer
value proposition.
DefiningCrossSelling
The current cross sell ratio is defined by dividing the total nett segment specific customer base into
the total nett products linked to those customers on the central customer data base. There could
arise differences between published cross sell ratios, which is mainly due to customer allocation
rules applied differently within business units and support functions.
To gain a better perspective on the Cross Sell ratio, this basic formula should be divided into the
components which make up the holistic equation:
SOLD
PRODUCTS
RETAINED
PRODUCTS
MIGRATED
PRODUCTS
GROSS
PRODUCTS
LESS
CLOSED
PRODUCTS
MIGRATED
PRODUCTS
PRODUCT
OUTFLOW
EQUALS
NETT
PRODUCTS
NEW
CUSTOMERS
RETAINED
CUSTOMERS
NEW
CUSTOMER
RELATIONS
MIGRATED
CUSTOMERS
GROSS
CUSTOMERS
LESS
LOST
CUSTOMERS
LOST
CUSTOMER
RELATIONS
MIGRATED
CUSTOMERS
CUSTOMER
OUTFLOW
EQUALS
NETT
CUSTOMERS
DIVIDED BY:
CROSSSELLRATIO
The application of this ratio is flawed due to the following:
• Customer allocation rules ( Segment vs Product business units )
• It is not Strategy Sensitive:
• Profitability vs Market Share Growth
• Customer Growth, Retention strategies
• Operating model customer allocation rules
• Seasonal & Economic Cycles.
• It is not Sub Segment focused
PROITABILITY
FINANCIAL
PERSPECTIVE
CUSTOMER
PERSPECTIVE
INTERNAL
PERSPECTIVE
RESOURCE
PERSPECTIVE
MARKET SHARE
FINANCIAL
PERSPECTIVE
CUSTOMER
PERSPECTIVE
INTERNAL
PERSPECTIVE
RESOURCE
PERSPECTIVE
C
U
R
R
E
N
T
V
I
E
W
D
E
S
I
R
E
D
S
T
A
T
E
Reflecting on the ratio calculation, it becomes evident that the Cross Sell Ratio, could be impacted by
a host of factors, not only through expanding a customer’s existing account portfolio with additional
product sales or service offerings.
It also implies that in order to positively impact the Cross sell ratio, there is a need to:
• Cross sell & product bundle at the source of customer acquisition.
• Retain existing customers, especially those who have multiple product / service portfolios.
• Take note of customers that are migrated to other Segment or Product SBUs in line with
their current Operating Model and Segmentation / Migration rules.
It is important to understand that the Cross Sell ratio will drop, with every new customer that is
acquired, who does not have a Cross Sell ratio larger than 1:1. i.e. The ratio drops with every new
stand alone customer acquired.
In addition, this is also impacted by the affordability of the lower end of the segmented customer
base.
To summarise, the basic customer strategies impacting the Cross Sell ratio are: (UCARE)
• Acquisition - New customer acquisition
• Retention - Existing customer retention
• Cost / Profitability Management - Customer migration / allocation within segments related
to CVPs
• Expansion - Customer relationship expansion
• Utilisation - Account Utilisation
This understanding of the various Cross Sell factors, supports the view that all Product and Segment
SBUs are either directly or indirectly responsible for the resultant Cross Sell Ratio. This responsibility
is linked to their value proposition, product offering and the manner in which customers are
acquired and retained.
Furthermore, it is pertinent to understand the impact of the following additional factors, on the
ability to ‘Cross Sell’ and the effectiveness of it:
• Affordability ( Customers ability to pay for additional products)
• Life Stage ( A customers need for a product )
• Customer Profitability ( Usage of the product - Fair Value )
• Product Offering ( Most appropriate product )
• Legislation ( FAIS, NCA etc )
• Dormancies / Closures ( Usage vs start up & admin costs )
• Enablement within the Value Chain - Fulfilment process and the impact thereof on the
success of the ‘Sale’ ( End to End virtual fulfilment ) and policy / governance / compliance
interpretations and applications.
Cross Selling can therefore be defined as:
• ‘A proactive, customer centric, additional offering / solution to an existing or new customer,
which results in a mutually beneficial commercial relationship’.
The Cross Selling ratio should be defined as:
• ‘A strategically sensitive ratio, applied to a specific sub segment, with the intention of
positively influencing the overall profitability or market share of the identified sub
segment’, while enhancing the customers financial situation and service experience.
Accordingly, any customer focused activity initiated by a segment SBU towards the specific
customer segment, has operational and commercial consequences for the remainder of the product
SBUs within the corporate entity, and the Cross Sell ratio for the customer segment involved. It is
therefore crucial, for a collaborative, segment customer Value Proposition and contact strategy to
be established throughout the corporate entity. In addition, the segment will need to identify at
least 4 or more separate cross sell ratios, against which it can measure related performance and get
consensus for these with all stakeholders.
Importance of Cross Selling
Cross selling alone will not achieve substantial revenue growth if viewed in isolation. Revenue
growth is achieved through a blend of Acquisition, Retention, Expansion, Cost Management /
profitability, and Utilisation strategies.
However, ‘Cross Selling’ to the existing customer base, will, if conducted responsibly, result in a
substantial contribution to the overall segment revenue growth.
So what is a responsible approach to ‘Cross Selling’, and what potential value can it contribute?
In order to define a responsible approach, it is important to understand the existing Customer
Market, both from an internal as well as an external perspective.
Using statistics from ‘Census 2001’, ‘AMPS 2001’,‘Consumer Research’ conducted in 2001, and
Customer Insights gained from, the current market is depicted as follows:
24%
42%
34% UNEMPLOYED
NOT ECONOMICALLY
ACTIVE
EMPLOYED
15,1 Mil 10,7 Mil
18,9 Mil
91%
8% 1%
R0 < R3 999
R4 000 < R29 999
R30 000 < Above
SOURCE – AMPS 2001
SOURCE – CENSUS 2001
92%
6% 2%
Lower R4k - R13,9k
Middle R14k - R19,9k
Upper R20k - R29,9K
SOURCE – CONSUMER
RESEARCH
92% OF MIDDLE MARKET CUSTOMERS FALL WITHIN
THE LOWER INCOME SEGMENT.
INCOME DRIVES USAGE, WHICH IN TURN DRIVES
REVENUE
( AFFORDABILITY TO TAKE ON ADDITIONAL PRODUCTS ? )
Reflecting on the above graphs, the important factors that stand out are:
• 34% of the total population is employed, and the current trend, compared to 1996 Census
information, is that the Unemployment Ratio is deteriorating.
• The majority ( 91% ) of the population, have an income below R4 000 per month.
• 8% Of the population receiving a higher than R4000 income, have 92% falling within the
Lower earning Sub segment.
Current Customer Growth trends are emphasising the need for focused Retention, Expansion and
Profitability strategies. Sufficient volumes of new customers, which will be required to dramatically
impact on Revenue growth are not, according to market statistics, unlimited. If viewed in
collaboration with the current market share dynamics and the cost on new customer acquisition,
then new customer acquisition strategies should take second priority to focused and meaningful
customer retention and cross sell activities, which support profitable growth.
To understand the potential revenue growth within a Financial Services existing customer base, it is
important to understand the various revenue streams. This includes:
• Nett Interest Income
• Non Interest Income
o Transaction & Service Fees
o Commissions
o Profit Share
The segment products can also be grouped to four broad categories:
• Transactional products
• Investment products
• Lending products
• Insurance products
Cross selling a second transactional account to a customer, could potentially result in the same
transaction volumes being distributed between two products, thereby potentially lowering the
overall profitability of the customer due to increased account maintenance costs.
Product usage is core to certain product’s profitability, and the importance of selling the right
product to the right customer, based on affordability, is imperative
A segment’s transactional book ( Savings and Cheque Accounts ), and the profitability thereof can be
viewed according to the following table:
R 0
-
R 4,000
R 4,001
-
R 8,000
R 8,001
-
R 12,000
R 12,001
-
R 16,000
R 16,001
-
R 20,000
R 20,000
+
0101
0202
0303
0404
04 +04 +
NumberofProducts
Monthly Turnover
TRANSACTIONAL SEGMENTATION
LIFE CYCLE
BUYING CYCLE
CULTURE
AFFORDABILITY
USAGE
TRANSACTIONAL
VOLUME
TICKET VALUE
The above table, represents segment Transactional Account customers. These customers have been
allocated into sectors based on credit turnover ( income eg, salaries ) and products held.
This Transactional account matrix, showed that customer profitability can be influenced by
increasing product take up, as well as increasing the usage of the existing product.
Further analysis, was undertaken in selected groups, including the Stand Alone product customers,
to understand the sub segment composition and product mix, as well as the next most likely product
take up based on propensity modelling.
The findings were as follows:
• In the single product category, profitability is directly related to transaction volume. The
greater the turnover, the higher the transaction volume.
• Next product take up within the 2nd
product in a retail segment customer base indicates the
following preferences:
o Cheque Accounts
Credit Card
Personal Loan
Savings Account
o Savings Accounts
Investments
Credit Cards
Personal Loans ( Including Short Loans )
A responsible ‘Cross Sell’ strategy for the Transactional Customer base, should include a blend of
Lending and Investment products, and self service related offerings
Further analysis of the stand alone customer base indicates the following:
• High number of scholars and unemployed customers.
From a cross selling perspective, these customers should not be included in the cross sell calculation,
as it would be not be a priority to increase their product holding due to affordability factors, which
could either result in account dormancies.
To summarise the above Stand Alone Customer base using Propensity Potential:
STAND ALONE POTENTIAL – PROPENSITY BASED
% Tar to Convers.
% Tar to Contacts
% Tar to Prospect
ANNUAL TARGT
TOTAL
CARD
VAF
HL
SAV
INV
P/L
CHQ
TOTALCARDAVAFAHLSAVINVP/LCHQPROSPECTS
SALES POTENTIAL WITHIN THE STAND ALONE SEGMENT CUSTOMER BASE, USING PROPENSITY MODELS
TO DETERMINE 1ST
PRODUCT TAKE UP.
THE ABOVE FIGURES EXCLUDE PRODUCTS THAT WOULD BE CROSS SOLD AGAINST THE PRIMARY
PRODUCT SALE ( 2:1 = …………x 2 = …………. +………… = ………….. potential product sales – Cross Sell Ratio for
the Stand Alone ……….. base will move from 1 to 1,…. )
The ‘Stand Alone’ analysis can also be applied to 2 product customers, in order to correctly target
and cross sell a 3rd
product. This ‘cross sell’ technique can be systemised into the data warehouse, to
provide a continuous flow of cross sell leads to be actioned by the various SBUs and Distribution
Channels.
Further analysis to be completed on the segment customer base. This analysis, is aimed at
identifying:
• The current composition of segments in terms of Sub Segments, Profitability, Usage,
Product Mix & Channel Mix.
• The potential of future Cross Selling & Usage initiatives aimed at the existing segment
customer base.
• The impact of customer & account attrition on profitability and to highlight some of the
underlying reasons.
The analytic process, which is based on the following method:
Product Potential
This is determined by grouping the segment Customer base into 3 specific customer groupings:
• Transactional, Lending & Investing
Each group is further sub divided into sectors according to Product numbers and Turnover, Average
Balance or Initial Loan Balance. Each sector will be further sub divided into the Sub Segments, which
is based on age ( Life stage ), and will indicate the number of customers in the Sub Segment, as well
as their average profitability.
Each Sub Segment will be further divided into the Product Mix, which will also reflect numbers and
percentage.
In order to determine Usage potential, the ultimate ( profitable ) channel mix & usage volume, will
be determined per sub segment. All customers will be matched against their ultimate channel &
usage profile, and areas of potential will be highlighted for customer education on product features
or channel cross sell activities
TRANSACTIONAL LENDING INVESTING
TURNOVER INITIAL LOAN VALUE AVERAGE BALANCE
#
P
R
O
D
U
C
T
S
#
P
R
O
D
U
C
T
S
#
P
R
O
D
U
C
T
S
YOUTH
0–18YEARS
NUMBER=#
AVEPROFIT=(6)
STUDENT
CIFINDICATOR
NUMBER=#
AVEPROFIT=(10)
YOUNGADULT
19–35YEARS
NUMBER=#
AVEPROFIT=9
ESTABLISHED
MIDDLE
36–54YEARS
NUMBER=#
AVEPROFIT=15
SENIORS
55+YEARS
NUMBER=#
AVEPROFIT=7
OTHER
NUMBER=#
AVEPROFIT=5
SAVINGS
200
26%
CHEQUES
100
13%
CREDIT CARDS
50
7%
INVESTMENTS
150
20%
PERS LOANS
150
20%
HOME LOANS
70
9%
AVAF
20
3%
MONEY MARKET
15
2%
SUB SEGMENTS PRODUCT TYPE
AVERAGEPROFITABILITY
NUMBEROFPRODUCTS
This approach will be supportive of the company’s view on Customer Centricity, as Cross Selling
offers, will be aimed at customers, who are in the right life stage cycle and will benefit from the
offering, as well as being in a position to afford the product as to ensure responsible selling practices
are maintained.
Usage Potential
The same analytic approach will be used to determine Usage Potential, the only difference, is that
instead of product mix, the channels used, as well as average transaction volume will be reflected.
TRANSACTIONAL LENDING INVESTING
TURNOVER INITIAL LOAN VALUE AVERAGE BALANCE
#
P
R
O
D
U
C
T
S
#
P
R
O
D
U
C
T
S
#
P
R
O
D
U
C
T
S
TELLER
200
26%
ENQUIRIES
100
13%
ATM
50
7%
POS
150
20%
SYSTEM
150
20%
INTERNET
70
9%
TELE BANKING
20
3%
CELL BANKING
15
2%
SUB SEGMENTS TRANSACTION TYPE
AVERAGEPROFITABILITY
NUMBEROF
TRANSACTIONS
YOUTH
0–18YEARS
NUMBER=#
AVEPROFIT=(6)
STUDENT
CIFINDICATOR
NUMBER=#
AVEPROFIT=(10)
YOUNGADULT
19–35YEARS
NUMBER=#
AVEPROFIT=9
ESTABLISHED
MIDDLE
36–54YEARS
NUMBER=#
AVEPROFIT=15
SENIORS
55+YEARS
NUMBER=#
AVEPROFIT=7
OTHER
NUMBER=#
AVEPROFIT=5
Customer Attrition
All previous customer/account losses should be analysed to determine the following trends:
• Geographical ( Spatial analysis )
• Product Trends ( Investments, Personal Loans, Cheques etc )
• Sub Segment ( Demographic analysis )
• Application Process Issues ( T/A Times & scoring quality etc )
• Account Activation Issues ( New accounts opened / closed no activation )
• Reasons for closure ( Service, Bad debt, Dormancy etc )
The critical factors which will enable this process include:
• Quality of Customer Information data.
• Quality of the Data Mining Models.
• An integrated customer contact management strategy.
• Speed of data extraction to sales action.
• ‘End to End’ virtual fulfilment of applications.
In summarizing the importance of Cross Selling, we can categorise them into two key areas:
‘Lock In’ ( Customer Retention )
• Total needs solutioning
• Predicting customer needs
• Complexity of Channel Usage
Profitability ( Customer Expansion )
• Lifetime value
• Pricing
• Product mix
• Usage
Obstacles&Enablers
Obstacles Clarification
• Uncoordinated and un-integrated
marketing, selling and contact strategy
towards the segment customer base.
• Silo Based Organisational Customer Strategies
• The quality of our customer information on
CIF.
• The purer the Customer Information, the
greater will be the SBUs ability to contact
customers, and predict customer’s propensity
to take additional products.
• The lack of an ‘End to End’ virtual fulfilment
process for customer applications.
• Research has shown that 62% of customers
visit their branch less than once per month.
Without end to end fulfilment in Contact
Centres, we will still be reliant on customers
going in to branches to finalise applications.
• Segmentation could be too complex and
static. This inhibits the ability to rapidly
respond to changes within the market.
• Segmentation should be basic and cater for
income & life stage splits.
• The lack of an integrated, co-ordinated
approach to cross selling through the
Distribution Channels.
• Various segment strategies when executed,
could be directed to the same customer,
without prioritising or phasing being applied.
• Customer scoring models are product
orientated, and may not support multiple
product scoring.
• A customer approved for a Home Loan, may
not necessarily qualify for a Cheque Account.
The introduction of a total customer view &
multiple product scoring will benefit cross
selling.
• Data Mining Models • Propensity Models
• Event Based Triggers
• Next Best Product
• Proactive selling techniques developed
within the Contact Centre
• Focused Selling, Up Selling, Down Selling, Add
On Selling, By the Way Selling, Cross Selling,
Puppy Dog Selling and Match Selling
techniques will up your conversion ratios if
aligned to the right campaign.
• Potential capacity within t Contact Centres • Optimisation of capacity & the potential for
‘End to End’ processing
• Substantial existing Customer Base to
support data mining and analytics
• Data volumes are required to ensure key
commercial drivers linked to Cost of Sale, and
Operational Efficiencies.
• Highly skilled and tenured sales staff –
skilled in multi product lines and services
• They need to be able to respond to client
needs, questions and responses outside of any
call script, but within the compliance and
governance framework.

More Related Content

What's hot

Consumer Segmentation - Introduction to Branding
Consumer Segmentation - Introduction to BrandingConsumer Segmentation - Introduction to Branding
Consumer Segmentation - Introduction to BrandingRai University Ahmedabad
 
Effective customer segmentation
Effective customer segmentationEffective customer segmentation
Effective customer segmentationSherpas
 
TalkTalk - Data - Carlos Soares
TalkTalk - Data - Carlos SoaresTalkTalk - Data - Carlos Soares
TalkTalk - Data - Carlos SoaresDigital Leaders
 
Strategic marketing workshop presentation
Strategic marketing workshop presentationStrategic marketing workshop presentation
Strategic marketing workshop presentationhttp://www.drawpack.com
 
Customer Segmentation for Retention Strategy
Customer Segmentation for Retention StrategyCustomer Segmentation for Retention Strategy
Customer Segmentation for Retention StrategyMelody Ucros
 
Customer segmentation
Customer segmentationCustomer segmentation
Customer segmentationweave Belgium
 
Chapter 1 marketing managment
Chapter 1 marketing managmentChapter 1 marketing managment
Chapter 1 marketing managmentZohaib Ahmed
 
Home page slide share
Home page  slide shareHome page  slide share
Home page slide shareGurmit Combo
 
2014 Customer Loyalty ASEAN Conference: Prof de los Reyes
2014 Customer Loyalty ASEAN Conference: Prof de los Reyes2014 Customer Loyalty ASEAN Conference: Prof de los Reyes
2014 Customer Loyalty ASEAN Conference: Prof de los ReyesJim D Griffin
 
Summary of and Commentary on the 2021 DemandGen B2B Buyers Survey Report
Summary of and Commentary on the 2021 DemandGen B2B Buyers Survey Report Summary of and Commentary on the 2021 DemandGen B2B Buyers Survey Report
Summary of and Commentary on the 2021 DemandGen B2B Buyers Survey Report Tim Steele
 
Connecting B2C to B2B: a Top Down Approach for Industrial Distributors
Connecting B2C to B2B: a Top Down Approach for Industrial DistributorsConnecting B2C to B2B: a Top Down Approach for Industrial Distributors
Connecting B2C to B2B: a Top Down Approach for Industrial DistributorsStephane Bratu
 
Cenco marketing the future of marketing_ mohan
Cenco  marketing  the future of marketing_ mohanCenco  marketing  the future of marketing_ mohan
Cenco marketing the future of marketing_ mohanluis rebolledo
 
Consumer+behaviour+consumer+analysis+ch2
Consumer+behaviour+consumer+analysis+ch2Consumer+behaviour+consumer+analysis+ch2
Consumer+behaviour+consumer+analysis+ch2shrutika1991
 
Customer segmentation approach
Customer segmentation approachCustomer segmentation approach
Customer segmentation approachSumit K Jha
 

What's hot (20)

Segmentation Best Practices
Segmentation Best PracticesSegmentation Best Practices
Segmentation Best Practices
 
Customer segmentation
Customer segmentationCustomer segmentation
Customer segmentation
 
Consumer Segmentation - Introduction to Branding
Consumer Segmentation - Introduction to BrandingConsumer Segmentation - Introduction to Branding
Consumer Segmentation - Introduction to Branding
 
Effective customer segmentation
Effective customer segmentationEffective customer segmentation
Effective customer segmentation
 
TalkTalk - Data - Carlos Soares
TalkTalk - Data - Carlos SoaresTalkTalk - Data - Carlos Soares
TalkTalk - Data - Carlos Soares
 
Customer Segmentation
Customer SegmentationCustomer Segmentation
Customer Segmentation
 
Strategic marketing workshop presentation
Strategic marketing workshop presentationStrategic marketing workshop presentation
Strategic marketing workshop presentation
 
Customer Segmentation for Retention Strategy
Customer Segmentation for Retention StrategyCustomer Segmentation for Retention Strategy
Customer Segmentation for Retention Strategy
 
Account
AccountAccount
Account
 
Customer segmentation
Customer segmentationCustomer segmentation
Customer segmentation
 
MM 2011.03
MM 2011.03MM 2011.03
MM 2011.03
 
Chapter 1 marketing managment
Chapter 1 marketing managmentChapter 1 marketing managment
Chapter 1 marketing managment
 
Home page slide share
Home page  slide shareHome page  slide share
Home page slide share
 
2014 Customer Loyalty ASEAN Conference: Prof de los Reyes
2014 Customer Loyalty ASEAN Conference: Prof de los Reyes2014 Customer Loyalty ASEAN Conference: Prof de los Reyes
2014 Customer Loyalty ASEAN Conference: Prof de los Reyes
 
Summary of and Commentary on the 2021 DemandGen B2B Buyers Survey Report
Summary of and Commentary on the 2021 DemandGen B2B Buyers Survey Report Summary of and Commentary on the 2021 DemandGen B2B Buyers Survey Report
Summary of and Commentary on the 2021 DemandGen B2B Buyers Survey Report
 
Connecting B2C to B2B: a Top Down Approach for Industrial Distributors
Connecting B2C to B2B: a Top Down Approach for Industrial DistributorsConnecting B2C to B2B: a Top Down Approach for Industrial Distributors
Connecting B2C to B2B: a Top Down Approach for Industrial Distributors
 
Cenco marketing the future of marketing_ mohan
Cenco  marketing  the future of marketing_ mohanCenco  marketing  the future of marketing_ mohan
Cenco marketing the future of marketing_ mohan
 
Consumer+behaviour+consumer+analysis+ch2
Consumer+behaviour+consumer+analysis+ch2Consumer+behaviour+consumer+analysis+ch2
Consumer+behaviour+consumer+analysis+ch2
 
Mbm6 ch 3 slides
Mbm6 ch 3 slidesMbm6 ch 3 slides
Mbm6 ch 3 slides
 
Customer segmentation approach
Customer segmentation approachCustomer segmentation approach
Customer segmentation approach
 

Viewers also liked

Ideative studio006 no doncio_ita
Ideative studio006 no doncio_itaIdeative studio006 no doncio_ita
Ideative studio006 no doncio_itaSamira De Santis
 
StateofthesidewalksFINAL
StateofthesidewalksFINALStateofthesidewalksFINAL
StateofthesidewalksFINALJeremy Comer
 
星なかまの集い〜天文楽サミット〜2016「蝶番式赤道台の紹介」
星なかまの集い〜天文楽サミット〜2016「蝶番式赤道台の紹介」星なかまの集い〜天文楽サミット〜2016「蝶番式赤道台の紹介」
星なかまの集い〜天文楽サミット〜2016「蝶番式赤道台の紹介」Keiichi Sakai
 
Ayisha Bano CV (2)
Ayisha Bano CV (2)Ayisha Bano CV (2)
Ayisha Bano CV (2)Ayisha Bano
 
مزرعة بدبي تبتكر آلية تبريد حفاظاً على صحة المواشي
مزرعة بدبي تبتكر آلية تبريد حفاظاً على صحة المواشيمزرعة بدبي تبتكر آلية تبريد حفاظاً على صحة المواشي
مزرعة بدبي تبتكر آلية تبريد حفاظاً على صحة المواشيDr.Rami Hamad
 
Complete streetsintro ar.leela immadisetty_alumni(auce architecture)
Complete streetsintro ar.leela immadisetty_alumni(auce architecture)Complete streetsintro ar.leela immadisetty_alumni(auce architecture)
Complete streetsintro ar.leela immadisetty_alumni(auce architecture)A.U Architecture Alumni Association
 
Van droom tot werkelijkheid
Van droom tot werkelijkheidVan droom tot werkelijkheid
Van droom tot werkelijkheidArnaud Veere
 
Tisk může být hračkou. Jak na úsporný tisk ve školách.
Tisk může být hračkou. Jak na úsporný tisk ve školách.Tisk může být hračkou. Jak na úsporný tisk ve školách.
Tisk může být hračkou. Jak na úsporný tisk ve školách.NET University, s.r.o.
 
Curriculum Vitae Madelaine
Curriculum Vitae MadelaineCurriculum Vitae Madelaine
Curriculum Vitae MadelaineMADELAINE LAROYA
 

Viewers also liked (20)

Ideative studio006 no doncio_ita
Ideative studio006 no doncio_itaIdeative studio006 no doncio_ita
Ideative studio006 no doncio_ita
 
Madagascar church history
Madagascar church historyMadagascar church history
Madagascar church history
 
StateofthesidewalksFINAL
StateofthesidewalksFINALStateofthesidewalksFINAL
StateofthesidewalksFINAL
 
mp singh 15 12 2014
mp singh 15 12 2014mp singh 15 12 2014
mp singh 15 12 2014
 
Socialperception 130806180943-phpapp02
Socialperception 130806180943-phpapp02Socialperception 130806180943-phpapp02
Socialperception 130806180943-phpapp02
 
Jakub śmietana
Jakub śmietanaJakub śmietana
Jakub śmietana
 
Don’t forget the alterations
Don’t forget the alterationsDon’t forget the alterations
Don’t forget the alterations
 
星なかまの集い〜天文楽サミット〜2016「蝶番式赤道台の紹介」
星なかまの集い〜天文楽サミット〜2016「蝶番式赤道台の紹介」星なかまの集い〜天文楽サミット〜2016「蝶番式赤道台の紹介」
星なかまの集い〜天文楽サミット〜2016「蝶番式赤道台の紹介」
 
sudeep
sudeepsudeep
sudeep
 
Ayisha Bano CV (2)
Ayisha Bano CV (2)Ayisha Bano CV (2)
Ayisha Bano CV (2)
 
مزرعة بدبي تبتكر آلية تبريد حفاظاً على صحة المواشي
مزرعة بدبي تبتكر آلية تبريد حفاظاً على صحة المواشيمزرعة بدبي تبتكر آلية تبريد حفاظاً على صحة المواشي
مزرعة بدبي تبتكر آلية تبريد حفاظاً على صحة المواشي
 
Complete streetsintro ar.leela immadisetty_alumni(auce architecture)
Complete streetsintro ar.leela immadisetty_alumni(auce architecture)Complete streetsintro ar.leela immadisetty_alumni(auce architecture)
Complete streetsintro ar.leela immadisetty_alumni(auce architecture)
 
Van droom tot werkelijkheid
Van droom tot werkelijkheidVan droom tot werkelijkheid
Van droom tot werkelijkheid
 
Tisk může být hračkou. Jak na úsporný tisk ve školách.
Tisk může být hračkou. Jak na úsporný tisk ve školách.Tisk může být hračkou. Jak na úsporný tisk ve školách.
Tisk může být hračkou. Jak na úsporný tisk ve školách.
 
வெற்றி
வெற்றிவெற்றி
வெற்றி
 
WORLD PEACE
WORLD PEACEWORLD PEACE
WORLD PEACE
 
Evaluation 3
Evaluation 3Evaluation 3
Evaluation 3
 
Intania
IntaniaIntania
Intania
 
Curriculum Vitae Madelaine
Curriculum Vitae MadelaineCurriculum Vitae Madelaine
Curriculum Vitae Madelaine
 
IVT Företagspresentation
IVT FöretagspresentationIVT Företagspresentation
IVT Företagspresentation
 

Similar to Customer Centric Cross Selling Strategies

CRM Analytics_Marketelligent
CRM Analytics_MarketelligentCRM Analytics_Marketelligent
CRM Analytics_MarketelligentMarketelligent
 
Retail Banking Analytics_Marketelligent
Retail Banking Analytics_MarketelligentRetail Banking Analytics_Marketelligent
Retail Banking Analytics_MarketelligentMarketelligent
 
SaaStr 2021 - Session summaries
SaaStr 2021 - Session summariesSaaStr 2021 - Session summaries
SaaStr 2021 - Session summariesIngvildFarstad
 
Customer Value in Retail
Customer Value in RetailCustomer Value in Retail
Customer Value in Retailrajnish kumar
 
Learn about consumer intelligence to enhance consumer experience
Learn about consumer intelligence to enhance consumer experience Learn about consumer intelligence to enhance consumer experience
Learn about consumer intelligence to enhance consumer experience Jaiveer Singh
 
Customer profitability analysis crm ppt
Customer profitability analysis crm pptCustomer profitability analysis crm ppt
Customer profitability analysis crm pptJaswinder Singh
 
Accenture maximizing-customer-retention
Accenture maximizing-customer-retentionAccenture maximizing-customer-retention
Accenture maximizing-customer-retentionAmer Sayed
 
Marketing Optimization in Financial Services
Marketing Optimization in Financial ServicesMarketing Optimization in Financial Services
Marketing Optimization in Financial ServicesSebastian Shapiro
 
2016 customer advocacy survey report
2016 customer advocacy survey report2016 customer advocacy survey report
2016 customer advocacy survey reportBill Lee
 
Marketing associate
Marketing associate Marketing associate
Marketing associate nayrakhan1
 
AI for customer success - An Overview.pdf
AI for customer success - An Overview.pdfAI for customer success - An Overview.pdf
AI for customer success - An Overview.pdfStephenAmell4
 
5 Things A Company Must Do Now in a Slowing Economy
5 Things A Company Must Do Now in a Slowing Economy5 Things A Company Must Do Now in a Slowing Economy
5 Things A Company Must Do Now in a Slowing EconomyRon Chandler
 
5 Things A Company Must Do Summary Version
5 Things A Company Must Do Summary Version5 Things A Company Must Do Summary Version
5 Things A Company Must Do Summary Versionjshumway2009
 

Similar to Customer Centric Cross Selling Strategies (20)

CRM Analytics_Marketelligent
CRM Analytics_MarketelligentCRM Analytics_Marketelligent
CRM Analytics_Marketelligent
 
Retail Banking Analytics_Marketelligent
Retail Banking Analytics_MarketelligentRetail Banking Analytics_Marketelligent
Retail Banking Analytics_Marketelligent
 
SaaStr 2021 - Session summaries
SaaStr 2021 - Session summariesSaaStr 2021 - Session summaries
SaaStr 2021 - Session summaries
 
Revenue Growth-High Final
Revenue Growth-High FinalRevenue Growth-High Final
Revenue Growth-High Final
 
Customer Value in Retail
Customer Value in RetailCustomer Value in Retail
Customer Value in Retail
 
Learn about consumer intelligence to enhance consumer experience
Learn about consumer intelligence to enhance consumer experience Learn about consumer intelligence to enhance consumer experience
Learn about consumer intelligence to enhance consumer experience
 
Customer profitability analysis crm ppt
Customer profitability analysis crm pptCustomer profitability analysis crm ppt
Customer profitability analysis crm ppt
 
Accenture maximizing-customer-retention
Accenture maximizing-customer-retentionAccenture maximizing-customer-retention
Accenture maximizing-customer-retention
 
Mktg of FS 32 pgs.pdf
Mktg of FS 32 pgs.pdfMktg of FS 32 pgs.pdf
Mktg of FS 32 pgs.pdf
 
Marketing Optimization in Financial Services
Marketing Optimization in Financial ServicesMarketing Optimization in Financial Services
Marketing Optimization in Financial Services
 
Customer Equity
Customer EquityCustomer Equity
Customer Equity
 
2016 customer advocacy survey report
2016 customer advocacy survey report2016 customer advocacy survey report
2016 customer advocacy survey report
 
chapter 14 bp1.pptx
chapter 14 bp1.pptxchapter 14 bp1.pptx
chapter 14 bp1.pptx
 
B2 b crm
B2 b crmB2 b crm
B2 b crm
 
Marketing associate
Marketing associate Marketing associate
Marketing associate
 
AI for customer success - An Overview.pdf
AI for customer success - An Overview.pdfAI for customer success - An Overview.pdf
AI for customer success - An Overview.pdf
 
5 Things A Company Must Do Now in a Slowing Economy
5 Things A Company Must Do Now in a Slowing Economy5 Things A Company Must Do Now in a Slowing Economy
5 Things A Company Must Do Now in a Slowing Economy
 
5 Things A Company Must Do Summary Version
5 Things A Company Must Do Summary Version5 Things A Company Must Do Summary Version
5 Things A Company Must Do Summary Version
 
Strategic KAM
Strategic KAMStrategic KAM
Strategic KAM
 
document
documentdocument
document
 

Customer Centric Cross Selling Strategies

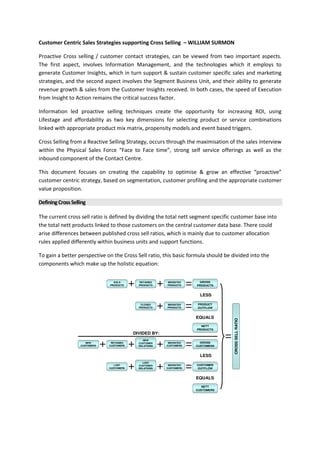
  • 1. Customer Centric Sales Strategies supporting Cross Selling – WILLIAM SURMON Proactive Cross selling / customer contact strategies, can be viewed from two important aspects. The first aspect, involves Information Management, and the technologies which it employs to generate Customer Insights, which in turn support & sustain customer specific sales and marketing strategies, and the second aspect involves the Segment Business Unit, and their ability to generate revenue growth & sales from the Customer Insights received. In both cases, the speed of Execution from Insight to Action remains the critical success factor. Information led proactive selling techniques create the opportunity for increasing ROI, using Lifestage and affordability as two key dimensions for selecting product or service combinations linked with appropriate product mix matrix, propensity models and event based triggers. Cross Selling from a Reactive Selling Strategy, occurs through the maximisation of the sales interview within the Physical Sales Force “Face to Face time”, strong self service offerings as well as the inbound component of the Contact Centre. This document focuses on creating the capability to optimise & grow an effective “proactive” customer centric strategy, based on segmentation, customer profiling and the appropriate customer value proposition. DefiningCrossSelling The current cross sell ratio is defined by dividing the total nett segment specific customer base into the total nett products linked to those customers on the central customer data base. There could arise differences between published cross sell ratios, which is mainly due to customer allocation rules applied differently within business units and support functions. To gain a better perspective on the Cross Sell ratio, this basic formula should be divided into the components which make up the holistic equation: SOLD PRODUCTS RETAINED PRODUCTS MIGRATED PRODUCTS GROSS PRODUCTS LESS CLOSED PRODUCTS MIGRATED PRODUCTS PRODUCT OUTFLOW EQUALS NETT PRODUCTS NEW CUSTOMERS RETAINED CUSTOMERS NEW CUSTOMER RELATIONS MIGRATED CUSTOMERS GROSS CUSTOMERS LESS LOST CUSTOMERS LOST CUSTOMER RELATIONS MIGRATED CUSTOMERS CUSTOMER OUTFLOW EQUALS NETT CUSTOMERS DIVIDED BY: CROSSSELLRATIO
  • 2. The application of this ratio is flawed due to the following: • Customer allocation rules ( Segment vs Product business units ) • It is not Strategy Sensitive: • Profitability vs Market Share Growth • Customer Growth, Retention strategies • Operating model customer allocation rules • Seasonal & Economic Cycles. • It is not Sub Segment focused PROITABILITY FINANCIAL PERSPECTIVE CUSTOMER PERSPECTIVE INTERNAL PERSPECTIVE RESOURCE PERSPECTIVE MARKET SHARE FINANCIAL PERSPECTIVE CUSTOMER PERSPECTIVE INTERNAL PERSPECTIVE RESOURCE PERSPECTIVE C U R R E N T V I E W D E S I R E D S T A T E Reflecting on the ratio calculation, it becomes evident that the Cross Sell Ratio, could be impacted by a host of factors, not only through expanding a customer’s existing account portfolio with additional product sales or service offerings. It also implies that in order to positively impact the Cross sell ratio, there is a need to: • Cross sell & product bundle at the source of customer acquisition. • Retain existing customers, especially those who have multiple product / service portfolios. • Take note of customers that are migrated to other Segment or Product SBUs in line with their current Operating Model and Segmentation / Migration rules. It is important to understand that the Cross Sell ratio will drop, with every new customer that is acquired, who does not have a Cross Sell ratio larger than 1:1. i.e. The ratio drops with every new stand alone customer acquired. In addition, this is also impacted by the affordability of the lower end of the segmented customer base. To summarise, the basic customer strategies impacting the Cross Sell ratio are: (UCARE) • Acquisition - New customer acquisition
  • 3. • Retention - Existing customer retention • Cost / Profitability Management - Customer migration / allocation within segments related to CVPs • Expansion - Customer relationship expansion • Utilisation - Account Utilisation This understanding of the various Cross Sell factors, supports the view that all Product and Segment SBUs are either directly or indirectly responsible for the resultant Cross Sell Ratio. This responsibility is linked to their value proposition, product offering and the manner in which customers are acquired and retained. Furthermore, it is pertinent to understand the impact of the following additional factors, on the ability to ‘Cross Sell’ and the effectiveness of it: • Affordability ( Customers ability to pay for additional products) • Life Stage ( A customers need for a product ) • Customer Profitability ( Usage of the product - Fair Value ) • Product Offering ( Most appropriate product ) • Legislation ( FAIS, NCA etc ) • Dormancies / Closures ( Usage vs start up & admin costs ) • Enablement within the Value Chain - Fulfilment process and the impact thereof on the success of the ‘Sale’ ( End to End virtual fulfilment ) and policy / governance / compliance interpretations and applications. Cross Selling can therefore be defined as: • ‘A proactive, customer centric, additional offering / solution to an existing or new customer, which results in a mutually beneficial commercial relationship’. The Cross Selling ratio should be defined as: • ‘A strategically sensitive ratio, applied to a specific sub segment, with the intention of positively influencing the overall profitability or market share of the identified sub segment’, while enhancing the customers financial situation and service experience. Accordingly, any customer focused activity initiated by a segment SBU towards the specific customer segment, has operational and commercial consequences for the remainder of the product SBUs within the corporate entity, and the Cross Sell ratio for the customer segment involved. It is therefore crucial, for a collaborative, segment customer Value Proposition and contact strategy to be established throughout the corporate entity. In addition, the segment will need to identify at least 4 or more separate cross sell ratios, against which it can measure related performance and get consensus for these with all stakeholders.
  • 4. Importance of Cross Selling Cross selling alone will not achieve substantial revenue growth if viewed in isolation. Revenue growth is achieved through a blend of Acquisition, Retention, Expansion, Cost Management / profitability, and Utilisation strategies. However, ‘Cross Selling’ to the existing customer base, will, if conducted responsibly, result in a substantial contribution to the overall segment revenue growth. So what is a responsible approach to ‘Cross Selling’, and what potential value can it contribute? In order to define a responsible approach, it is important to understand the existing Customer Market, both from an internal as well as an external perspective. Using statistics from ‘Census 2001’, ‘AMPS 2001’,‘Consumer Research’ conducted in 2001, and Customer Insights gained from, the current market is depicted as follows: 24% 42% 34% UNEMPLOYED NOT ECONOMICALLY ACTIVE EMPLOYED 15,1 Mil 10,7 Mil 18,9 Mil 91% 8% 1% R0 < R3 999 R4 000 < R29 999 R30 000 < Above SOURCE – AMPS 2001 SOURCE – CENSUS 2001 92% 6% 2% Lower R4k - R13,9k Middle R14k - R19,9k Upper R20k - R29,9K SOURCE – CONSUMER RESEARCH 92% OF MIDDLE MARKET CUSTOMERS FALL WITHIN THE LOWER INCOME SEGMENT. INCOME DRIVES USAGE, WHICH IN TURN DRIVES REVENUE ( AFFORDABILITY TO TAKE ON ADDITIONAL PRODUCTS ? ) Reflecting on the above graphs, the important factors that stand out are: • 34% of the total population is employed, and the current trend, compared to 1996 Census information, is that the Unemployment Ratio is deteriorating. • The majority ( 91% ) of the population, have an income below R4 000 per month. • 8% Of the population receiving a higher than R4000 income, have 92% falling within the Lower earning Sub segment.
  • 5. Current Customer Growth trends are emphasising the need for focused Retention, Expansion and Profitability strategies. Sufficient volumes of new customers, which will be required to dramatically impact on Revenue growth are not, according to market statistics, unlimited. If viewed in collaboration with the current market share dynamics and the cost on new customer acquisition, then new customer acquisition strategies should take second priority to focused and meaningful customer retention and cross sell activities, which support profitable growth. To understand the potential revenue growth within a Financial Services existing customer base, it is important to understand the various revenue streams. This includes: • Nett Interest Income • Non Interest Income o Transaction & Service Fees o Commissions o Profit Share The segment products can also be grouped to four broad categories: • Transactional products • Investment products • Lending products • Insurance products Cross selling a second transactional account to a customer, could potentially result in the same transaction volumes being distributed between two products, thereby potentially lowering the overall profitability of the customer due to increased account maintenance costs. Product usage is core to certain product’s profitability, and the importance of selling the right product to the right customer, based on affordability, is imperative A segment’s transactional book ( Savings and Cheque Accounts ), and the profitability thereof can be viewed according to the following table: R 0 - R 4,000 R 4,001 - R 8,000 R 8,001 - R 12,000 R 12,001 - R 16,000 R 16,001 - R 20,000 R 20,000 + 0101 0202 0303 0404 04 +04 + NumberofProducts Monthly Turnover TRANSACTIONAL SEGMENTATION LIFE CYCLE BUYING CYCLE CULTURE AFFORDABILITY USAGE TRANSACTIONAL VOLUME TICKET VALUE
  • 6. The above table, represents segment Transactional Account customers. These customers have been allocated into sectors based on credit turnover ( income eg, salaries ) and products held. This Transactional account matrix, showed that customer profitability can be influenced by increasing product take up, as well as increasing the usage of the existing product. Further analysis, was undertaken in selected groups, including the Stand Alone product customers, to understand the sub segment composition and product mix, as well as the next most likely product take up based on propensity modelling. The findings were as follows: • In the single product category, profitability is directly related to transaction volume. The greater the turnover, the higher the transaction volume. • Next product take up within the 2nd product in a retail segment customer base indicates the following preferences: o Cheque Accounts Credit Card Personal Loan Savings Account o Savings Accounts Investments Credit Cards Personal Loans ( Including Short Loans ) A responsible ‘Cross Sell’ strategy for the Transactional Customer base, should include a blend of Lending and Investment products, and self service related offerings Further analysis of the stand alone customer base indicates the following: • High number of scholars and unemployed customers. From a cross selling perspective, these customers should not be included in the cross sell calculation, as it would be not be a priority to increase their product holding due to affordability factors, which could either result in account dormancies.
  • 7. To summarise the above Stand Alone Customer base using Propensity Potential: STAND ALONE POTENTIAL – PROPENSITY BASED % Tar to Convers. % Tar to Contacts % Tar to Prospect ANNUAL TARGT TOTAL CARD VAF HL SAV INV P/L CHQ TOTALCARDAVAFAHLSAVINVP/LCHQPROSPECTS SALES POTENTIAL WITHIN THE STAND ALONE SEGMENT CUSTOMER BASE, USING PROPENSITY MODELS TO DETERMINE 1ST PRODUCT TAKE UP. THE ABOVE FIGURES EXCLUDE PRODUCTS THAT WOULD BE CROSS SOLD AGAINST THE PRIMARY PRODUCT SALE ( 2:1 = …………x 2 = …………. +………… = ………….. potential product sales – Cross Sell Ratio for the Stand Alone ……….. base will move from 1 to 1,…. ) The ‘Stand Alone’ analysis can also be applied to 2 product customers, in order to correctly target and cross sell a 3rd product. This ‘cross sell’ technique can be systemised into the data warehouse, to provide a continuous flow of cross sell leads to be actioned by the various SBUs and Distribution Channels. Further analysis to be completed on the segment customer base. This analysis, is aimed at identifying: • The current composition of segments in terms of Sub Segments, Profitability, Usage, Product Mix & Channel Mix. • The potential of future Cross Selling & Usage initiatives aimed at the existing segment customer base. • The impact of customer & account attrition on profitability and to highlight some of the underlying reasons. The analytic process, which is based on the following method: Product Potential This is determined by grouping the segment Customer base into 3 specific customer groupings: • Transactional, Lending & Investing Each group is further sub divided into sectors according to Product numbers and Turnover, Average Balance or Initial Loan Balance. Each sector will be further sub divided into the Sub Segments, which is based on age ( Life stage ), and will indicate the number of customers in the Sub Segment, as well as their average profitability. Each Sub Segment will be further divided into the Product Mix, which will also reflect numbers and percentage.
  • 8. In order to determine Usage potential, the ultimate ( profitable ) channel mix & usage volume, will be determined per sub segment. All customers will be matched against their ultimate channel & usage profile, and areas of potential will be highlighted for customer education on product features or channel cross sell activities TRANSACTIONAL LENDING INVESTING TURNOVER INITIAL LOAN VALUE AVERAGE BALANCE # P R O D U C T S # P R O D U C T S # P R O D U C T S YOUTH 0–18YEARS NUMBER=# AVEPROFIT=(6) STUDENT CIFINDICATOR NUMBER=# AVEPROFIT=(10) YOUNGADULT 19–35YEARS NUMBER=# AVEPROFIT=9 ESTABLISHED MIDDLE 36–54YEARS NUMBER=# AVEPROFIT=15 SENIORS 55+YEARS NUMBER=# AVEPROFIT=7 OTHER NUMBER=# AVEPROFIT=5 SAVINGS 200 26% CHEQUES 100 13% CREDIT CARDS 50 7% INVESTMENTS 150 20% PERS LOANS 150 20% HOME LOANS 70 9% AVAF 20 3% MONEY MARKET 15 2% SUB SEGMENTS PRODUCT TYPE AVERAGEPROFITABILITY NUMBEROFPRODUCTS This approach will be supportive of the company’s view on Customer Centricity, as Cross Selling offers, will be aimed at customers, who are in the right life stage cycle and will benefit from the offering, as well as being in a position to afford the product as to ensure responsible selling practices are maintained. Usage Potential The same analytic approach will be used to determine Usage Potential, the only difference, is that instead of product mix, the channels used, as well as average transaction volume will be reflected. TRANSACTIONAL LENDING INVESTING TURNOVER INITIAL LOAN VALUE AVERAGE BALANCE # P R O D U C T S # P R O D U C T S # P R O D U C T S TELLER 200 26% ENQUIRIES 100 13% ATM 50 7% POS 150 20% SYSTEM 150 20% INTERNET 70 9% TELE BANKING 20 3% CELL BANKING 15 2% SUB SEGMENTS TRANSACTION TYPE AVERAGEPROFITABILITY NUMBEROF TRANSACTIONS YOUTH 0–18YEARS NUMBER=# AVEPROFIT=(6) STUDENT CIFINDICATOR NUMBER=# AVEPROFIT=(10) YOUNGADULT 19–35YEARS NUMBER=# AVEPROFIT=9 ESTABLISHED MIDDLE 36–54YEARS NUMBER=# AVEPROFIT=15 SENIORS 55+YEARS NUMBER=# AVEPROFIT=7 OTHER NUMBER=# AVEPROFIT=5
  • 9. Customer Attrition All previous customer/account losses should be analysed to determine the following trends: • Geographical ( Spatial analysis ) • Product Trends ( Investments, Personal Loans, Cheques etc ) • Sub Segment ( Demographic analysis ) • Application Process Issues ( T/A Times & scoring quality etc ) • Account Activation Issues ( New accounts opened / closed no activation ) • Reasons for closure ( Service, Bad debt, Dormancy etc ) The critical factors which will enable this process include: • Quality of Customer Information data. • Quality of the Data Mining Models. • An integrated customer contact management strategy. • Speed of data extraction to sales action. • ‘End to End’ virtual fulfilment of applications. In summarizing the importance of Cross Selling, we can categorise them into two key areas: ‘Lock In’ ( Customer Retention ) • Total needs solutioning • Predicting customer needs • Complexity of Channel Usage Profitability ( Customer Expansion ) • Lifetime value • Pricing • Product mix • Usage Obstacles&Enablers Obstacles Clarification • Uncoordinated and un-integrated marketing, selling and contact strategy towards the segment customer base. • Silo Based Organisational Customer Strategies
  • 10. • The quality of our customer information on CIF. • The purer the Customer Information, the greater will be the SBUs ability to contact customers, and predict customer’s propensity to take additional products. • The lack of an ‘End to End’ virtual fulfilment process for customer applications. • Research has shown that 62% of customers visit their branch less than once per month. Without end to end fulfilment in Contact Centres, we will still be reliant on customers going in to branches to finalise applications. • Segmentation could be too complex and static. This inhibits the ability to rapidly respond to changes within the market. • Segmentation should be basic and cater for income & life stage splits. • The lack of an integrated, co-ordinated approach to cross selling through the Distribution Channels. • Various segment strategies when executed, could be directed to the same customer, without prioritising or phasing being applied. • Customer scoring models are product orientated, and may not support multiple product scoring. • A customer approved for a Home Loan, may not necessarily qualify for a Cheque Account. The introduction of a total customer view & multiple product scoring will benefit cross selling. • Data Mining Models • Propensity Models • Event Based Triggers • Next Best Product • Proactive selling techniques developed within the Contact Centre • Focused Selling, Up Selling, Down Selling, Add On Selling, By the Way Selling, Cross Selling, Puppy Dog Selling and Match Selling techniques will up your conversion ratios if aligned to the right campaign. • Potential capacity within t Contact Centres • Optimisation of capacity & the potential for ‘End to End’ processing • Substantial existing Customer Base to support data mining and analytics • Data volumes are required to ensure key commercial drivers linked to Cost of Sale, and Operational Efficiencies. • Highly skilled and tenured sales staff – skilled in multi product lines and services • They need to be able to respond to client needs, questions and responses outside of any call script, but within the compliance and governance framework.