More Related Content
Similar to 2015-CLSA-Report-Recent-Trends-in-FDA-Med-Device-Regulation-Final (20)
More from Will Zasadny (8)
2015-CLSA-Report-Recent-Trends-in-FDA-Med-Device-Regulation-Final
- 1. PAUL HORNSOURCE:FDA data as of 5.31.15 and BCG Analysis
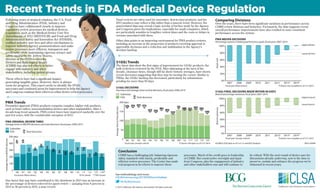
Recent Trends in FDA Medical Device Regulation
510(k) Trends
The latest data show the first signs of improvement for 510(k) products, the
bulk of devices reviewed by the FDA. After plateauing at the turn of the
decade, clearance times, though still far above historic averages, have shown
recent decreases suggesting that they may be turning the corner. Similar to
PMAs, the 510(k) backlog has decreased, particularly for submissions
pending for more than 90 days.
Other data points to an improving environment for PMA product reviews,
including an increase in the proportion of products receiving approval or
approvable decisions and a reduction and stabilization in the Agency’s
decision backlog.
Submitter
FDA Total decisionsXX
’13*’12*’11*’10’09*’08’07’06’05’04’03’02’01’00 ’14*
*Cohorts still open as of 3.31.2014
510(k) DECISIONS
Decisions and average times to final decisions,fiscal years 2000-2014
Averagetimetofinaldecision
200
150
100
50
0
days
4204 4254
3394
4322 4225
3632 3550
3853
3656
3348
4101
3880 3833 3992 3865
Panel reviews are often used for innovative, first-in-class products, and the
2013 numbers may reflect a blip rather than a nascent trend. However, the
panel-related data may reveal a topic worthy of further study by the Agency
and Congress given the implications, especially for small companies, which
are particularly sensitive to lengthier review times and the costs or delays in
revenue associated with them.
Following years of strained relations, the U.S. Food
and Drug Administration (FDA), industry and
Congress have collaborated closely to improve
regulatory review processes for medical devices.
Legislation, such as the Medical Device User Fee
Amendments of 2012 (MDUFA III) and Food and Drug
Administration Safety and Innovation Act (FDASIA),
codified industry user fees and other mechanisms to
improve industry-Agency communications and make
review processes more efficient, transparent and
predictable while maintaining rigorous science and
safety standards. Dr. Jeffrey Shuren,
director of the FDA’s Center for
Devices and Radiological Health
(CDRH) has also led efforts to better
engage with industry and other
stakeholders, including patient groups.
These efforts have had a significant impact,
generating tangible gains. However, there is always
room for progress. This report seeks to identify the FDA’s
successes and continued areas for improvement to help the Agency
and Congress continue their efforts to refine device review processes.
One factor that may have contributed to the slowdown in 2013 was an increase in
the percentage of devices referred for panel review — jumping from 8 percent in
2012 to 36 percent in 2013, a near record.
500
400
300
200
100
0
’13*’12’11’10’09’08’07’06’05’04’03’02’01’00 ’14**
AveragetimetoMDUFAdecision
days
Submitter
FDA Total decisionsXX
PMA ORIGINAL REVIEW TIMES
Average times to MDUFA decisions and total decisions,fiscal years 2000-2014
*97% closed **79% closed
65 66
41 43
53
47
39
35
30 32
43 43
24
28
22
PMA Trends
Premarket approval (PMA) products comprise complex, higher risk products,
such as heart valves, neuromodulation devices and other implantables. After a
decade-long trend upwards, PMA review times have improved markedly over the
past few years, with the considerable exception of 2013.
Comparing Divisions
Over the years, there have been significant variations in performance across
CDRH review divisions and branches. Fortunately, the data suggests recent
overall performance improvements have also resulted in more consistent
performance across the system.
2013*201220112010200920082007 2014*
PMA MDUFA DECISIONS
Percentage variance meeting performance goals,fiscal years 2007-2014
100%
80%
60%
40%
20%
0%
*Cohorts not complete as of 5.31.2015
Goalsmet
*Cohorts not complete as of 5.31.2015
510(k) FINAL DECISIONS MADE WITHIN 90 DAYS
Branch percentage variances,fiscal years 2007-2014
2013*2012*201120102009*20082007 2014*
Branchvariances
100%
80%
60%
40%
20%
0%
Highest branch
Lowest branch
Highestdivision
Lowest division
See methodology and more:
CALifeSciences.org/2015FDADeviceUpdate
@CALifeSciences
© 2015 California Life Sciences Association.All rights reserved.
Conclusion
CDRH has a challenging job: balancing rigorous
safety standards with timely, predictable and
efficient review processes. The Center has made
real progress in its efforts to improve these
processes. Much of the credit goes to leadership
of CDRH. But constructive oversight and input
from Congress, plus the engagement of industry
and other stakeholders was and will continue to
be critical. With the next round of device user fee
discussions already underway, now is the time to
preserve, sustain and enhance the progress we’ve
witnessed in recent years.
Fiscal year (filed cohort)
Fiscal year (receipt cohort)
Fiscal year (filed cohort)
Fiscal year (receipt cohort)