2. differential expression of various DLC1 isoforms suggests interplay in modulating the complex
activities of DLC1 during carcinogenesis.
Keywords
DLC1; RhoGAP; methylation; tumor suppressor gene; carcinoma; p53
Introduction
Carcinogenesis involves multiple genetic/epigenetic events including the activation of
oncogenes and inactivation of tumor suppressor genes (TSGs) (Fearon and Vogelstein,
1990; Knudson, 2001). In addition to genetic mutations, a growing body of evidence has
shown that TSG inactivation occurs frequently through promoter CpG methylation (Jones
and Laird, 1999; Herman and Baylin, 2003), resulting in TSG silencing and subsequent loss
of function, thereby contributing to neoplastic transformation (Jones and Baylin, 2007).
Aberrant CpG methylation of TSG-associated CpG islands is a characteristic hallmark of
tumor genomic DNA, and examples of methylation silenced TSGs include p16, MLH1,
VHL, RAR-beta, SOCS1, PCDH10, RASAL and so on (Herman and Baylin, 2003; Jones
and Baylin, 2007).
Deleted in liver cancer 1 (DLC1) gene (also known as ARHGAP7, STARD12, HP and
p122-RhoGAP) was isolated by representational difference analysis (Yuan et al., 1998) from
a sample of human hepatocellular carcinoma (HCC), and proposed as a candidate TSG
because of its frequent deletion in hepatocellular carcinoma tumors and cell lines. Located at
8p22, a site of recurrent deletion in breast, lung and prostate cancers (Yuan et al., 1998),
DLC1 encodes a protein of 1091-aa (amino acid) with extensive homology (86%) to the rat
p122-RhoGAP, a GTPase-activating protein (GAP) specific for RhoA and Cdc42 that are
involved in the regulation of cellular cytoskeleton organization and other functions (Homma
and Emori, 1995; Yuan et al., 1998; Sekimata et al., 1999; Bernards, 2003; Wong et al.,
2003; Durkin et al., 2007b). Subsequent studies identified DLC1 as an epigenetically
silenced gene with tumor suppressive and metastatic inhibitory functions in breast, liver,
colon, lung, stomach and brain cancers (Kim et al., 2003; Yuan et al., 2003, 2004; Zhou et
al., 2004; Pang et al., 2005). Recently, using suppression substractive hybridization, our
group identified DLC1 as an epigenetically silenced gene in nasopharyngeal (NPC),
esophageal and cervical carcinomas (Seng et al., 2007), thus, further supporting the view
that DLC1 is a bona fide TSG.
DLC1 is a member of the human RhoGAP family. RhoGAP proteins share a conserved 150–
200-aa GAP domain that contains the catalytic activity to convert the active GTP-bound Rho
proteins to the inactive GDP-bound state (Bernards, 2003; Moon and Zheng, 2003;
Tcherkezian and Lamarche-Vane, 2007; Durkin et al., 2007b). Loss of RhoGAP activity
leads to aberrant activation of GTP-bound Rho proteins, which are involved in the
regulation of the cell cycle, adhesion, morphogenesis, polarity and migration; and
dysregulation of GTP-bound Rho proteins have been implicated in tumorigenesis (Martin,
2003; Moon and Zheng, 2003). Members of the DLC family include DLC1, DLC2, and
DLC3, and their domain structures share an N-terminal sterile α motif domain, a serine-rich
domain, a RhoGAP domain and a C-terminal steroidogenic acute regulatory protein-related
lipid transfer domain (Yuan et al., 1998; Ponting and Aravind, 1999; Ching et al., 2003;
Durkin et al., 2007a). Recently, Yuan et al. (2007) showed that DLC1 harbors a functional
bipartite nuclear localization signal which works together with the RhoGAP and serine-rich
domain to mediate DLC1 protein nuclear transfer and subsequent apoptosis in non-small-
cell lung carcinoma cells. In addition, DLC1 knockdown in the background of c-myc
Low et al. Page 2
Oncogene. Author manuscript; available in PMC 2012 June 28.
NIH-PAAuthorManuscriptNIH-PAAuthorManuscriptNIH-PAAuthorManuscript
3. overexpression promotes the formation of liver tumors in a murine model (Xue et al., 2008).
Taken together, these data suggest that DLC1 function both as a cytoplasmic and nuclear
tumor suppressor, and highlight the importance of DLC1 in cancer development.
During our study of DLC1, we discovered a new isoform through 5′-rapid amplification of
complementary DNA (cDNA) ends (5′-RACE). Here, we report the characterization of this
novel isoform (designated DLC1-isoform 4 (DLC1-i4)), its mRNA expression and
epigenetic alterations in multiple carcinomas. We also describe the response of the DLC1-i4
promoter to p53 and the expression of the two other DLC1 isoforms (-i1 and -i3) in human
cells. Lastly, we demonstrate that DLC1-i4 and -i1 suppress tumor cell colony formation.
Results
5′-RNA ligase-mediated rapid amplification of cDNA ends (5′ RLM-RACE) identifies a novel
isoform of DLC1 (DLC1-i4) and expression profiles of all four isoforms in normal tissues
To identify novel isoform(s) of DLC1, 5′-RLM-RACE was performed on NP69 and liver
total RNA using antisense primers targeting the DLC1 common exons 9 and 12 (Table 1 and
Figure 1a). Two PCR bands of 205 bp and 199 bp were obtained and sequenced. Sequence
analysis identified two transcriptional start sites only 6 bp apart and overlapped with a
previously deposited partial cDNA sequence (AK025544) in NCBI database (Figure 1b).
Subsequent BLAST searches identified 15 expressed sequence tags (Genbank accession:
DA853751, DA409883, DA403097, DA401187, DA231722, DA328255, DA334650,
BP287999, BP285601, CN388450, BX474714, BX474696, BP238467, CN388449 and
BP287477) with their transcriptional start sites close to the two established by us.
We then cloned and sequenced the full-length 3,378 bp open reading frame (ORF) of DLC1-
i4 from human liver RNA and identified a 1,125-aa open reading frame precisely matched
with DLC1-i1 and -i2 except for a different short N-terminal region (Figure 1c and
Supplementary Figure 1). Domain analysis showed the presence of domains typical of all
the DLC members (Bernards, 2003; Ching et al., 2003; Durkin et al., 2007a) (Figure 1c). In
addition, a putative mitochondrial targeting sequence was identified within the first 30 aa of
DLC1-i4 using five online bioinformatics program, iPSORT, MitoProt II, Predotar,
Mitopred and TargetP 1.1 server (Claros and Vincens, 1996; Bannai et al., 2002; Small et
al., 2004; Guda et al., 2004a, b; Emanuelsson et al., 2007). This sequence is coded by the
unique first exon of DLC1-i4 and is absent in other isoforms (Figure 1c and Supplementary
Figure 1).
Genbank and Ensembl database searches querying the predicted aa sequence encoded by the
new first exon found both full-length and partial mRNA transcripts coding for DLC1-i4
orthologs in mouse, rabbit, Rhesus macaque, cattle and elephant (Supplementary Figure 2).
This cDNA was thus designated DLC1-i4 in accordance with the nomenclature used by
GenBank. Due to a sequence variation in the previous cDNA sequence AK025544, in silico
translation of this cDNA would yield a truncated protein of 804-aa up to the end of the
RhoGAP domain (Supplementary Figure 1). With most of the available expression data on
DLC1 isoform 2 only, we investigated the expression of all DLC1 isoforms including
DLC1-i4 in human normal adult and fetal tissues by reverse transcription PCR (RT– PCR)
using exon-specific primers to distinguish each isoform. All isoforms were detected in all
normal tissues examined, with isoforms 2 and 4 showing stronger expression, and isoform 3
the weakest (Figure 1d).
Supplementary Information accompanies the paper on the Oncogene website (http://www.nature.com/onc)
Low et al. Page 3
Oncogene. Author manuscript; available in PMC 2012 June 28.
NIH-PAAuthorManuscriptNIH-PAAuthorManuscriptNIH-PAAuthorManuscript
4. The functional DLC1-i4 promoter is upregulated by p53 and stress
We used bioinformatic screening to analyze ~3Kb upstream of the putative DLC1-i4
promoter. A CpG-island of 1087 bp spanning the promoter, exon 1 and part of intron1 was
found (Takai and Jones, 2002): GC content, 57%; observed/expected CpG ratio, 0.737; with
a high concentration of 55 CpG sites in a 564-bp region (Figures 2a and 4a). Potential
transcription factor (TF)-binding sites predicted by three TF search programs (TFSEARCH,
MotifSearch and MatInspector) suggest that the DLC1-i4 promoter might be regulated by
TP53, E2F, STAT and heat-shock factor (Figure 2a).
Next, we evaluated whether the putative DLC1-i4 promoter was transcriptionally functional
by cloning three fragments covering the promoter separately into a promoter-less luciferase
construct and transfected cell-lines with/without DLC1-i4 expression (HEK293, CNE2 and
HK1). All three constructs could drive transcription, with the shortest fragment (−480/+140)
showing the highest activity and the longest (−1840/+140) showing the lowest activity
(Figure 2b), showing that the DLC1-i4 promoter is functional.
Bioinformatics analysis predicts that the DLC1-i4 promoter harbors five putative p53-
binding sites (Figure 2a). To see whether p53 regulates this promoter, the promoter construct
(pGL2-DLC1i4-PF1/R(−1840/+140)) with or without a p53 expression vector was
transfected into HEK293, CNE2 and the p53-null HCT116/p53KO cells, and luciferase
activity was assayed. As shown in Figure 2c, p53 induced upregulation of luciferase activity
ranging from 3- to 38-fold, with the highest activity observed in HCT116/p53KO cells
(Figure 2c). Co-transfection of DLC1-i4 promoter construct with mutant p53 expression
plasmids (G245C and R248W) into HCT116-p53KO, showed that only wild-type p53 could
upregulate DLC1-i4 and control p21 promoter activities (10-fold and 2.5-fold, respectively)
(Figure 2d). As the p53 mutants are defective in DNA-binding (Zhou et al., 1999; Bullock
and Fersht, 2001), this finding suggests that the ability of wild-type p53 to upregulate
DLC1-i4 promoter activity is attributed to its DNA binding ability. In addition, both gene
promoters showed upregulation of activity in response to increasing p53 concentration in a
statistically significant (P<0.001–0.0015), dose-dependent manner up to 50 ng (Figure 2e)
before dropping off at higher p53 concentrations.
We also transfected HCT116 or HCT116/p53KO cells with either the DLC1-i4 or the p21-
promoter construct for 48 h before irradiation with 10 J/m2 of UV light and assayed for
luciferase activity after 2–6 h incubation. Upregulation of either DLC1-i4 or p21 promoter
activities was observed (Supplementary Figure 3), indicating that the DLC1-i4 promoter is
stress-responsive.
Promoter CpG methylation silences DLC1-i4 expression in multiple carcinoma cell lines
As the functional DLC1-i4 promoter contains a CpG island, we assessed whether like
DLC1-i2, DLC1-i4 is also silenced in tumors. The expression of DLC1-i4, together with -i1,
-i2 and -i3, were examined by semi-quantitative RT–PCR in a panel of carcinoma cell lines,
and we correlated DLC1-i4 expression with its promoter CpG methylation using
methylation-specific PCR (MSP) and bisulfite genomic sequencing (BGS). Results showed
weak or no expression of DLC1-i4 transcripts in multiple carcinoma cell lines, including 2/4
NPC, 8/ 16(50%) esophageal, 4/16(25%) gastric, 6/9(67%) breast, 3/4 colorectal, 4/4
cervical, 2/8(25%) lung carcinomas, as well as the various other cell lines tested (Figure 3
and Supplementary Figure 4). Meanwhile, strong methylated alleles were consistently
detected in cell lines without DLC1-i4 expression by MSP (Table 2, Figure 3 and
Supplementary Figure 4). In contrast, DLC1-i4 was readily detected in all normal (HMEC
and HMEpC) and normal immortalized cell lines (NP69, HEK293, RHEK1, NE1 and NE3)
tested, with no methylated promoter alleles detected (Table 2 and Figure 3). High-resolution
Low et al. Page 4
Oncogene. Author manuscript; available in PMC 2012 June 28.
NIH-PAAuthorManuscriptNIH-PAAuthorManuscriptNIH-PAAuthorManuscript
5. BGS analysis performed for 55 CpG sites in the DLC1-i4 promoter (Figure 4a) validated the
MSP data (Figure 4b). Collectively these results show that aberrant promoter CpG
methylation is associated with DLC1-i4 silencing, and like DLC1-i2, is a frequent event in
multiple tumors.
DLC1-i1 and -i3 share a common promoter and their expression were silenced in almost all
the tumor cell lines tested (Figure 3). Analysis on their shared CpG poor promoter through
promoter luciferase assay showed that it is a transcriptionally functional promoter
(Supplementary Figure 5A and 5B). Lack of TFs to drive the expression of DLC1-i1, -i3 and
-i4 was unlikely, as all promoter constructs were active in HK1, a cell line not expressing
any DLC1 isoforms (Figure 3). Further work is required to elucidate the mechanism of the
silencing of DLC1-i1 and -i3.
However, unlike DLC1-i2, DLC1-i4 is not expressed in normal peripheral blood
mononuclear cells (PBMCs) with no methylated alleles detected, but is expressed in normal
lymph node (Figure 1d), indicating that mechanisms other than DNA methylation are
involved in silencing of DLC1-i4 promoter in normal PBMCs (Supplementary Figure 4B).
This raised the possibility that different DLC1 isoforms might have functional specialization
in different subsets of cells. Interestingly, DLC1-i4 is not expressed in any of the lymphoma
cell lines tested (Supplementary Figure 4B), correlating with methylation of the DLC1-i4
promoter.
Pharmacologic or genetic demethylation restores DLC1-i4 expression
To determine whether CpG methylation is directly implicated in the silencing of DLC1-i4,
two cell lines (C666–1 and HK1) with methylated and silenced DLC1-i4 were treated with
DNA methyltransferase inhibitor 5-aza-2′-deoxycytidine (Aza). DLC1-i4 expression was
restored after Aza treatment, although at different levels, with a concomitant increase in un-
methylated promoter allele detected by MSP (Figure 4c). The same phenomenon was
observed when HCT116, EC109 and HK1 were treated with Aza alone, or combination with
a histone deacetylase inhibitor trichostatin A (TSA) (Figure 4d). TSA treatment alone is
insufficient to induce DLC1-i4 expression, implying a critical role for DNA methylation.
Moreover, for HCT116 with genetic double knockout of both DNMT1 and DNMT3B genes
(HCT116-DKO cell line) (Rhee et al., 2002), robust induction of DLC1-i4 RNA was
accompanied by increased unmethylated DLC1-i4 alleles (Figure 4e). Weak DLC1-i4
expression with some demethylated alleles were also observed in DNMT1- knockout
HCT116 cells (HCT116-1KO), but knocking-out DNMT3B seems to have little effect on
DLC1-i4 reexpression, even though weak demethylated alleles were also detected.
Subsequent high-resolution BGS methylation analysis confirmed the substantial
demethylation of DLC1-i4 promoter in HCT116-DKO cells, indicating that the DLC1-i4
promoter methylation is cooperatively maintained by DNMT1 and DNMT3B (Figure 4f).
Promoter methylation and expression of DLC1-i4 in multiple primary carcinomas
DLC1-i4 methylation was next examined in multiple primary tumors, including NPC,
esophageal, gastric, hepatocellular, breast and colorectal carcinoma. We first examined
DLC1-i4 methylation in nine normal nasopharynx tissues and found weak methylation in
only three (33%) (Figure 5a and Table 2), meanwhile, methylation was detected in 48/49
(98%, with two weakly methylated) endemic NPC tumors from Asian Chinese (Figure 5a
and Table 2), and in 14/30 (47%) esophageal carcinomas but less frequently in the paired
non-tumor tissues (Figure 5c and Table 2). In addition, DLC1-i4 methylation was detected
in 9/11 (82%) primary gastric, 10/13 (77%, with two weakly methylated) breast, 14/37
(38%) HCC and 11/11 (100%) colorectal carcinomas (Figure 5c and Table 2). RT–PCR and
MSP analysis of primary NPC showed downregulation of DLC1-i4 expression in 5/9
Low et al. Page 5
Oncogene. Author manuscript; available in PMC 2012 June 28.
NIH-PAAuthorManuscriptNIH-PAAuthorManuscriptNIH-PAAuthorManuscript
6. specimens but weak correlation of DLC1-i4 expression with methylation of DLC1-i4
promoter (Figure 5b). RT–PCR analysis of matched breast primary tumor and adjacent
normal tissue showed DLC1-i4 downregulation in the tumor as compared with the matched
normal tissue (Figure 5d). These results indicate that DLC1-i4 methylation occurs frequently
in tumors and affects DLC1-i4 expression.
DLC1-i4 suppresses tumor cell colony formation
To examine the effects of DLC1-i4 on tumor cell growth, we transfected a DLC1-i4
expression construct into HCT116, HK1 and KYSE510 cell lines, all of which have
methylated and silenced endogenous DLC1-i4, and the clonogenicity of transfected cells
was assessed by monolayer culture. Significant reduction in colony numbers were observed
in all cell lines tested (down to ~24–44% of vector control, P<0.001) (Figures 6a and b),
similar to that by TP53 (data not shown). Thus, DLC1-i4 is a functional tumor suppressor
having growth inhibitory activities in tumor cells. As DLC1-i1 shares structural domains
with DLC1-i4 and DLC1-i2, we tested DLC1-i1 in the same assay and showed that DLC1-i1
is also a functional tumor suppressor (Supplementary Figure 5C).
Discussion
DLC1 is a well-defined bona fide tumor suppressor, frequently silenced in multiple tumors
(Yuan et al., 1998, 2003; Ng et al., 2000; Goodison et al., 2005; Seng et al., 2007; Xue et al.,
2008). This gene is transcribed from two different promoters, resulting in transcripts
encoding three insofar known isoforms. To date, virtually all studies have focused on only
one of them—the prototype DLC1-isoform 2. From our previous work on DLC1 in
carcinoma (Seng et al., 2007) we identified a fourth isoform of DLC1. In this report, we
provide evidence that this novel isoform 4 (DLC1-i4) codes from an alternative promoter a
1125-aa protein, which differs from DLC1-isoforms 1 and 2 at the extreme N-terminal
because of the use of an alternative first exon, but nevertheless share the rest of the exons
common to both isoforms and thus have the same protein domain structure. In addition, the
protein sequence of DLC1-i4 was found to contain a mitochondrial targeting sequence in its
first 30 aa coded for by the new first exon, a signal missing from the rest of the DLC1
isoforms. The possible mitochondria localization of DLC1-i4 however awaits further
confirmation. With the variability at the N-terminal region of DLC1-i1, -i2 and -i4, it may
be inferred that the conserved C-terminal region domains are critical in mediating specific
protein– protein interactions.
Similar to DLC1-i2, the DLC1-i4 promoter is hypermethylated in multiple tumor types
including NPC, esophageal, gastric, breast, colorectal, cervical and HCC cell lines and
primary tumors, which is associated with transcriptional silencing. Methylation-mediated
silencing could be reversed pharmacologically or by genetic double knockout of DNMT1
and DNMT3B. In addition, ectopic-DLC1-i4 expression in carcinoma cells shows tumor
suppressive properties. In contrast, no methylation or silencing was detected in any of the
immortalized normal cell line controls tested, indicating that DLC1-i4 methylation probably
occurs late in carcinogenesis. The correlation between promoter methylation and gene
expression in primary tumor will require further characterization in tumors other than NPC,
as the presence of large proportions of non-malignant stromal cells in NPC tumors makes
clear delineation of gene expression difficult.
The use of alternative promoters and exon skipping to generate transcripts with different 5′-
ends appear to be common among the DLC family of RhoGAPs. DLC2, a gene homologous
to DLC1 at 13q12.3, yields four different transcripts to generate four protein products of
differing lengths (Leung et al., 2005). DLC3 at Xq13 was found to yield three transcripts
generated by the same means (Durkin et al., 2007a). Similar type of regulation (alternative
Low et al. Page 6
Oncogene. Author manuscript; available in PMC 2012 June 28.
NIH-PAAuthorManuscriptNIH-PAAuthorManuscriptNIH-PAAuthorManuscript
7. promoters and exon variability) are also found in other TSGs, for example, TP53, APC and
BRCA1 (Horii et al., 1993; Xu et al., 1995; Bourdon et al., 2005), and is associated with the
generation of proteins with different functional properties. Our data and others show that
DLC1 encode four major isoforms from three alternative promoters. Interestingly, it was
recently verified by 3′-RACE in mouse that a 6.2Kb transcript found in the Vega database is
indeed expressed and probably codes for a 127 kDa protein with a sequence nearly identical
to DLC1-i4 (Sabbir et al., 2010). The complexity and expression of different DLC1
transcripts may be a way of differential regulation to cater for different functions of each
isoform.
As the tissue expression pattern of DLC1-i1 and -i3 transcripts is controversial, we
addressed this question using isoform-specific primers and RT–PCR to check their
expression in a panel of normal adult and fetal tissues. Our results show that all DLC1
isoforms are expressed at different levels and they have an overlapping ubiquitous
expression pattern in all normal tissues tested, except that only DLC-i2 is expressed in
PBMCs. Our work on the common promoter of DLC-i1 and -i3 demonstrated that it is a
functional promoter, and the full-length open reading frame of DLC1-i1 does have tumor
suppressor function. DLC1-i3 is unlikely to have tumor suppressor activity as it does not
harbor the canonical DLC1 domains and so was not tested. The speculation that DLC1-i3 is
a regulator of other DLC1 isoforms remains to be verified. Our findings are corroborated by
a recently published study in which DLC1β (-DLC1-i1) and DLC1α (DLC1-i2) but not
DLC1γ (DLC1-i3) were shown to suppress stress fiber formation and HCC cell growth (Ko
et al., 2010). It is noteworthy that both isoforms are almost totally silenced in all tumors and
immortalized normal cell lines tested, but the silencing mechanism is unclear as this
promoter is not a CpG island, and could not be activated by Aza treatment (unpublished
observation). Taken together, the data suggest that different DLC1 isoforms may have
different functional specialization in cellular homeostasis and oncogenesis, and whether they
are functionally redundant or not still needs further exploration.
p53 is an important tumor suppressor, mutated in ~50% of all cancers (Efeyan and Serrano,
2007). DLC1-i4 promoter harbors at least five putative p53 binding sites; and our data
showed that it is upregulated by wild-type p53, requiring the DNA-binding ability of p53.
UV treatments also moderately upregulated this promoter, similar to the p21 promoter,
indicating that the DLC1-i4 promoter is p53-regulated.
In summary, we identified a new isoform of DLC1, transcribed from an alternative
promoter. This novel isoform, designated DLC1-i4, was found to have tumor inhibitory
properties, silenced epigenetically in multiple carcinomas and regulated by the p53 tumor
suppressor. Although several important issues remain to be addressed, such as the functional
overlap of each individual DLC1 isoforms, the frequent deregulation of DLC1-i4 in multiple
tumors indicates that it may be an important tumor suppressor.
Materials and methods
Cell lines, tumor and normal tissue samples
Tumor cell lines used in this study are described elsewhere (Ying et al., 2005b) include
NPC, esophageal, gastric, breast, colorectal, cervical, lung, hepatocellular, renal, prostate,
ovarian carcinomas, Burkitt lymphoma, nasal NK/T-cell lymphoma and Hodgkin
lymphomas (Supplementary Figures).
Epithelial cell lines (HMEC and HMEpC) and immortalized epithelial cell lines (NP69,
RHEK1, HEK293, NE1 and NE3) were used as normal controls. Cell lines were routinely
maintained in RPMI or DMEM, or Keratinocyte SFM Medium (for NP69 only) (Tsao et al.,
Low et al. Page 7
Oncogene. Author manuscript; available in PMC 2012 June 28.
NIH-PAAuthorManuscriptNIH-PAAuthorManuscriptNIH-PAAuthorManuscript
8. 2002; Lo et al., 2006). Total RNA and DNA were extracted from cell pellets using TRI
Reagent (Molecular Research Centre Inc., Cincinnati, OH, USA) (Tao et al., 2002). Normal
PBMCs from healthy individuals were collected as previously described (Cheung et al.,
1993). Human normal adult and fetal tissue RNA samples were purchased commercially
(Ying et al., 2005a; Seng et al., 2007). RNA from matched human breast primary tumor and
normal tissue pair was purchased from Biochain (Hayward, CA, USA). DNA extracted from
primary tumors are described elsewhere (Tao et al., 1998, 1999; Qiu et al., 2004; Ying et al.,
2005a, b; Seng et al., 2007; Cui et al., 2008).
5′ RLM-RACE
5′-RLM-RACE was carried out with RNA from NP69 cell line and liver RNA (BD
Clontech, Palo Alto, CA, USA), using the FirstChoice RLM-RACE kit (Ambion Inc.,
Austin, TX, USA) according to the manufacturer’s protocol. Reverse transcription was
carried out with random hexamers and nested PCR used to amplify the 5′ end of DLC1
transcripts using kit provided sense primers and antisense primers specific to both DLC1-i1
and -i2 (Primer sequences available in Table 1). Nested PCR amplification was carried out
in a 25 µl volume consisting of 1 µl of cDNA, 0.6 U of AmpliTaq Gold (PE Biosystems,
Foster City, CA, USA), 0.6 µM of each primer, and 2 mM MgCl2. The amplification cycle
involve an initial ‘hot start’ at 95 °C for 10 min, followed by 35 cycles of amplifications (94
°C, 30 s; 55 °C, 30 s; 72 °C, 2 min) with a final extension step of 72°C for 10 min. Nested
PCR reaction was diluted 10 × with sterile water and 1 µl of the diluted reaction was used
for subsequent nested PCR with the same conditions. PCR products were analyzed on 1.8%
agarose gels. Two bands of 205 bp and 199 bp from Liver and NP69, respectively, were
excised, purified and sequenced with the ABI PRISM BigDye v1.1 Kit (PE Biosystems)
with the inner primer E10R.
Bioinformatics analysis
Sequences obtained were analyzed using BLASTN (Altschul et al., 1990) program
(www.ncbi.nlm.nih.gov/blast). Gene structure and orthologs were obtained from GenBank
(www.ncbi.nlm.nih.gov/entrez/query.fcgi?CMD=search&DB=gene) and Ensembl databases
(http://www.ensembl.org) (Maglott et al., 2007; Flicek et al., 2010). Alignment of aa
sequences and phylogenetic tree generation were carried out using the ClustalW2 program
(http://www.ebi.ac.uk/Tools/clustalw2/index.html) (Larkin et al., 2007) and shaded using
BioEdit 7.0.1 (www.mbio.ncsu.edu/BioEdit/bioedit.html) (Hall, 1999). Potential TF-binding
sites on DLC1-i4 promoter were predicted using TFSEARCH
(www.cbrc.jp/research/db/TFSEARCH.html) (Yutaka Akiyama, 1995; Heinemeyer et al.,
1998), MotifSearch (www.motif.genome.jp/) (Heinemeyer et al., 1999) and MatInspector
(www.genomatix.de) (Cartharius et al., 2005). CpG island was predicted with CpG Island
Searcher (www.uscnorris.com/cpgislands2/cpg.aspx) (Takai and Jones, 2002, 2003) using
default settings. N-terminal signal peptide analysis were done using iPSORT
(http://hc.ims.u-tokyo.ac.jp/iPSORT/) (Bannai et al., 2002), MitoProt II
(http://ihg2.helmholtz-muenchen.de/ihg/mitoprot.html) (Claros and Vincens, 1996),
Predotar (http://urgi.versailles.inra.fr/predotar/predotar.html) (Small et al., 2004), Mitopred
(http://bioapps.rit.albany.edu/MITOPRED/) (Guda et al., 2004a, b) and TargetP 1.1
(http://www.cbs.dtu.dk/services/TargetP/) (Emanuelsson et al., 2007).
Semi-quantitative RT–PCR
RT–PCR was done as previously described (Tao et al., 1998, 2002), with primers in Table 1,
together with house-keeping gene GAPDH as a control. RT–PCR was performed for 35
cycles for all genes except GAPDH (25 cycles), using the GeneAmp RNA PCR system
(Applied Biosystems).
Low et al. Page 8
Oncogene. Author manuscript; available in PMC 2012 June 28.
NIH-PAAuthorManuscriptNIH-PAAuthorManuscriptNIH-PAAuthorManuscript
9. Gene reporter assays
From normal placenta DNA (Sigma-Aldrich Corporation, St Louis, MO, USA), three
regions of the putative DLC1-i4 and -i1 promoter were PCR amplified using a high-fidelity
DNA polymerase, Phusion (Finnzymes, Espoo, Finland) and ligated to the promoter-less
pGL2-Enhancer vector (Promega, Madison, WI, USA) to create pGL2-DLC1i4-PF1/
R(−1840/+140), pGL2-DLC1i4-PF2/R(−960/+140), pGL2-DLC1i4-PF3/R(−480/+140);
pGL2-DLC1i1-F1/R(−1272/+286), pGL2-DLC1i1-F2/R(−656/+286) and pGL2-DLC1i1-
F3/R(−376/+286). The p21 promoter plasmid (pGL2–p21P) was a kind gift from Drs Satya
Narayan and Bert Vogelstein (University of Florida, Gainesville, FL, USA; Johns Hopkins,
Baltimore, MD, USA). Plasmids used for transfection were prepared and purified using the
Endofree Plasmid Maxi Kit from Qiagen (Qiagen GmbH, Germany). Promoter activities
were tested by co-transfection of cell lines (HEK293, CNE2 and HK1) in 12-well plates
with 2 µg of promoter construct and 100 ng of Renilla Luciferase plasmid pRL-SV40 as an
internal control using Fugene 6 (Roche Diagnostics, Mannheim, Germany). Transfected
cells were grown for 48 h before luciferase assay using the Dual Luciferase Reporter Assay
System (Promega). Three independent assays were conducted and the mean ± s.d. values
were calculated.
To assess the effect of p53 on DLC1-i4 promoter activity, concentrations of the p53
expression vector ranging from 1 to 500 ng (pcDNA3.1(+)TP53) or two mutant p53
expression constructs (G245C and R248W) (gifts from Bert Vogelstein) were cotransfected
with 2µg of pGL2-DLC1i4-PF1/R(−1840/+140) and 100 ng pRL-SV40 into respective cells
lines. For comparative purposes, the p21 promoter construct pGL2–p21P was used as a
positive control for p53-dependent transcriptional activation. For UV treatment, cells after
transfection are allowed to grow for 48 h and the growth medium removed before irradiation
with 10 J/m2 UV in a Stratalinker UV Crosslinker 1800 (Stratagene, La Jolla, CA, USA).
After UV irradiation, growth media were replaced and incubated for a further 2–6 h before
luciferase assay.
Construction of expression plasmids
The full-length cDNA of DLC1-i4 and -i1 with a Hemagglutinin tag at its N-terminus and its
ATG ‘start’ codon within a Kozak consensus sequence (Kozak, 1986, 1987), and the
common ‘stop’ codon present in exon 21 (Figure 1a) was PCR cloned from human liver-
tissue RNA (BD Clontech) using a high-fidelity DNA polymerase, Phusion. The cDNA was
then restriction enzyme digested, cloned into the expression vector pcDNA3.1(+)
(Invitrogen, Carlsbad, CA, USA) and sequenced. pcDNA3.1(+)TP53 was constructed by
subcloning the full-length wild-type TP53 from plasmid pC53-SN (gift from Dr Bert
Vogelstein) into pcDNA3.1(+). The two mutant p53 expression constructs (G245C &
R248W) were also gifts from Dr Bert Vogelstein.
Bisulfite treatment and promoter methylation analysis
Bisulfite modification of DNA and the subsequent MSP and BGS analyses were previously
described (Tao et al., 1999, 2002). MSP and BGS primer sets are listed in Table 1. All
primer sets were previously tested for not amplifying any unbisulfited DNA. For BGS, the
PCR products were TA-cloned into the pCR2.1-TOPO vector (Invitrogen) and 5–12
colonies were randomly chosen and sequenced. All PCR reactions were carried out using the
AmpliTaq-Gold DNA polymerase (Applied Biosystems).
Aza and TSA treatment
Freshly seeded cells (C666-1 and HK1) at a concentration of 1 × 10⁵ cells per ml in T-75
flasks were grown overnight with fresh medium containing Aza (Sigma-Aldrich
Low et al. Page 9
Oncogene. Author manuscript; available in PMC 2012 June 28.
NIH-PAAuthorManuscriptNIH-PAAuthorManuscriptNIH-PAAuthorManuscript
10. Corporation) at a final concentration of 50 µM (Qiu et al., 2004; Ying et al., 2005b). Cells
were treated continuously for 72 or 144 h, with the Aza-containing medium changed every
24 h before being harvested for DNA and RNA extraction. For TSA treatment, cells
(HCT116, EC109 and HK1) were treated as above for 72 h using 10 µM of Aza and
subsequently for another 24 h with 100 ng/ml TSA.
Colony formation assays
HCT116, HK1 and EC109 cells (3 × 10⁵ cells per ml) were plated in a 12-well plate and
allowed to grow for 24 h before being transfected with 2 µg of expression plasmids or empty
vector using Fugene 6 (Roche Diagnostics) according to the manufacturer’s protocol. At 48
h post-transfection, transfected cells were trypsinized and diluted into 6-well plates with
G-418 (500 µg/ml) selection for 2–3 weeks. Surviving colonies (with >50 cells per colony)
were counted and analyzed after staining with Gentian Violet. The experiment was repeated
thrice independently.
Accession number
The sequences of the RLM-RACE products of DLC1 from liver and NP69 have been
deposited into GenBank (Accession no: EU159199 and EU159200, respectively).
Acknowledgments
This project was supported by an A*STAR grant (Johns Hopkins Singapore, QT/WS/RA), a Chinese University of
Hong Kong grant (QT) and a grant from Singapore National Research Foundation and the Ministry of Education
under the Research Center of Excellence Program (WS/RA). We thank Drs Bert Vogelstein, George Tsao, (Dolly
Huang), Michael Obster and Guiyuan Li for some cell lines; and DSMZ (German Collection of Microorganisms &
Cell Cultures) for the KYSE cell lines (Shimada et al., Cancer 69: 277–284, 1992). We also thank Drs Wenling
Han, Thomas Putti, Luke Tan for some tumor samples.
References
Altschul SF, Gish W, Miller W, Myers EW, Lipman DJ. Basic local alignment search tool. J Mol Biol.
1990; 215:403–410. [PubMed: 2231712]
Bannai H, Tamada Y, Maruyama O, Nakai K, Miyano S. Extensive feature detection of N-terminal
protein sorting signals. Bioinformatics. 2002; 18:298–305. [PubMed: 11847077]
Bernards A. GAPs galore! A survey of putative Ras superfamily GTPase activating proteins in man
and Drosophila. Biochim Biophys Acta. 2003; 1603:47–82. [PubMed: 12618308]
Bourdon JC, Fernandes K, Murray-Zmijewski F, Liu G, Diot A, Xirodimas DP, et al. p53 isoforms can
regulate p53 transcriptional activity. Genes Dev. 2005; 19:2122–2137. [PubMed: 16131611]
Bullock AN, Fersht AR. Rescuing the function of mutant p53. Nat Rev Cancer. 2001; 1:68–76.
[PubMed: 11900253]
Cartharius K, Frech K, Grote K, Klocke B, Haltmeier M, Klingenhoff A, et al. MatInspector and
beyond: promoter analysis based on transcription factor binding sites. Bioinformatics. 2005;
21:2933–2942. [PubMed: 15860560]
Cheung WY, Chan AC, Loke SL, Srivastava G, Pittaluga S, Lim LY, et al. Latent sites of Epstein-Barr
virus infection. Am J Clin Pathol. 1993; 100:502–506. [PubMed: 8249889]
Ching YP, Wong CM, Chan SF, Leung TH, Ng DC, Jin DY, et al. Deleted in liver cancer (DLC) 2
encodes a RhoGAP protein with growth suppressor function and is underexpressed in hepato-
cellular carcinoma. J Biol Chem. 2003; 278:10824–10830. [PubMed: 12531887]
Claros MG, Vincens P. Computational method to predict mitochondrially imported proteins and their
targeting sequences. European Journal of Biochemistry. 1996; 241:779–786. [PubMed: 8944766]
Cui Y, Ying Y, van Hasselt A, Ng KM, Yu J, Zhang Q, et al. OPCML is a broad tumor suppressor for
multiple carcinomas and lymphomas with frequently epigenetic inactivation. PLoS ONE. 2008;
3:e2990. [PubMed: 18714356]
Low et al. Page 10
Oncogene. Author manuscript; available in PMC 2012 June 28.
NIH-PAAuthorManuscriptNIH-PAAuthorManuscriptNIH-PAAuthorManuscript
11. Durkin ME, Ullmannova V, Guan M, Popescu NC. Deleted in liver cancer 3 (DLC-3), a novel Rho
GTPase-activating protein, is downregulated in cancer and inhibits tumor cell growth. Oncogene.
2007a; 26:4580–4589. [PubMed: 17297465]
Durkin ME, Yuan BZ, Zhou X, Drazen BZ, Douglas RL, Thorgeirsson SS, et al. DLC-1:a Rho
GTPase-activating protein and tumour suppressor. Journal of Cellular and Molecular Medicine.
2007b; 11:1185–1207. [PubMed: 17979893]
Efeyan A, Serrano M. p53: guardian of the genome and policeman of the oncogenes. Cell Cycle. 2007;
6:1006–1010. [PubMed: 17457049]
Emanuelsson O, Brunak S, von Heijne G, Nielsen H. Locating proteins in the cell using TargetP,
SignalP and related tools. Nat Protocols. 2007; 2:953–971.
Fearon ER, Vogelstein B. A genetic model for colorectal tumorigenesis. Cell. 1990; 61:759–767.
[PubMed: 2188735]
Flicek P, Aken BL, Ballester B, Beal K, Bragin E, Brent S, et al. Ensembl’s 10th year. Nucl Acids Res.
2010; 38:D557–D562. [PubMed: 19906699]
Goodison S, Yuan J, Sloan D, Kim R, Li C, Popescu NC, et al. The RhoGAP protein DLC-1 functions
as a metastasis suppressor in breast cancer cells. Cancer Res. 2005; 65:6042–6053. [PubMed:
16024604]
Guda C, Fahy E, Subramaniam S. MITOPRED: a genome- scale method for prediction of nucleus-
encoded mitochondrial proteins. Bioinformatics. 2004a; 20:1785–1794. [PubMed: 15037509]
Guda C, Guda P, Fahy E, Subramaniam S. MITOPRED: a web server for the prediction of
mitochondrial proteins. Nucl Acids Res. 2004b; 32:W372–W374. [PubMed: 15215413]
Hall TA. Bioedit: A user friendly biological sequence alignment editor and analysis program for
Windows 95/98/NT. Nucl Acids Symp Ser. 1999; 41:95–98.
Heinemeyer T, Chen X, Karas H, Kel AE, Kel OV, Liebich I, et al. Expanding the TRANSFAC
database towards an expert system of regulatory molecular mechanisms. Nucleic Acids Res. 1999;
27:318–322. [PubMed: 9847216]
Heinemeyer T, Wingender E, Reuter I, Hermjakob H, Kel AE, Kel OV, et al. Databases on
transcriptional regulation: TRANSFAC, TRRD and COMPEL. Nucleic Acids Res. 1998; 26:362–
367. [PubMed: 9399875]
Herman JG, Baylin SB. Gene silencing in cancer in association with promoter hypermethylation. N
Engl J Med. 2003; 349:2042–2054. [PubMed: 14627790]
Homma Y, Emori Y. A dual functional signal mediator showing RhoGAP and phospholipase C-delta
stimulating activities. EMBO J. 1995; 14:286–291. [PubMed: 7835339]
Horii A, Nakatsuru S, Ichii S, Nagase H, Nakamura Y. Multiple forms of the APC gene transcripts and
their tissue-specific expression. Hum Mol Genet. 1993; 2:283–287. [PubMed: 8388766]
Jones PA, Baylin SB. The epigenomics of cancer. Cell. 2007; 128:683–692. [PubMed: 17320506]
Jones PA, Laird PW. Cancer epigenetics comes of age. Nat Genet. 1999; 21:163–167. [PubMed:
9988266]
Kim TY, Jong HS, Song SH, Dimtchev A, Jeong SJ, Lee JW, et al. Transcriptional silencing of the
DLC-1 tumor suppressor gene by epigenetic mechanism in gastric cancer cells. Oncogene. 2003;
22:3943–3951. [PubMed: 12813468]
Knudson AG. Two genetic hits (more or less) to cancer. Nat Rev Cancer. 2001; 1:157–162. [PubMed:
11905807]
Ko FC, Yeung YS, Wong CM, Chan LK, Poon RT, Ng IO, et al. Deleted in liver cancer 1 isoforms are
distinctly expressed in human tissues, functionally different and under differential transcriptional
regulation in hepatocellular carcinoma. Liver International. 2010; 30:139–148. [PubMed:
19874489]
Kozak M. Point mutations define a sequence flanking the AUG initiator codon that modulates
translation by eukaryotic ribosomes. Cell. 1986; 44:283–292. [PubMed: 3943125]
Kozak M. An analysis of 5’-noncoding sequences from 699 vertebrate messenger RNAs. Nucleic
Acids Res. 1987; 15:8125–8148. [PubMed: 3313277]
Larkin MA, Blackshields G, Brown NP, Chenna R, McGettigan PA, McWilliam H, et al. Clustal W
and Clustal x version 2.0. Bioinformatics. 2007; 23:2947–2948. [PubMed: 17846036]
Low et al. Page 11
Oncogene. Author manuscript; available in PMC 2012 June 28.
NIH-PAAuthorManuscriptNIH-PAAuthorManuscriptNIH-PAAuthorManuscript
12. Leung TH, Ching YP, Yam JW, Wong CM, Yau TO, Jin DY, et al. Deleted in liver cancer 2 (DLC2)
suppresses cell transformation by means of inhibition of RhoA activity. Proc Natl Acad Sci USA.
2005; 102:15207–15212. [PubMed: 16217026]
Lo AK, Lo KW, Tsao SW, Wong HL, Hui JW, To KF, et al. Epstein-Barr virus infection alters cellular
signal cascades in human nasopharyngeal epithelial cells. Neoplasia. 2006; 8:173–180. [PubMed:
16611410]
Maglott D, Ostell J, Pruitt KD, Tatusova T. Entrez gene: gene-centered information at NCBI. Nucleic
Acids Res. 2007; 35:D26–D31. [PubMed: 17148475]
Martin GS. Cell signaling and cancer. Cancer Cell. 2003; 4:167–174. [PubMed: 14522250]
Moon SY, Zheng Y. Rho GTPase-activating proteins in cell regulation. Trends Cell Biol. 2003; 13:13–
22. [PubMed: 12480336]
Ng IO, Liang ZD, Cao L, Lee TK. DLC-1 is deleted in primary hepatocellular carcinoma and exerts
inhibitory effects on the proliferation of hepatoma cell lines with deleted DLC-1. Cancer Res.
2000; 60:6581–6584. [PubMed: 11118037]
Pang JC, Chang Q, Chung YF, Teo JG, Poon WS, Zhou LF, et al. Epigenetic inactivation of DLC-1 in
supratentorial primitive neuroectodermal tumor. Hum Pathol. 2005; 36:36–43. [PubMed:
15712180]
Ponting CP, Aravind L. START: a lipid-binding domain in StAR, HD-ZIP and signalling proteins.
Trends Biochem Sci. 1999; 24:130–132. [PubMed: 10322415]
Qiu GH, Tan LK, Loh KS, Lim CY, Srivastava G, Tsai ST, et al. The candidate tumor suppressor gene
BLU, located at the commonly deleted region 3p21.3, is an E2F–regulated, stress-responsive gene
and inactivated by both epigenetic and genetic mechanisms in nasopharyngeal carcinoma.
Oncogene. 2004; 23:4793–4806. [PubMed: 15122337]
Rhee I, Bachman KE, Park BH, Jair KW, Yen RW, Schuebel KE, et al. DNMT1 and DNMT3b
cooperate to silence genes in human cancer cells. Nature. 2002; 416:552–556. [PubMed:
11932749]
Sabbir MG, Wigle N, Loewen S, Gu Y, Buse C, Hicks GG, et al. Identification and characterization of
Dlc1 isoforms in the mouse and study of the biological function of a single gene trapped isoform.
BMC Biology. 2010; 8:17. [PubMed: 20199662]
Sekimata M, Kabuyama Y, Emori Y, Homma Y. Morphological changes and detachment of adherent
cells induced by p122, a GTPase-activating protein for Rho. J Biol Chem. 1999; 274:17757–
17762. [PubMed: 10364218]
Seng TJ, Low JSW, Li H, Cui Y, Goh HK, Wong MLY, et al. The major 8p22 tumor suppressor DLC1
is frequently silenced by methylation in both endemic and sporadic nasopharyngeal, esophageal,
and cervical carcinomas, and inhibits tumor cell colony formation. Oncogene. 2007; 26:934–944.
[PubMed: 16862168]
Small IF, Peeters NF, Legeai FF, Lurin C. Predotar: a tool for rapidly screening proteomes for N-
terminal targeting sequences. PROTEOMICS. 2004; 4:1581–1590. [PubMed: 15174128]
Takai D, Jones PA. Comprehensive analysis of CpG islands in human chromosomes 21 and 22. Proc
Natl Acad Sci USA. 2002; 99:3740–3745. [PubMed: 11891299]
Takai D, Jones PA. The CpG island searcher: a new WWW resource. In Silico Biol. 2003; 3:235–240.
[PubMed: 12954087]
Tao Q, Huang H, Geiman TM, Lim CY, Fu L, Qiu GH, et al. Defective de novo methylation of viral
and cellular DNA sequences in ICF syndrome cells. Hum Mol Genet. 2002; 11:2091–2102.
[PubMed: 12189161]
Tao Q, Robertson KD, Manns A, Hildesheim A, Ambinder RF. Epstein-Barr virus (EBV) in endemic
Burkitt’s lymphoma: molecular analysis of primary tumor tissue. Blood. 1998; 91:1373–1381.
[PubMed: 9454768]
Tao Q, Swinnen LJ, Yang J, Srivastava G, Robertson KD, Ambinder RF. Methylation status of the
Epstein-Barr virus major latent promoter C in iatrogenic B cell lymphoproliferative disease.
Application of PCR-based analysis. Am J Pathol. 1999; 155:619–625. [PubMed: 10433954]
Tcherkezian J, Lamarche-Vane N. Current knowledge of the large RhoGAP family of proteins. Biol
Cell. 2007; 99:67–86. [PubMed: 17222083]
Low et al. Page 12
Oncogene. Author manuscript; available in PMC 2012 June 28.
NIH-PAAuthorManuscriptNIH-PAAuthorManuscriptNIH-PAAuthorManuscript
13. Tsao SW, Wang X, Liu Y, Cheung YC, Feng H, Zheng Z, et al. Establishment of two immortalized
nasopharyngeal epithelial cell lines using SV40 large T and HPV16E6/E7 viral oncogenes.
Biochim Biophys Acta. 2002; 1590:150–158. [PubMed: 12063178]
Wong CM, Lee JM, Ching YP, Jin DY, Ng IO. Genetic and epigenetic alterations of DLC-1 gene in
hepatocellular carcinoma. Cancer Res. 2003; 63:7646–7651. [PubMed: 14633684]
Xu CF, Brown MA, Chambers JA, Griffiths B, Nicolai H, Solomon E. Distinct transcription start sites
generate two forms of BRCA1 mRNA. Hum Mol Genet. 1995; 4:2259–2264. [PubMed: 8634696]
Xue W, Krasnitz A, Lucito R, Sordella R, VanAelst L, Cordon-Cardo C, et al. The ITGB2
immunomodulatory gene (CD18), enterocolitis, and Hirschsprung’s disease. Genes &
Development. 2008; 22:1439–1444. [PubMed: 18519636]
Ying J, Li H, Seng TJ, Langford C, Srivastava G, Tsao SW, et al. Functional epigenetics identifies a
protocadherin PCDH10 as a candidate tumor suppressor for nasopharyngeal, esophageal and
multiple other carcinomas with frequent methylation. Oncogene. 2005a; 25:1070–1080. [PubMed:
16247458]
Ying J, Srivastava G, Hsieh WS, Gao Z, Murray P, Liao SK, et al. The stress-responsive gene
GADD45G is a functional tumor suppressor, with its response to environmental stresses frequently
disrupted epigenetically in multiple tumors. Clin Cancer Res. 2005b; 11:6442–6449. [PubMed:
16166418]
Yuan BZ, Durkin ME, Popescu NC. Promoter hypermethyla-tion of DLC-1, a candidate tumor
suppressor gene, in several common human cancers. Cancer Genet Cytogenet. 2003; 140:113–117.
[PubMed: 12645648]
Yuan BZ, Jefferson AM, Baldwin KT, Thorgeirsson SS, Popescu NC, Reynolds SH. DLC-1 operates
as a tumor suppressor gene in human non-small cell lung carcinomas. Oncogene. 2004; 23:1405–
1411. [PubMed: 14661059]
Yuan BZ, Jefferson AM, Millecchia L, Popescu NC, Reynolds SH. Morphological changes and
nuclear translocation of DLC1 tumor suppressor protein precede apoptosis in human non-small
cell lung carcinoma cells. Exp Cell Res. 2007; 313:3868–3880. [PubMed: 17888903]
Yuan BZ, Miller MJ, Keck CL, Zimonjic DB, Thorgeirsson SS, Popescu NC. Cloning,
characterization, and chromosomal localization of a gene frequently deleted in human liver cancer
(DLC-1) homologous to rat RhoGAP. Cancer Res. 1998; 58:2196–2199. [PubMed: 9605766]
Yutaka, Akiyama. TFSEARCH: searching transcription factor binding sites. 1995 Ref Type:
Unpublished Work.
Zhou X, Thorgeirsson SS, Popescu NC. Restoration of DLC-1 gene expression induces apoptosis and
inhibits both cell growth and tumorigenicity in human hepatocellular carcinoma cells. Oncogene.
2004; 23:1308–1313. [PubMed: 14647417]
Zhou X, Wang XW, Xu L, Hagiwara K, Nagashima M, Wolkowicz R, et al. COOH-terminal domain
of p53 modulates p53-mediated transcriptional transactivation, cell growth, and apoptosis. Cancer
Res. 1999; 59:843–848. [PubMed: 10029073]
Low et al. Page 13
Oncogene. Author manuscript; available in PMC 2012 June 28.
NIH-PAAuthorManuscriptNIH-PAAuthorManuscriptNIH-PAAuthorManuscript
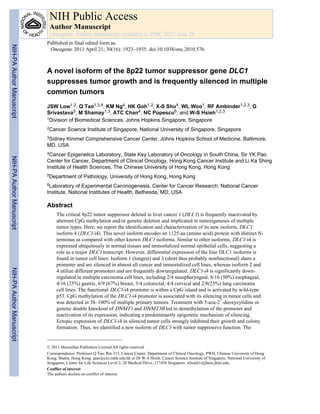
14. Figure 1.
mRNA expression, exon and protein structure of the various DLC1 isoforms and the CpG-
rich DLC1-i4 promoter. (a) Exon structure of the human DLC1 gene (not drawn to scale).
The DLC1 gene contains internal promoters and expresses multiple isoforms. Boxes
represent exons and are numbered to correspond to coding exons of the various DLC1
isoforms with the 5′-most exon denoted as exon 1 (exon 1 of isoforms 1 and 3). Closed
boxes indicate exons common in all DLC1 isoforms except isoform 3. Bent arrows indicate
the transcriptional start sites of the various DLC1 isoforms. Black, dotted, gray and dashed
lines indicate the splicing structure for isoform 1, 2, 3 and 4, respectively. Primer locations
Low et al. Page 14
Oncogene. Author manuscript; available in PMC 2012 June 28.
NIH-PAAuthorManuscriptNIH-PAAuthorManuscriptNIH-PAAuthorManuscript
15. are shown by short black arrows. (b) The CpG island promoter of DLC1-i4. Sequences of
the DLC1-i4 promoter, first exon and the locations of the BGS and MSP primers are shown.
The full first exon sequences as defined in GenBank are shown in caps. Transcriptional start
sites as determined by 5′-RLM RACE in liver and the SV40 T-antigen immortalized
nasopharyngeal epithelial cell line NP69 are marked with arrowheads. The translational start
site (ATG) is boxed and individual CpG dinucleotides are shown in bold caps. MSP primer
locations (DLC1-i4-M1/M2, U1/U2) are double underlined, whereas BGS primer locations
(DLC1-i4-BGS1/2) are underlined with thick lines. (c) DLC1 isoform protein structures (not
drawn to scale). The domain organization of all the DLC1 isoforms are shown with the
sterile α motif, serine-rich domain, NLS, RhoGAP and START domain highlighted. The
putative mitochondrial targeting sequence of DLC1-i4 is highlighted with a gray box. Name
and amino-acid lengths of each isoform are shown on the left and right respectively. Curved
bars denote coding exons. (d) Expression profile of all DLC1 isoforms in normal human
adult and fetal tissues as assessed by semi-quantitative RT–PCR. The house-keeping gene
GAPDH was used as a control. Underlined tissues were examined for DLC1-i4 silencing in
their corresponding tumor cell lines. S. muscle, skeletal muscle.
Low et al. Page 15
Oncogene. Author manuscript; available in PMC 2012 June 28.
NIH-PAAuthorManuscriptNIH-PAAuthorManuscriptNIH-PAAuthorManuscript
16. Figure 2.
Functional localization of the DLC1-i4 promoter. (a) Structure of the DLC1-i4 5′-promoter
region (Not drawn to scale). The enlarged diagram of the 5′ -promoter region of DLC1-i4 is
shown. Horizontal line represents the genomic sequence. Gray boxes with numbers below
indicate exons. The transcriptional start site is labeled with an arrow. Putative binding sites
of TP53, E2F, STATx and HSFs predicted by three different bioinformatics programs are
labeled. Thick black bar shows the location of the CpG island. (b) Localization of the
functional DLC1-i4 promoter using promoter luciferase assays. Promoter activities of three
constructs containing different regions of the putative DLC1-i4 promoter relative to the
promoter-less control vector using Luciferase assays are presented. Data shown are from
Low et al. Page 16
Oncogene. Author manuscript; available in PMC 2012 June 28.
NIH-PAAuthorManuscriptNIH-PAAuthorManuscriptNIH-PAAuthorManuscript
17. three independent Luciferase assays (±s.d) in three cell lines (HEK293, CNE2 and HK1).
Every one of the three different constructs of the DLC1-i4 promoter can drive the
transcription of the target gene in all cell lines tested. (c) DLC1-i4 promoter is p53-
responsive. The schematic diagram shows five putative p53-binding sites (BS) predicted by
bioinformatics on the DLC1-i4 promoter. DLC1-i4 promoter construct were transfected into
HEK293, CNE2 or HCT116/p53KO cell lines with (black bars) or without (shaded bars)
TP53 expression construct, and assayed for luciferase activity after 48 h. Results of
luciferase assays with respect to control pGL2 plasmid (open bars) in triplicates are shown
in the histograms. The respective promoter constructs are shown on the left. Values on all
histograms shown are the mean of three independent assays (±s.d). (d) Wild-type TP53, but
not mutant TP53 is able to transactivate DLC1-i4 promoter activity. Wild-type or mutant
p53 containing expression vectors were cotransfected with either DLC1-i4 promoter
construct (black bars) or pGL2-p21P (open bars) into the p53-null HCT116/p53KO cell line
for 48 h before luciferase activity was measured. Histograms show DLC1-i4 promoter
activity upregulated by wild-type, but not mutant p53. The p21 promoter construct was used
in parallel as a control for p53 transactivation. (e) TP53 upregulates DLC1-i4 promoter
activity in a dose-dependent manner. Upregulation of DLC1-i4 promoter activity was
observed with increasing amount of wild-type p53-expression vector. Increasing amount of
the wild-type p53-expression vector (1 ng to 1 µg) was cotransfected together with either
DLC1-i4 promoter construct (black bars) or pGL2-p21P (open bars) into HCT116/p53KO
cell line. A two-tailed paired Student’s t-test was performed to determine the statistical
differences between the increasing p53 concentrations. Enh, enhancer.
Low et al. Page 17
Oncogene. Author manuscript; available in PMC 2012 June 28.
NIH-PAAuthorManuscriptNIH-PAAuthorManuscriptNIH-PAAuthorManuscript
18. Figure 3.
Expression analysis of all DLC1 isoforms and DLC1-i4 promoter methylation in multiple
tumor cell lines and normal control. NPC, esophageal, gastric (GsCa), breast, colon,
cervical, lung and hepatocellular carcinoma cell lines; immortalized normal cell lines (NP69,
HEK293, RHEK1, NE1 and NE3), normal epithelial cell lines (HMEC and HMEpC) and
normal placenta tissue as controls. M, methylated; U, unmethylated. Fragment size indicated
on right of panels.
Low et al. Page 18
Oncogene. Author manuscript; available in PMC 2012 June 28.
NIH-PAAuthorManuscriptNIH-PAAuthorManuscriptNIH-PAAuthorManuscript
19. Figure 4.
DLC1-i4 is silenced by DNA methylation in carcinoma cell lines and demethylation by
pharmacological or genetic approach could induce DLC1-i4 reexpression. (a) Schematic
diagram of the location of 59 CpG dinucleotides along an 800 bp fragment encompassing
exon 1 on the 5′-promoter region of DLC1-i4. Vertical line represents one CpG site.
Locations of CpG sites 1–55 examined by high-resolution methylation analysis are
demarcated by the horizontal bracket. Arrow denotes the transcriptional start site and box
represents the first exon of DLC1-i4. Gray block arrows indicates location of MSP primers.
(b) High resolution mapping of individual CpG sites on the DLC1-i4 promoter in tumor and
normal cell lines as assessed by BGS. A 564 bp fragment of the core promoter containing 55
CpG sites was analyzed using dideoxynucleotide sequencing. CpG site is shown on top with
numbered ballooned arrows. Gray block arrows denote MSP primers location. Methylation
status of individual CpG site is expressed as percentage methylation calculated from 5–12
sequenced colonies. Number of clones sequenced, MSP and RT-PCR expression results are
shown on the right. (c) Demethylation by Aza restores DLC1-i4 expression in Aza-treated
NPC cell lines C666–1 and HK1 (day 3 (72 h) or day 6 (144 h)) with concomitant
demethylation of its promoter. (d) Reexpression of DLC1-i4 can only be mediated by Aza
alone (72 h) or combined with TSA (96 h). (e) Genetic double knockout of both DNMT1
and DNMT3B strongly induces DLC1-i4 promoter demethylation and mRNA expression.
Low et al. Page 19
Oncogene. Author manuscript; available in PMC 2012 June 28.
NIH-PAAuthorManuscriptNIH-PAAuthorManuscriptNIH-PAAuthorManuscript
20. (f) High-resolution methylation mapping of 55 CpG sites in a 564 bp region of the DLC1-i4
promoter by BGS confirmed the genetic demethylation in HCT116-DKO. Horizontal line
represents the DLC1-i4 promoter region with short vertical lines representing each CpG site
analyzed. Percentage methylation was established as total percentage of methylated
cytosines from 5–12 randomly sequenced colonies. Numbers of clones sequenced, MSP and
RT-PCR expression results are shown on the right. The locations of MSP primers are
indicated by thick gray arrows. M, methylated; U, unmethylated. +, expressed; −, silenced.
Low et al. Page 20
Oncogene. Author manuscript; available in PMC 2012 June 28.
NIH-PAAuthorManuscriptNIH-PAAuthorManuscriptNIH-PAAuthorManuscript
21. Figure 5.
Promoter methylation of DLC1-i4 in multiple primary carcinomas. Representative MSP data
showing methylation of DLC1-i4 in multiple primary tumors but not in normal nasopharynx
and matched tissues. (a) Normal nasopharynx tissues as controls and primary NPC tumors
from Asians. (b) Expression of DLC1-i4 and MSP in a subset of primary NPC tumors. (c)
Methylation in multiple primary carcinomas. (d) DLC1-i4 expression in matched breast
primary tumor and normal tissue pair. M, methylated; U, unmethylated; N, paired surgical
marginal tissues; T, tumor tissues.
Low et al. Page 21
Oncogene. Author manuscript; available in PMC 2012 June 28.
NIH-PAAuthorManuscriptNIH-PAAuthorManuscriptNIH-PAAuthorManuscript
22. Figure 6.
Ectopic expression of DLC1-i4 suppresses clonogenicity of carcinoma cells. (a) Colorectal
carcinoma (HCT116) and esophageal carcinoma (KYSE510) cell lines were transfected with
pcDNA3.1(+) vector alone, pcDNA3.1(+)DLC1-i4 or pcDNA3.1(+)TP53 and selected with
G418. DLC1-i4 and TP53 greatly inhibited clonogenicity of tumor cells. Control cells
without vector would not survive G418 selection. (b) Quantitative analyses of colony
numbers of HCT116, KYSE510 and NPC cell line HK1. Number of G418-resistant colonies
in vector-only transfected cell line were set as 100%. Values are the mean±s.e. from three
independent experiments. Asterisk indicates statistically significant difference (**P<0.001).
Low et al. Page 22
Oncogene. Author manuscript; available in PMC 2012 June 28.
NIH-PAAuthorManuscriptNIH-PAAuthorManuscriptNIH-PAAuthorManuscript