A simple overview to retail direct & in direct purchases spend analysis in 7 simple steps
•
0 likes•116 views

A simple overview to retail direct & in direct purchases spend analysis in 7 simple steps

Recommended
Recommended
More Related Content
What's hot
What's hot (19)
Similar to A simple overview to retail direct & in direct purchases spend analysis in 7 simple steps
Similar to A simple overview to retail direct & in direct purchases spend analysis in 7 simple steps (20)
Recently uploaded
Recently uploaded (9)
A simple overview to retail direct & in direct purchases spend analysis in 7 simple steps
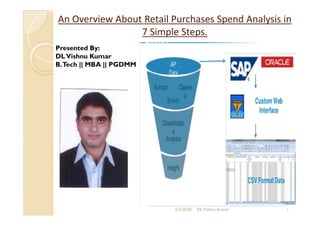
- 1. An Overview About Retail Purchases Spend Analysis inAn Overview About Retail Purchases Spend Analysis in 7 Simple Steps.7 Simple Steps. Presented By: DLVishnu Kumar B.Tech || MBA || PGDMM 6/3/2020 DLVishnu Kumar 1
- 2. S. No Topics Page No 1 What is Spend Analysis 3 2 Why do we need Spend Analysis 4 3 Spend Cube 4 4 Spend Analysis Tools 4 5 Types of Spend 5 6/3/2020 DLVishnu Kumar 2 6 Types of Data Sources 5 7 Types of Categorisation 5 8 Outline of Spend Analysis 5 9 Common types of Spend Analysis 6 10 Retail Purchase Spend Analysis in 7 Simple Steps 7 11 Example for Retail Purchases Spend Analysis 8
- 3. What is Spend AnalysisWhat is Spend Analysis Spend Analysis is the process of aggregating, classifying, leveraging spend data for the purpose of cost reduction, performance improvement, and greater compliance. Spend analysis is important as it is the first step in the identification of possible savings opportunities. It is part of the spend management process, which includes the analysis, award, tracking of corporate spend, the first & last step of strategic sourcing process. Spend management is important because it is the only way to insure capture the savings after negotiating & one of the best ways to insure compliance with relevant regulations. 6/3/2020 DLVishnu Kumar 3
- 4. Why do we need Spend AnalysisWhy do we need Spend Analysis •Greater Visibility: Tracks every $ spent across multiple categories including Indirect spending. •Improve Relationships: Improves 360 degree relationships with Suppliers, Customers, stakeholders. •Identify areas of Opportunity: Fetches insights from company’s past historical spending & create savings opportunities. •Increase Productivity & Efficiency: Focuses more on key deliverables. •Better Decision Making: Make fact based decisions with data made available thru systems. Finally all the points results in Lower Overall Costs which contributes to company’s bottom line savings. SpendSpend CubeCube 6/3/2020 DLVishnu Kumar 4 SpendSpend CubeCube Spend Analysis should help company in 3 decision making dimensions. 1. What are we buying? 2. From who are we buying? 3. For who are we buying? Spend Analysis ToolsSpend Analysis Tools 1. SAP ARIBA 2. ZYCUS 3. Accenture Procurian 4. I2 Technologies 5. Bravo Solutions.
- 5. Types of SpendTypes of Spend Direct Spend: Spend on Goods & Merchandises that directly influences the product sales which company is selling. Example: •Commodities(Grocery Staples etc.) •Parts & Sub Assemblies. Indirect Spend: Spend on Goods & Services, that enables or supports primary sales. Example: •Travel, Stationary. •IT, Capital Goods, •MRO & Utilities, •Car Rentals, Books & Subscriptions Tail Spend: The Bottom 10% of Indirect Spend is known as Tail Spend. Example: •One off purchases that fall below a certain threshold (say $10K). •Purchasing done at plant level by internal departments 6/3/2020 DLVishnu Kumar 5 Types of DataTypes of Data SourcesSources A. Accounts Payable: Contains 95% of company’s spending data. Also like G/L, PO, etc. B. Other Sources: 1. Internal (Invoices, HR data). 2. External (Supplier Spend, Data in Public Domain like Internet). Types of CategorizationTypes of Categorization 1. UNSPSC 2. FSC 3. NAICS 4. NIC 5. Company Own/Inbuilt Category. Outline of Spend AnalysisOutline of Spend Analysis Spend Analysis Helps in tracking benefits like, drives PO compliance & Cost Recovery & Minimize Leakage & helps Finance & Budgeting Team in Projecting Future Cash Flows.
- 6. Cost per unit weight Analysis: Performed to compare similar parts/products & cost/unit should be similar. This is helpful to understand layers/internal parts of a product which contributes to different costs. Part price history Analysis: Plotting trend of a part/commodity price over 2 years & identify opportunities to renegotiate lower prices in case of unjustified price increase in the past. Pricing Brackets/ EOQ Analysis: Identifies optimum bracket quantity or EOQ/MBQ within available brackets. Can only be applicable on parts/products/commodities that have running contracts that contains pricing brackets. Indexed Pricing Analysis: Identifies relationship between material prices & part cost & helps to identify opportunities for index based pricing & renegotiation. Currency Opportunity Analysis: Identifies cost reduction opportunity by switching prices between currencies. This believes in assumption that manufacturer should be paid in the local currency of manufacturing country. Common Types Of Spend Analysis 6/3/2020 DLVishnu Kumar 6 Freight Analysis: A way to obtain visibility in to freight costs associated with procuring goods from suppliers. This focuses on selecting a best approach to optimise freight costs. VAT Analysis: VAT is a tax that is accessed at each phase of the process where value is added to raw materials or components or services by different suppliers. It is usually recovered when a supplier sells his product to the next supplier in the chain. VAT Leakage can some times occur when trying to recover VAT from foreign suppliers. Warranty Cost Recovery: This incurs due to defective products from suppliers. This includes both labor costs & product & sub product costs. Payment Terms Analysis: Identifies deviation to standard payment terms. Intention is to negotiate with suppliers to pay them on standard terms so that savings can be realised from holding cash. Part Family Analysis: Optimum way of categorizing parts into a family & identifies cost outliers within same part & potential parts for cost reduction which don’t belong to same parts family due to different processes.
- 7. Retail Purchase Spend Analysis in 7 Simple StepsRetail Purchase Spend Analysis in 7 Simple Steps A spend analysis allows to remove traditional roadblocks to spend management & gains insight into operational ineffectiveness which is important in order to improve company’s sourcing success. There are a total of the 7 steps mandatory to conducting a proper spend analysis.They are as follows. 1. Identify:All the existing sources available for company’s spend data, from all the internal departments, plants & business units.This includes AP, general ledger, Pcard, petty cash bills, procurement systems(ARIBA, ZYCUS),etc. Mostly the spend data dump can be requested from the Finance department. 2. Gather:Consolidating all spend data into one central database.This can be difficult if data is in different formats/ERP, different languages & different currencies, However there are programs like MS EXCEL etc., which can be imported & available specifically designed to perform this task. 3. Cleanse: It means spotting & correcting errors in descriptions & transactions, as well as standardizing the spend data for easy viewing like aligning, bordering etc.for easy viewing like aligning, bordering etc. 4. Group: Grouping suppliers for better supplier management. Purchases made from Parle Group, Parle Agro, or Parle Foods should all be grouped together, since they’re the same supplier.Also called as Supplier Normalisation. 5. Categorise:Whether using UNSPSC,own company-specific categories, it needs to be able to determine where company’s money is being spent/exhausted.Examples for Indirect purchases includes stationary, marketing, travel, legal, IT etc. & for direct purchases includes retail FMCG products like Grocery, Hair-Personal Care etc must be categorised appropriately. 6. Analyse: It means analysing paid invoices spend values. Ensuring that negotiated best contract deals per supplier now that all of ongoing company’s spend is identified per supplier & all of company’s retail buyers are purchasing from preferred /contracted suppliers. Reduce the number of suppliers per category. 7. Repeat: Performing once a spend analysis is a good start to identifying savings, however this process needs to continually updating for ongoing data to ensure that contract terms are being adhered to & buyers are purchasing from preferred suppliers & that savings opportunities are being identified.
- 8. Example for Retail Purchases Spend AnalysisExample for Retail Purchases Spend Analysis 1. Gather all the paid invoices supplier wise data from the Accounts Payable Dept . 2. Select the column Supplier and go to SHEET 2 & perform paste special values. 6/3/2020 DLVishnu Kumar 8
- 9. Example for Retail Purchases Spend AnalysisExample for Retail Purchases Spend Analysis 6/3/2020 DLVishnu Kumar 9 1. Remove all duplicate values as per above screen shots from supplier column.
- 10. Example for Retail Purchases Spend AnalysisExample for Retail Purchases Spend Analysis 1. Create a new column with name Category in SHEET2 & put all suppliers with category head name as per above screen shots. 6/3/2020 DLVishnu Kumar 10
- 11. Example for Retail Purchases Spend AnalysisExample for Retail Purchases Spend Analysis 1. Go to SHEET 1 & create a new column with name Category & use formula VLOOKUP to pull data from SHEET 2 as per screen shot. 6/3/2020 DLVishnu Kumar 11
- 12. Example for Retail Purchases Spend AnalysisExample for Retail Purchases Spend Analysis 1. Now the data in SHEET 1 is ready with required data. Check for consistency in formulaVLOOKUP as per screen shot. 6/3/2020 DLVishnu Kumar 12
- 13. Example for Retail Purchases Spend AnalysisExample for Retail Purchases Spend Analysis 1. Now select the table from SHEET1 & create PIVOT table as per screen shot. 2. Select on New Work sheet & press OK. 6/3/2020 DLVishnu Kumar 13
- 14. Example for Retail Purchases Spend AnalysisExample for Retail Purchases Spend Analysis 1. Now select the table from SHEET1 & create PIVOT table as per screen shot. 2. Select on NewWork 6/3/2020 DLVishnu Kumar 14 NewWork sheet & press OK. 3. Now we can compare Total Spend value from SHEET 2 & SHEET 1 as values 40,32,200 are equal.
- 15. Example for Retail Purchases Spend AnalysisExample for Retail Purchases Spend Analysis 1. Now select the table except grand values & go to Insert Menu & select Pie Chart Option in SHEET 4. 2. Select 2D Pie 1st chart & click 6/3/2020 DLVishnu Kumar 15 1st chart & click on OK.
- 16. Example for Retail Purchases Spend AnalysisExample for Retail Purchases Spend Analysis 1. Now right click on PIE CHART & select option ADD DATA LABELS in SHEET 4. 2. Finally this is our SPEND DATA for each CATEGORY 6/3/2020 DLVishnu Kumar 16 CATEGORY wise. 3. FOOD category has highest spend value followed by BEVERAGES category & so on.
- 17. Example for Retail Purchases Spend AnalysisExample for Retail Purchases Spend Analysis 1. Now that we don’t require PIE CHART, we can delete it in SHEET 4. 2. We can also prepare PIVOTTABLE for analysing SPENDVALUE 6/3/2020 DLVishnu Kumar 17 SPENDVALUE in terms of Supplier wise. 3. Here FOOD category has highest spend value, so it can be analysed which food suppliers with highest invoice values.
- 18. For Your Valuable 6/3/2020 DLVishnu Kumar 18 Time & Patience