SlideShare a Scribd company logo
1 of 11
Download to read offline
Turbo Tech 103 (Expert)
This article is a bit more involved and will describe parts of the compressor map, how to estimate pressure ratio
and mass flow rate for your engine, and how to plot the points on the maps to help choose the right
turbocharger. Have your calculator handy!!
1 Parts of the Compressor Map:
◊ The compressor map is a graph that describes a particular compressor’s performance characteristics, including
efficiency, mass flow range, boost pressure capability, and turbo speed. Shown below is a figure that identifies
aspects of a typical compressor map:
◊ Pressure Ratio
• Pressure Ratio ( ) is defined as the Absolute outlet pressure divided by the Absolute inlet pressure.
Where:
o = Pressure Ratio
o P2c = Compressor
o Discharge Pressure
o P1c = Compressor Inlet Pressure
• It is important to use units of Absolute Pressure for both P1c and P2c. Remember that Absolute
Pressure at sea level is 14.7 psia (in units of psia, the a refers to “absolute”). This is referred to as standard
atmospheric pressure at standard conditions.
• Gauge Pressure (in units of psig, the g refers to “gauge”) measures the pressure above atmospheric,
so a gauge pressure reading at atmospheric conditions will read zero. Boost gauges measure the manifold
pressure relative to atmospheric pressure, and thus are measuring Gauge Pressure. This is important when
determining P2c. For example, a reading of 12 psig on a boost gauge means that the air pressure in the
manifold is 12 psi above atmospheric pressure. For a day at standard atmospheric conditions,
12 psig + 14.7 psia = 26.7 psi absolute pressure in the manifold
• The pressure ratio at this condition can now be calculated:
26.7 psia / 14.7 psia = 1.82
• However, this assumes there is no adverse impact of the air filter assembly at the compressor inlet.
• In determining pressure ratio, the absolute pressure at the compressor inlet (P2c) is often LESS than the
ambient pressure, especially at high load. Why is this? Any restriction (caused by the air filter or restrictive
ducting) will result in a “depression,” or pressure loss, upstream of the compressor that needs to be accounted
for when determining pressure ratio. This depression can be 1 psig or more on some intake systems. In this
case P1c on a standard day is:
14.7psia – 1 psig = 13.7 psia at compressor inlet
• Taking into account the 1 psig intake depression, the pressure ratio is now:
(12 psig + 14.7 psia) / 13.7 psia = 1.95.
• That’s great, but what if you’re not at sea level? In this case, simply substitute the actual atmospheric
pressure in place of the 14.7 psi in the equations above to give a more accurate calculation. At higher
elevations, this can have a significant effect on pressure ratio.
For example, at Denver’s 5000 feet elevation, the atmospheric pressure is typically around 12.4 psia. In this
case, the pressure ratio calculation, taking into account the intake depression, is:
(12 psig + 12.4 psia) / (12.4 psia – 1 psig) = 2.14
Compared to the 1.82 pressure ratio calculated originally, this is a big difference.
• As you can see in the above examples, pressure ratio depends on a lot more than just boost.
◊ Mass Flow Rate
• Mass Flow Rate is the mass of air flowing through a compressor (and engine!) over a given period of
time and is commonly expressed as lb/min (pounds per minute). Mass flow can be physically measured, but in
many cases it is sufficient to estimate the mass flow for choosing the proper turbo.
• Many people use Volumetric Flow Rate (expressed in cubic feet per minute, CFM or ft3
/min) instead of
mass flow rate. Volumetric flow rate can be converted to mass flow by multiplying by the air density. Air
density at sea level is 0.076lb/ft3
• What is my mass flow rate? As a very general rule, turbocharged gasoline engines will generate 9.5-
10.5 horsepower (as measured at the flywheel) for each lb/min of airflow. So, an engine with a target peak
horsepower of 400 Hp will require 36-44 lb/min of airflow to achieve that target. This is just a rough first
approximation to help narrow the turbo selection options.
◊ Surge Line
• Surge is the left hand boundary of the compressor map. Operation to the left of this line represents a
region of flow instability. This region is characterized by mild flutter to wildly fluctuating boost and “barking”
from the compressor. Continued operation within this region can lead to premature turbo failure due to heavy
thrust loading.
• Surge is most commonly experienced when one of two situations exist. The first and most damaging is
surge under load. It can be an indication that your compressor is too large. Surge is also commonly
experienced when the throttle is quickly closed after boosting. This occurs because mass flow is drastically
reduced as the throttle is closed, but the turbo is still spinning and generating boost. This immediately drives
the operating point to the far left of the compressor map, right into surge.
Surge will decay once the turbo speed finally slows enough to reduce the boost and move the operating point
back into the stable region. This situation is commonly addressed by using a Blow-Off Valves (BOV) or bypass
valve. A BOV functions to vent intake pressure to atmosphere so that the mass flow ramps down smoothly,
keeping the compressor out of surge. In the case of a recirculating bypass valve, the airflow is recirculated
back to the compressor inlet.
• A Ported Shroud compressor (see Fig. 2) is a feature that is incorporated into the compressor housing.
It functions to move the surge line further to the left (see Fig. 3) by allowing some airflow to exit the wheel
through the port to keep surge from occurring. This provides additional useable range and allows a larger
compressor to be used for higher flow requirements without risking running the compressor into a dangerous
surge condition. The presence of the ported shroud usually has a minor negative impact on compressor
efficiency.
Fig. 2 Fig. 3
◊ The Choke Line is the right hand boundary of the compressor map. For Garrett maps, the choke line is
typically defined by the point where the efficiency drops below 58%. In addition to the rapid drop of compressor
efficiency past this point, the turbo speed will also be approaching or exceeding the allowable limit. If your actual
or predicted operation is beyond this limit, a larger compressor is necessary.
◊ Turbo Speed Lines are lines of constant turbo speed. Turbo speed for points between these lines can be
estimated by interpolation. As turbo speed increases, the pressure ratio increases and/or mass flow increases. As
indicated above in the choke line description, the turbo speed lines are very close together at the far right edge
of the map. Once a compressor is operating past the choke limit, turbo speed increases very quickly and a turbo
over-speed condition is very likely.
◊ Efficiency Islands are concentric regions on the maps that represent the compressor efficiency at any point
on the map. The smallest island near the center of the map is the highest or peak efficiency island. As the rings
move out from there, the efficiency drops by the indicated amount until the surge and choke limits are reached.
2. Plotting Your Data on the Compressor Map
In this section, methods to calculate mass flow rate and boost pressure required to meet a horsepower target are
presented. This data will then be used to choose the appropriate compressor and turbocharger. Having a
horsepower target in mind is a vital part of the process. In addition to being necessary for calculating mass flow
and boost pressure, a horsepower target is required for choosing the right fuel injectors, fuel pump and regulator,
and other engine components.
◊ Estimating Required Air Mass Flow and Boost Pressures to reach a Horsepower target.
· Things you need to know:
· Horsepower Target
· Engine displacement
· Maximum RPM
· Ambient conditions (temperature and barometric pressure. Barometric pressure is usually given as inches
of mercury and can be converted to psi by dividing by 2)
· Things you need to estimate:
· Engine Volumetric Efficiency. Typical numbers for peak Volumetric Efficiency (VE) range in the 95%-99% for
modern 4-valve heads, to 88% - 95% for 2-valve designs. If you have a torque curve for your engine, you can
use this to estimate VE at various engine speeds. On a well-tuned engine, the VE will peak at the torque peak,
and this number can be used to scale the VE at other engine speeds. A 4-valve engine will typically have higher
VE over more of its rev range than a two-valve engine.
· Intake Manifold Temperature. Compressors with higher efficiency give lower manifold temperatures.
Manifold temperatures of intercooled setups are typically 100 - 130 degrees F, while non-intercooled values can
reach from 175-300 degrees F.
· Brake Specific Fuel Consumption (BSFC). BSFC describes the fuel flow rate required to generate each
horsepower. General values of BSFC for turbocharged gasoline engines range from 0.50 to 0.60 and higher. The
units of BSFC are
Lower BSFC means that the engine requires less fuel to generate a given horsepower. Race fuels and aggressive
tuning are required to reach the low end of the BSFC range described above.
For the equations below, we will divide BSFC by 60 to convert from hours to minutes.
To plot the compressor operating point, first calculate airflow:
Where:
· Wa = Airflowactual (lb/min)
· HP = Horsepower Target (flywheel)
· = Air/Fuel Ratio
· = Brake Specific Fuel Consumption ( ) ÷ 60 (to convert from hours to minutes)
EXAMPLE:
I have an engine that I would like to use to make 400Hp, I want to choose an air/fuel ratio of 12 and use a BSFC
of 0.55. Plugging these numbers into the formula from above:
of air.
Thus, a compressor map that has the capability of at least 44 pounds per minute of airflow capacity is a good
starting point.
Note that nowhere in this calculation did we enter any engine displacement or RPM numbers. This means that for
any engine, in order to make 400 Hp, it needs to flow about 44 lb/min (this assumes that BSFC remains constant
across all engine types).
Naturally, a smaller displacement engine will require more boost or higher engine speed to meet this target than
a larger engine will. So how much boost pressure would be required?
◊ Calculate required manifold pressure required to meet the horsepower, or flow target:
Where:
· MAPreq = Manifold Absolute Pressure (psia) required to meet the horsepower target
· Wa = Airflowactual(lb/min)
· R = Gas Constant = 639.6
· Tm = Intake Manifold Temperature (degrees F)
· VE = Volumetric Efficiency
· N = Engine speed (RPM)
· Vd = engine displacement (Cubic Inches, convert from liters to CI by multiplying by 61.02, ex. 2.0 liters *
61.02 = 122 CI)
EXAMPLE:
To continue the example above, let’s consider a 2.0 liter engine with the following description:
· Wa = 44 lb/min as previously calculated
· Tm = 130 degrees F
· VE = 92% at peak power
· N = 7200 RPM
· Vd = 2.0 liters * 61.02 = 122 CI
= 41.1 psia (remember, this is absolute pressure. Subtract atmospheric pressure to get gauge pressure (aka
boost):
41.1 psia – 14.7 psia (at sea level) = 26.4 psig boost
As a comparison let’s repeat the calculation for a larger displacement 5.0L (4942 cc/302 CI) engine.
Where:
· Wa = 44 lb/min as previously calculated
· Tm = 130 degrees F
· VE = 85% at peak power (it is a pushrod V-8)
· N = 6000 RPM
· Vd = 4.942*61.02= 302 CI
= 21.6 psia (or 6.9 psig boost)
This example illustrates in order to reach the horsepower target of 400 hp, a larger engine requires lower
manifold pressure but still needs 44lb/min of airflow. This can have a very significant effect on choosing the
correct compressor.
With Mass Flow and Manifold Pressure, we are nearly ready to plot the data on the compressor map. The next
step is to determine how much pressure loss exists between the compressor and the manifold. The best way to
do this is to measure the pressure drop with a data acquisition system, but many times that is not practical.
Depending upon flow rate, charge air cooler characteristics, piping size, number/quality of the bends, throttle
body restriction, etc., the plumbing pressure drop can be estimated. This can be 1 psi or less for a very well
designed system. On certain restrictive OEM setups, especially those that have now higher-than-stock airflow
levels, the pressure drop can be 4 psi or greater.
For our examples we will assume that there is a 2 psi loss. So to determine the Compressor Discharge Pressure
(P2c), 2 psi will be added to the manifold pressure calculated above.
Where:
· P2c = Compressor Discharge Pressure (psia)
· MAP = Manifold Absolute Pressure (psia)
· ∆Ploss = Pressure Loss Between the Compressor and the Manifold (psi)
For the 2.0 L engine:
= 43.1 psia
For the 5.0 L engine:
= 23.6 psia
Remember our discussion on inlet depression in the Pressure Ratio discussion earlier, we said that a typical value
might be 1 psi, so that is what will be used in this calculation. For this example, assume that we are at sea level,
so ambient pressure is 14.7 psia.
We will need to subtract the 1 psi pressure loss from the ambient pressure to determine the Compressor Inlet
Pressure (P1).
Where:
· P1c = Compressor Inlet Pressure (psia)
· Pamb = Ambient Air pressure (psia)
· ∆Ploss = Pressure Loss due to Air Filter/Piping (psi)
P1c = 14.7 - 1
= 13.7 psia
With this, we can calculate Pressure Ratio ( ) using the equation.
For the 2.0 L engine:
= 3.14
For the 5.0 L engine:
= 1.72
We now have enough information to plot these operating points on the compressor map. First we will try a
GT2860RS. This turbo has a 60mm, 60 trim compressor wheel.
Clearly this compressor is too small, as both points are positioned far to the right and beyond the compressor’s
choke line.
Another potential candidate might be the GT3076R. This turbo has a 76mm, 56 trim compressor wheel:
This is much better; at least both points are on the map! Let’s look at each point in more detail.
For the 2.0L engine this point is in a very efficient area of the map, but since it is in the center of the map, there
would be a concern that at a lower engine speeds that it would be near or over the surge line. This might be ok
for a high-rpm-biased powerband that might be used on a racing application, but a street application would be
better served by a different compressor.
For the 5.0L engine, this looks like a very good street-biased powerband, with the lower engine speeds passing
through the highest efficiency zone on the map, and plenty of margin to stay clear of surge. One area of concern
would be turbo overspeed when revving the engine past peak power. A larger compressor would place the
operating point nearer to the center of the map and would give some additional benefit to a high-rpm-biased
powerband. We’ll look at a larger compressor for the 5.0L after we figure out a good street match for the 2.0L
engine.
So now lets look at a GT3071R, which uses a 71mm, 56 trim compressor wheel.
For the 2.0L engine, this is a much more mid-range-oriented compressor. The operating point is shifted a bit
towards the choke side of the map and this provides additional surge margin. The lower engine speeds will now
pass through the higher efficiency zones and give excellent performance and response.
For the 5.0L engine, the compressor is clearly too small and would not be considered.
Now that we have arrived at an acceptable compressor for the 2.0L engine, lets calculate a lower rpm point to
put on the map to better get a feel for what the engine operating line will look like. We can calculate this using
the following formula:
We’ll choose the engine speed at which we would expect to see peak torque, based on experience or an educated
guess. In this case we’ll choose 5000rpm.
Where:
· Wa = Airflowactual (lb/min)
· MAP = Manifold Absolute Pressure (psia) =35.1 psia
· R = Gas Constant = 639.6
· Tm = Intake Manifold Temperature (degrees F) =130
· VE = Volumetric Efficiency = 0.98
· N = Engine speed (RPM) = 5000rpm
· Vd = engine displacement (Cubic Inches, convert from liters to CI by multiplying by 61, ex. 2.0 liters * 61 =
122 CI)
= 34.1 lb/min
Plotting this on the GT3071R compressor map gives the following operating points.
This gives a good representation of the operating line at that boost level, which is well suited to this map. At
engine speeds lower than 5000rpm the boost pressure will be lower, and the pressure ratio would be lower, to
keep the compressor out of surge.
Back to the 5.0 L engine. Let’s look at a larger compressor’s map. This time we will try a GT3582R with an
82mm, 56 trim compressor.
Here , compared to the GT3076R, we can see that this point is not quite so deep into choke and will give better
high-rpm performance than the 76mm wheel. A further increase in wheel size would give even better high-rpm
performance, but at the cost of low- and mid-range response and drivability.
Hopefully this has given a basic idea of what a compressor map displays and how to choose a compressor. As you
can see, a few simple estimations and calculations can provide a good basis for compressor selection. If real data
is available to be substituted in place of estimation, more accurate results can be generated.

More Related Content

Similar to Turbo Tech 103.pdf

RECIPROCATING_COMPRESSOR.pptx
RECIPROCATING_COMPRESSOR.pptxRECIPROCATING_COMPRESSOR.pptx
RECIPROCATING_COMPRESSOR.pptxPrabhaChand2
 
Step by-step compsressor Selection and sizing
Step by-step compsressor Selection and sizingStep by-step compsressor Selection and sizing
Step by-step compsressor Selection and sizingtantoy13
 
lecture of turbomachine in engineering.pptx
lecture of turbomachine in engineering.pptxlecture of turbomachine in engineering.pptx
lecture of turbomachine in engineering.pptxBfhfHdhg
 
Reciprocating Compressors.pdf
Reciprocating Compressors.pdfReciprocating Compressors.pdf
Reciprocating Compressors.pdfDWNLDUSRML
 
ProjectreportMMC_16101_compressor_01.pdf
ProjectreportMMC_16101_compressor_01.pdfProjectreportMMC_16101_compressor_01.pdf
ProjectreportMMC_16101_compressor_01.pdfpk500138
 
Guofu_Chen_Optimize Design and Operation of Renewable Energy Cycle through As...
Guofu_Chen_Optimize Design and Operation of Renewable Energy Cycle through As...Guofu_Chen_Optimize Design and Operation of Renewable Energy Cycle through As...
Guofu_Chen_Optimize Design and Operation of Renewable Energy Cycle through As...Guofu Chen
 
Variable Speed Drives for Gas compressor Operations
Variable Speed Drives for Gas compressor OperationsVariable Speed Drives for Gas compressor Operations
Variable Speed Drives for Gas compressor OperationsVijay Sarathy
 
Compressors system Designing 919825024651
Compressors system Designing 919825024651Compressors system Designing 919825024651
Compressors system Designing 919825024651Sdsplit Split
 
391861703-Mod-5-Fan-Measurement-and-Testing.pdf
391861703-Mod-5-Fan-Measurement-and-Testing.pdf391861703-Mod-5-Fan-Measurement-and-Testing.pdf
391861703-Mod-5-Fan-Measurement-and-Testing.pdfBlentBulut5
 
Anti surge control
Anti surge controlAnti surge control
Anti surge controlachueth
 
5916964.ppt
5916964.ppt5916964.ppt
5916964.pptM. Nazir
 
Day One Review.pptx
Day One Review.pptxDay One Review.pptx
Day One Review.pptxmusaabdalla3
 
Turbocharging and its off-highway apps.
Turbocharging and its off-highway apps.Turbocharging and its off-highway apps.
Turbocharging and its off-highway apps.ANKIT VENKAT AMMU
 

Similar to Turbo Tech 103.pdf (20)

RECIPROCATING_COMPRESSOR.pptx
RECIPROCATING_COMPRESSOR.pptxRECIPROCATING_COMPRESSOR.pptx
RECIPROCATING_COMPRESSOR.pptx
 
Step by-step compsressor Selection and sizing
Step by-step compsressor Selection and sizingStep by-step compsressor Selection and sizing
Step by-step compsressor Selection and sizing
 
Hydraulic pumps performance and Characteristics
Hydraulic pumps performance and CharacteristicsHydraulic pumps performance and Characteristics
Hydraulic pumps performance and Characteristics
 
lecture of turbomachine in engineering.pptx
lecture of turbomachine in engineering.pptxlecture of turbomachine in engineering.pptx
lecture of turbomachine in engineering.pptx
 
Reciprocating Compressors.pdf
Reciprocating Compressors.pdfReciprocating Compressors.pdf
Reciprocating Compressors.pdf
 
ProjectreportMMC_16101_compressor_01.pdf
ProjectreportMMC_16101_compressor_01.pdfProjectreportMMC_16101_compressor_01.pdf
ProjectreportMMC_16101_compressor_01.pdf
 
Guofu_Chen_Optimize Design and Operation of Renewable Energy Cycle through As...
Guofu_Chen_Optimize Design and Operation of Renewable Energy Cycle through As...Guofu_Chen_Optimize Design and Operation of Renewable Energy Cycle through As...
Guofu_Chen_Optimize Design and Operation of Renewable Energy Cycle through As...
 
Variable Speed Drives for Gas compressor Operations
Variable Speed Drives for Gas compressor OperationsVariable Speed Drives for Gas compressor Operations
Variable Speed Drives for Gas compressor Operations
 
Compressor final
Compressor finalCompressor final
Compressor final
 
Compressors system Designing 919825024651
Compressors system Designing 919825024651Compressors system Designing 919825024651
Compressors system Designing 919825024651
 
Compressor final
Compressor finalCompressor final
Compressor final
 
391861703-Mod-5-Fan-Measurement-and-Testing.pdf
391861703-Mod-5-Fan-Measurement-and-Testing.pdf391861703-Mod-5-Fan-Measurement-and-Testing.pdf
391861703-Mod-5-Fan-Measurement-and-Testing.pdf
 
Anti surge control
Anti surge controlAnti surge control
Anti surge control
 
5916964.ppt
5916964.ppt5916964.ppt
5916964.ppt
 
Centrifugal pump sizing tutorial
Centrifugal pump sizing   tutorialCentrifugal pump sizing   tutorial
Centrifugal pump sizing tutorial
 
Day One Review.pptx
Day One Review.pptxDay One Review.pptx
Day One Review.pptx
 
Preliminary selection of centrifugal compressor
Preliminary selection of centrifugal compressorPreliminary selection of centrifugal compressor
Preliminary selection of centrifugal compressor
 
Turbocharging and its off-highway apps.
Turbocharging and its off-highway apps.Turbocharging and its off-highway apps.
Turbocharging and its off-highway apps.
 
COMPRESSORS-FINAL.ppt
COMPRESSORS-FINAL.pptCOMPRESSORS-FINAL.ppt
COMPRESSORS-FINAL.ppt
 
Compressors
CompressorsCompressors
Compressors
 

More from VishalSharma425143

More from VishalSharma425143 (7)

cargo pumping schematic diag.pdf
cargo pumping schematic diag.pdfcargo pumping schematic diag.pdf
cargo pumping schematic diag.pdf
 
CARGO OIL PUMPING SYSTEM.pdf
CARGO OIL PUMPING SYSTEM.pdfCARGO OIL PUMPING SYSTEM.pdf
CARGO OIL PUMPING SYSTEM.pdf
 
CARGO OIL PUMPING SYSTEM.pdf
CARGO OIL PUMPING SYSTEM.pdfCARGO OIL PUMPING SYSTEM.pdf
CARGO OIL PUMPING SYSTEM.pdf
 
cargo pumping schematic diag.pdf
cargo pumping schematic diag.pdfcargo pumping schematic diag.pdf
cargo pumping schematic diag.pdf
 
MAM AND ICE ASSIGNMENT.pdf
MAM AND ICE ASSIGNMENT.pdfMAM AND ICE ASSIGNMENT.pdf
MAM AND ICE ASSIGNMENT.pdf
 
MAM AND ICE ASSIGNMENT.pdf
MAM AND ICE ASSIGNMENT.pdfMAM AND ICE ASSIGNMENT.pdf
MAM AND ICE ASSIGNMENT.pdf
 
2.2 Engine Room Layout.pdf
2.2  Engine Room Layout.pdf2.2  Engine Room Layout.pdf
2.2 Engine Room Layout.pdf
 

Recently uploaded

Oxy acetylene welding presentation note.
Oxy acetylene welding presentation note.Oxy acetylene welding presentation note.
Oxy acetylene welding presentation note.eptoze12
 
(MEERA) Dapodi Call Girls Just Call 7001035870 [ Cash on Delivery ] Pune Escorts
(MEERA) Dapodi Call Girls Just Call 7001035870 [ Cash on Delivery ] Pune Escorts(MEERA) Dapodi Call Girls Just Call 7001035870 [ Cash on Delivery ] Pune Escorts
(MEERA) Dapodi Call Girls Just Call 7001035870 [ Cash on Delivery ] Pune Escortsranjana rawat
 
OSVC_Meta-Data based Simulation Automation to overcome Verification Challenge...
OSVC_Meta-Data based Simulation Automation to overcome Verification Challenge...OSVC_Meta-Data based Simulation Automation to overcome Verification Challenge...
OSVC_Meta-Data based Simulation Automation to overcome Verification Challenge...Soham Mondal
 
Study on Air-Water & Water-Water Heat Exchange in a Finned Tube Exchanger
Study on Air-Water & Water-Water Heat Exchange in a Finned Tube ExchangerStudy on Air-Water & Water-Water Heat Exchange in a Finned Tube Exchanger
Study on Air-Water & Water-Water Heat Exchange in a Finned Tube ExchangerAnamika Sarkar
 
Application of Residue Theorem to evaluate real integrations.pptx
Application of Residue Theorem to evaluate real integrations.pptxApplication of Residue Theorem to evaluate real integrations.pptx
Application of Residue Theorem to evaluate real integrations.pptx959SahilShah
 
SPICE PARK APR2024 ( 6,793 SPICE Models )
SPICE PARK APR2024 ( 6,793 SPICE Models )SPICE PARK APR2024 ( 6,793 SPICE Models )
SPICE PARK APR2024 ( 6,793 SPICE Models )Tsuyoshi Horigome
 
VICTOR MAESTRE RAMIREZ - Planetary Defender on NASA's Double Asteroid Redirec...
VICTOR MAESTRE RAMIREZ - Planetary Defender on NASA's Double Asteroid Redirec...VICTOR MAESTRE RAMIREZ - Planetary Defender on NASA's Double Asteroid Redirec...
VICTOR MAESTRE RAMIREZ - Planetary Defender on NASA's Double Asteroid Redirec...VICTOR MAESTRE RAMIREZ
 
main PPT.pptx of girls hostel security using rfid
main PPT.pptx of girls hostel security using rfidmain PPT.pptx of girls hostel security using rfid
main PPT.pptx of girls hostel security using rfidNikhilNagaraju
 
GDSC ASEB Gen AI study jams presentation
GDSC ASEB Gen AI study jams presentationGDSC ASEB Gen AI study jams presentation
GDSC ASEB Gen AI study jams presentationGDSCAESB
 
Architect Hassan Khalil Portfolio for 2024
Architect Hassan Khalil Portfolio for 2024Architect Hassan Khalil Portfolio for 2024
Architect Hassan Khalil Portfolio for 2024hassan khalil
 
Sachpazis Costas: Geotechnical Engineering: A student's Perspective Introduction
Sachpazis Costas: Geotechnical Engineering: A student's Perspective IntroductionSachpazis Costas: Geotechnical Engineering: A student's Perspective Introduction
Sachpazis Costas: Geotechnical Engineering: A student's Perspective IntroductionDr.Costas Sachpazis
 
HARMONY IN THE NATURE AND EXISTENCE - Unit-IV
HARMONY IN THE NATURE AND EXISTENCE - Unit-IVHARMONY IN THE NATURE AND EXISTENCE - Unit-IV
HARMONY IN THE NATURE AND EXISTENCE - Unit-IVRajaP95
 
Artificial-Intelligence-in-Electronics (K).pptx
Artificial-Intelligence-in-Electronics (K).pptxArtificial-Intelligence-in-Electronics (K).pptx
Artificial-Intelligence-in-Electronics (K).pptxbritheesh05
 
Call Girls Narol 7397865700 Independent Call Girls
Call Girls Narol 7397865700 Independent Call GirlsCall Girls Narol 7397865700 Independent Call Girls
Call Girls Narol 7397865700 Independent Call Girlsssuser7cb4ff
 
College Call Girls Nashik Nehal 7001305949 Independent Escort Service Nashik
College Call Girls Nashik Nehal 7001305949 Independent Escort Service NashikCollege Call Girls Nashik Nehal 7001305949 Independent Escort Service Nashik
College Call Girls Nashik Nehal 7001305949 Independent Escort Service NashikCall Girls in Nagpur High Profile
 
Decoding Kotlin - Your guide to solving the mysterious in Kotlin.pptx
Decoding Kotlin - Your guide to solving the mysterious in Kotlin.pptxDecoding Kotlin - Your guide to solving the mysterious in Kotlin.pptx
Decoding Kotlin - Your guide to solving the mysterious in Kotlin.pptxJoão Esperancinha
 
Biology for Computer Engineers Course Handout.pptx
Biology for Computer Engineers Course Handout.pptxBiology for Computer Engineers Course Handout.pptx
Biology for Computer Engineers Course Handout.pptxDeepakSakkari2
 
Gurgaon ✡️9711147426✨Call In girls Gurgaon Sector 51 escort service
Gurgaon ✡️9711147426✨Call In girls Gurgaon Sector 51 escort serviceGurgaon ✡️9711147426✨Call In girls Gurgaon Sector 51 escort service
Gurgaon ✡️9711147426✨Call In girls Gurgaon Sector 51 escort servicejennyeacort
 
VIP Call Girls Service Hitech City Hyderabad Call +91-8250192130
VIP Call Girls Service Hitech City Hyderabad Call +91-8250192130VIP Call Girls Service Hitech City Hyderabad Call +91-8250192130
VIP Call Girls Service Hitech City Hyderabad Call +91-8250192130Suhani Kapoor
 

Recently uploaded (20)

Oxy acetylene welding presentation note.
Oxy acetylene welding presentation note.Oxy acetylene welding presentation note.
Oxy acetylene welding presentation note.
 
(MEERA) Dapodi Call Girls Just Call 7001035870 [ Cash on Delivery ] Pune Escorts
(MEERA) Dapodi Call Girls Just Call 7001035870 [ Cash on Delivery ] Pune Escorts(MEERA) Dapodi Call Girls Just Call 7001035870 [ Cash on Delivery ] Pune Escorts
(MEERA) Dapodi Call Girls Just Call 7001035870 [ Cash on Delivery ] Pune Escorts
 
OSVC_Meta-Data based Simulation Automation to overcome Verification Challenge...
OSVC_Meta-Data based Simulation Automation to overcome Verification Challenge...OSVC_Meta-Data based Simulation Automation to overcome Verification Challenge...
OSVC_Meta-Data based Simulation Automation to overcome Verification Challenge...
 
Study on Air-Water & Water-Water Heat Exchange in a Finned Tube Exchanger
Study on Air-Water & Water-Water Heat Exchange in a Finned Tube ExchangerStudy on Air-Water & Water-Water Heat Exchange in a Finned Tube Exchanger
Study on Air-Water & Water-Water Heat Exchange in a Finned Tube Exchanger
 
Application of Residue Theorem to evaluate real integrations.pptx
Application of Residue Theorem to evaluate real integrations.pptxApplication of Residue Theorem to evaluate real integrations.pptx
Application of Residue Theorem to evaluate real integrations.pptx
 
SPICE PARK APR2024 ( 6,793 SPICE Models )
SPICE PARK APR2024 ( 6,793 SPICE Models )SPICE PARK APR2024 ( 6,793 SPICE Models )
SPICE PARK APR2024 ( 6,793 SPICE Models )
 
VICTOR MAESTRE RAMIREZ - Planetary Defender on NASA's Double Asteroid Redirec...
VICTOR MAESTRE RAMIREZ - Planetary Defender on NASA's Double Asteroid Redirec...VICTOR MAESTRE RAMIREZ - Planetary Defender on NASA's Double Asteroid Redirec...
VICTOR MAESTRE RAMIREZ - Planetary Defender on NASA's Double Asteroid Redirec...
 
main PPT.pptx of girls hostel security using rfid
main PPT.pptx of girls hostel security using rfidmain PPT.pptx of girls hostel security using rfid
main PPT.pptx of girls hostel security using rfid
 
GDSC ASEB Gen AI study jams presentation
GDSC ASEB Gen AI study jams presentationGDSC ASEB Gen AI study jams presentation
GDSC ASEB Gen AI study jams presentation
 
Architect Hassan Khalil Portfolio for 2024
Architect Hassan Khalil Portfolio for 2024Architect Hassan Khalil Portfolio for 2024
Architect Hassan Khalil Portfolio for 2024
 
Sachpazis Costas: Geotechnical Engineering: A student's Perspective Introduction
Sachpazis Costas: Geotechnical Engineering: A student's Perspective IntroductionSachpazis Costas: Geotechnical Engineering: A student's Perspective Introduction
Sachpazis Costas: Geotechnical Engineering: A student's Perspective Introduction
 
HARMONY IN THE NATURE AND EXISTENCE - Unit-IV
HARMONY IN THE NATURE AND EXISTENCE - Unit-IVHARMONY IN THE NATURE AND EXISTENCE - Unit-IV
HARMONY IN THE NATURE AND EXISTENCE - Unit-IV
 
Artificial-Intelligence-in-Electronics (K).pptx
Artificial-Intelligence-in-Electronics (K).pptxArtificial-Intelligence-in-Electronics (K).pptx
Artificial-Intelligence-in-Electronics (K).pptx
 
Call Girls Narol 7397865700 Independent Call Girls
Call Girls Narol 7397865700 Independent Call GirlsCall Girls Narol 7397865700 Independent Call Girls
Call Girls Narol 7397865700 Independent Call Girls
 
College Call Girls Nashik Nehal 7001305949 Independent Escort Service Nashik
College Call Girls Nashik Nehal 7001305949 Independent Escort Service NashikCollege Call Girls Nashik Nehal 7001305949 Independent Escort Service Nashik
College Call Girls Nashik Nehal 7001305949 Independent Escort Service Nashik
 
Decoding Kotlin - Your guide to solving the mysterious in Kotlin.pptx
Decoding Kotlin - Your guide to solving the mysterious in Kotlin.pptxDecoding Kotlin - Your guide to solving the mysterious in Kotlin.pptx
Decoding Kotlin - Your guide to solving the mysterious in Kotlin.pptx
 
Biology for Computer Engineers Course Handout.pptx
Biology for Computer Engineers Course Handout.pptxBiology for Computer Engineers Course Handout.pptx
Biology for Computer Engineers Course Handout.pptx
 
Gurgaon ✡️9711147426✨Call In girls Gurgaon Sector 51 escort service
Gurgaon ✡️9711147426✨Call In girls Gurgaon Sector 51 escort serviceGurgaon ✡️9711147426✨Call In girls Gurgaon Sector 51 escort service
Gurgaon ✡️9711147426✨Call In girls Gurgaon Sector 51 escort service
 
Call Us -/9953056974- Call Girls In Vikaspuri-/- Delhi NCR
Call Us -/9953056974- Call Girls In Vikaspuri-/- Delhi NCRCall Us -/9953056974- Call Girls In Vikaspuri-/- Delhi NCR
Call Us -/9953056974- Call Girls In Vikaspuri-/- Delhi NCR
 
VIP Call Girls Service Hitech City Hyderabad Call +91-8250192130
VIP Call Girls Service Hitech City Hyderabad Call +91-8250192130VIP Call Girls Service Hitech City Hyderabad Call +91-8250192130
VIP Call Girls Service Hitech City Hyderabad Call +91-8250192130
 

Turbo Tech 103.pdf

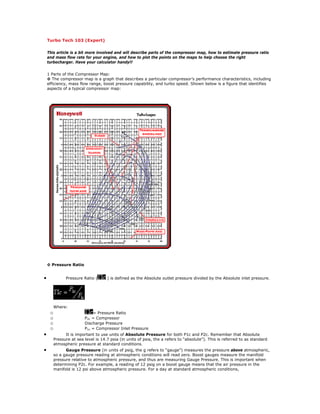
  • 1. Turbo Tech 103 (Expert) This article is a bit more involved and will describe parts of the compressor map, how to estimate pressure ratio and mass flow rate for your engine, and how to plot the points on the maps to help choose the right turbocharger. Have your calculator handy!! 1 Parts of the Compressor Map: ◊ The compressor map is a graph that describes a particular compressor’s performance characteristics, including efficiency, mass flow range, boost pressure capability, and turbo speed. Shown below is a figure that identifies aspects of a typical compressor map: ◊ Pressure Ratio • Pressure Ratio ( ) is defined as the Absolute outlet pressure divided by the Absolute inlet pressure. Where: o = Pressure Ratio o P2c = Compressor o Discharge Pressure o P1c = Compressor Inlet Pressure • It is important to use units of Absolute Pressure for both P1c and P2c. Remember that Absolute Pressure at sea level is 14.7 psia (in units of psia, the a refers to “absolute”). This is referred to as standard atmospheric pressure at standard conditions. • Gauge Pressure (in units of psig, the g refers to “gauge”) measures the pressure above atmospheric, so a gauge pressure reading at atmospheric conditions will read zero. Boost gauges measure the manifold pressure relative to atmospheric pressure, and thus are measuring Gauge Pressure. This is important when determining P2c. For example, a reading of 12 psig on a boost gauge means that the air pressure in the manifold is 12 psi above atmospheric pressure. For a day at standard atmospheric conditions,
  • 2. 12 psig + 14.7 psia = 26.7 psi absolute pressure in the manifold • The pressure ratio at this condition can now be calculated: 26.7 psia / 14.7 psia = 1.82 • However, this assumes there is no adverse impact of the air filter assembly at the compressor inlet. • In determining pressure ratio, the absolute pressure at the compressor inlet (P2c) is often LESS than the ambient pressure, especially at high load. Why is this? Any restriction (caused by the air filter or restrictive ducting) will result in a “depression,” or pressure loss, upstream of the compressor that needs to be accounted for when determining pressure ratio. This depression can be 1 psig or more on some intake systems. In this case P1c on a standard day is: 14.7psia – 1 psig = 13.7 psia at compressor inlet • Taking into account the 1 psig intake depression, the pressure ratio is now: (12 psig + 14.7 psia) / 13.7 psia = 1.95. • That’s great, but what if you’re not at sea level? In this case, simply substitute the actual atmospheric pressure in place of the 14.7 psi in the equations above to give a more accurate calculation. At higher elevations, this can have a significant effect on pressure ratio. For example, at Denver’s 5000 feet elevation, the atmospheric pressure is typically around 12.4 psia. In this case, the pressure ratio calculation, taking into account the intake depression, is: (12 psig + 12.4 psia) / (12.4 psia – 1 psig) = 2.14 Compared to the 1.82 pressure ratio calculated originally, this is a big difference. • As you can see in the above examples, pressure ratio depends on a lot more than just boost. ◊ Mass Flow Rate • Mass Flow Rate is the mass of air flowing through a compressor (and engine!) over a given period of time and is commonly expressed as lb/min (pounds per minute). Mass flow can be physically measured, but in many cases it is sufficient to estimate the mass flow for choosing the proper turbo. • Many people use Volumetric Flow Rate (expressed in cubic feet per minute, CFM or ft3 /min) instead of mass flow rate. Volumetric flow rate can be converted to mass flow by multiplying by the air density. Air density at sea level is 0.076lb/ft3 • What is my mass flow rate? As a very general rule, turbocharged gasoline engines will generate 9.5- 10.5 horsepower (as measured at the flywheel) for each lb/min of airflow. So, an engine with a target peak horsepower of 400 Hp will require 36-44 lb/min of airflow to achieve that target. This is just a rough first approximation to help narrow the turbo selection options.
  • 3. ◊ Surge Line • Surge is the left hand boundary of the compressor map. Operation to the left of this line represents a region of flow instability. This region is characterized by mild flutter to wildly fluctuating boost and “barking” from the compressor. Continued operation within this region can lead to premature turbo failure due to heavy thrust loading. • Surge is most commonly experienced when one of two situations exist. The first and most damaging is surge under load. It can be an indication that your compressor is too large. Surge is also commonly experienced when the throttle is quickly closed after boosting. This occurs because mass flow is drastically reduced as the throttle is closed, but the turbo is still spinning and generating boost. This immediately drives the operating point to the far left of the compressor map, right into surge. Surge will decay once the turbo speed finally slows enough to reduce the boost and move the operating point back into the stable region. This situation is commonly addressed by using a Blow-Off Valves (BOV) or bypass valve. A BOV functions to vent intake pressure to atmosphere so that the mass flow ramps down smoothly, keeping the compressor out of surge. In the case of a recirculating bypass valve, the airflow is recirculated back to the compressor inlet. • A Ported Shroud compressor (see Fig. 2) is a feature that is incorporated into the compressor housing. It functions to move the surge line further to the left (see Fig. 3) by allowing some airflow to exit the wheel through the port to keep surge from occurring. This provides additional useable range and allows a larger compressor to be used for higher flow requirements without risking running the compressor into a dangerous surge condition. The presence of the ported shroud usually has a minor negative impact on compressor efficiency. Fig. 2 Fig. 3 ◊ The Choke Line is the right hand boundary of the compressor map. For Garrett maps, the choke line is typically defined by the point where the efficiency drops below 58%. In addition to the rapid drop of compressor efficiency past this point, the turbo speed will also be approaching or exceeding the allowable limit. If your actual or predicted operation is beyond this limit, a larger compressor is necessary. ◊ Turbo Speed Lines are lines of constant turbo speed. Turbo speed for points between these lines can be estimated by interpolation. As turbo speed increases, the pressure ratio increases and/or mass flow increases. As indicated above in the choke line description, the turbo speed lines are very close together at the far right edge of the map. Once a compressor is operating past the choke limit, turbo speed increases very quickly and a turbo over-speed condition is very likely. ◊ Efficiency Islands are concentric regions on the maps that represent the compressor efficiency at any point on the map. The smallest island near the center of the map is the highest or peak efficiency island. As the rings move out from there, the efficiency drops by the indicated amount until the surge and choke limits are reached. 2. Plotting Your Data on the Compressor Map In this section, methods to calculate mass flow rate and boost pressure required to meet a horsepower target are
  • 4. presented. This data will then be used to choose the appropriate compressor and turbocharger. Having a horsepower target in mind is a vital part of the process. In addition to being necessary for calculating mass flow and boost pressure, a horsepower target is required for choosing the right fuel injectors, fuel pump and regulator, and other engine components. ◊ Estimating Required Air Mass Flow and Boost Pressures to reach a Horsepower target. · Things you need to know: · Horsepower Target · Engine displacement · Maximum RPM · Ambient conditions (temperature and barometric pressure. Barometric pressure is usually given as inches of mercury and can be converted to psi by dividing by 2) · Things you need to estimate: · Engine Volumetric Efficiency. Typical numbers for peak Volumetric Efficiency (VE) range in the 95%-99% for modern 4-valve heads, to 88% - 95% for 2-valve designs. If you have a torque curve for your engine, you can use this to estimate VE at various engine speeds. On a well-tuned engine, the VE will peak at the torque peak, and this number can be used to scale the VE at other engine speeds. A 4-valve engine will typically have higher VE over more of its rev range than a two-valve engine. · Intake Manifold Temperature. Compressors with higher efficiency give lower manifold temperatures. Manifold temperatures of intercooled setups are typically 100 - 130 degrees F, while non-intercooled values can reach from 175-300 degrees F. · Brake Specific Fuel Consumption (BSFC). BSFC describes the fuel flow rate required to generate each horsepower. General values of BSFC for turbocharged gasoline engines range from 0.50 to 0.60 and higher. The units of BSFC are Lower BSFC means that the engine requires less fuel to generate a given horsepower. Race fuels and aggressive tuning are required to reach the low end of the BSFC range described above. For the equations below, we will divide BSFC by 60 to convert from hours to minutes. To plot the compressor operating point, first calculate airflow: Where: · Wa = Airflowactual (lb/min) · HP = Horsepower Target (flywheel) · = Air/Fuel Ratio · = Brake Specific Fuel Consumption ( ) ÷ 60 (to convert from hours to minutes) EXAMPLE: I have an engine that I would like to use to make 400Hp, I want to choose an air/fuel ratio of 12 and use a BSFC of 0.55. Plugging these numbers into the formula from above: of air. Thus, a compressor map that has the capability of at least 44 pounds per minute of airflow capacity is a good starting point. Note that nowhere in this calculation did we enter any engine displacement or RPM numbers. This means that for
  • 5. any engine, in order to make 400 Hp, it needs to flow about 44 lb/min (this assumes that BSFC remains constant across all engine types). Naturally, a smaller displacement engine will require more boost or higher engine speed to meet this target than a larger engine will. So how much boost pressure would be required? ◊ Calculate required manifold pressure required to meet the horsepower, or flow target: Where: · MAPreq = Manifold Absolute Pressure (psia) required to meet the horsepower target · Wa = Airflowactual(lb/min) · R = Gas Constant = 639.6 · Tm = Intake Manifold Temperature (degrees F) · VE = Volumetric Efficiency · N = Engine speed (RPM) · Vd = engine displacement (Cubic Inches, convert from liters to CI by multiplying by 61.02, ex. 2.0 liters * 61.02 = 122 CI) EXAMPLE: To continue the example above, let’s consider a 2.0 liter engine with the following description: · Wa = 44 lb/min as previously calculated · Tm = 130 degrees F · VE = 92% at peak power · N = 7200 RPM · Vd = 2.0 liters * 61.02 = 122 CI = 41.1 psia (remember, this is absolute pressure. Subtract atmospheric pressure to get gauge pressure (aka boost): 41.1 psia – 14.7 psia (at sea level) = 26.4 psig boost As a comparison let’s repeat the calculation for a larger displacement 5.0L (4942 cc/302 CI) engine. Where: · Wa = 44 lb/min as previously calculated · Tm = 130 degrees F · VE = 85% at peak power (it is a pushrod V-8) · N = 6000 RPM · Vd = 4.942*61.02= 302 CI = 21.6 psia (or 6.9 psig boost)
  • 6. This example illustrates in order to reach the horsepower target of 400 hp, a larger engine requires lower manifold pressure but still needs 44lb/min of airflow. This can have a very significant effect on choosing the correct compressor. With Mass Flow and Manifold Pressure, we are nearly ready to plot the data on the compressor map. The next step is to determine how much pressure loss exists between the compressor and the manifold. The best way to do this is to measure the pressure drop with a data acquisition system, but many times that is not practical. Depending upon flow rate, charge air cooler characteristics, piping size, number/quality of the bends, throttle body restriction, etc., the plumbing pressure drop can be estimated. This can be 1 psi or less for a very well designed system. On certain restrictive OEM setups, especially those that have now higher-than-stock airflow levels, the pressure drop can be 4 psi or greater. For our examples we will assume that there is a 2 psi loss. So to determine the Compressor Discharge Pressure (P2c), 2 psi will be added to the manifold pressure calculated above. Where: · P2c = Compressor Discharge Pressure (psia) · MAP = Manifold Absolute Pressure (psia) · ∆Ploss = Pressure Loss Between the Compressor and the Manifold (psi) For the 2.0 L engine: = 43.1 psia For the 5.0 L engine: = 23.6 psia Remember our discussion on inlet depression in the Pressure Ratio discussion earlier, we said that a typical value might be 1 psi, so that is what will be used in this calculation. For this example, assume that we are at sea level, so ambient pressure is 14.7 psia. We will need to subtract the 1 psi pressure loss from the ambient pressure to determine the Compressor Inlet Pressure (P1). Where: · P1c = Compressor Inlet Pressure (psia) · Pamb = Ambient Air pressure (psia) · ∆Ploss = Pressure Loss due to Air Filter/Piping (psi) P1c = 14.7 - 1 = 13.7 psia With this, we can calculate Pressure Ratio ( ) using the equation.
  • 7. For the 2.0 L engine: = 3.14 For the 5.0 L engine: = 1.72 We now have enough information to plot these operating points on the compressor map. First we will try a GT2860RS. This turbo has a 60mm, 60 trim compressor wheel. Clearly this compressor is too small, as both points are positioned far to the right and beyond the compressor’s choke line. Another potential candidate might be the GT3076R. This turbo has a 76mm, 56 trim compressor wheel:
  • 8. This is much better; at least both points are on the map! Let’s look at each point in more detail. For the 2.0L engine this point is in a very efficient area of the map, but since it is in the center of the map, there would be a concern that at a lower engine speeds that it would be near or over the surge line. This might be ok for a high-rpm-biased powerband that might be used on a racing application, but a street application would be better served by a different compressor. For the 5.0L engine, this looks like a very good street-biased powerband, with the lower engine speeds passing through the highest efficiency zone on the map, and plenty of margin to stay clear of surge. One area of concern would be turbo overspeed when revving the engine past peak power. A larger compressor would place the operating point nearer to the center of the map and would give some additional benefit to a high-rpm-biased powerband. We’ll look at a larger compressor for the 5.0L after we figure out a good street match for the 2.0L engine. So now lets look at a GT3071R, which uses a 71mm, 56 trim compressor wheel.
  • 9. For the 2.0L engine, this is a much more mid-range-oriented compressor. The operating point is shifted a bit towards the choke side of the map and this provides additional surge margin. The lower engine speeds will now pass through the higher efficiency zones and give excellent performance and response. For the 5.0L engine, the compressor is clearly too small and would not be considered. Now that we have arrived at an acceptable compressor for the 2.0L engine, lets calculate a lower rpm point to put on the map to better get a feel for what the engine operating line will look like. We can calculate this using the following formula: We’ll choose the engine speed at which we would expect to see peak torque, based on experience or an educated guess. In this case we’ll choose 5000rpm. Where: · Wa = Airflowactual (lb/min) · MAP = Manifold Absolute Pressure (psia) =35.1 psia · R = Gas Constant = 639.6 · Tm = Intake Manifold Temperature (degrees F) =130 · VE = Volumetric Efficiency = 0.98 · N = Engine speed (RPM) = 5000rpm · Vd = engine displacement (Cubic Inches, convert from liters to CI by multiplying by 61, ex. 2.0 liters * 61 = 122 CI)
  • 10. = 34.1 lb/min Plotting this on the GT3071R compressor map gives the following operating points. This gives a good representation of the operating line at that boost level, which is well suited to this map. At engine speeds lower than 5000rpm the boost pressure will be lower, and the pressure ratio would be lower, to keep the compressor out of surge. Back to the 5.0 L engine. Let’s look at a larger compressor’s map. This time we will try a GT3582R with an 82mm, 56 trim compressor.
  • 11. Here , compared to the GT3076R, we can see that this point is not quite so deep into choke and will give better high-rpm performance than the 76mm wheel. A further increase in wheel size would give even better high-rpm performance, but at the cost of low- and mid-range response and drivability. Hopefully this has given a basic idea of what a compressor map displays and how to choose a compressor. As you can see, a few simple estimations and calculations can provide a good basis for compressor selection. If real data is available to be substituted in place of estimation, more accurate results can be generated.