
Recommended
Recommended
More Related Content
Similar to RBC Monthly Housing Report - November 2022.pdf
Similar to RBC Monthly Housing Report - November 2022.pdf (20)
More from VickyAulakh1
More from VickyAulakh1 (20)
Recently uploaded
Recently uploaded (20)
RBC Monthly Housing Report - November 2022.pdf
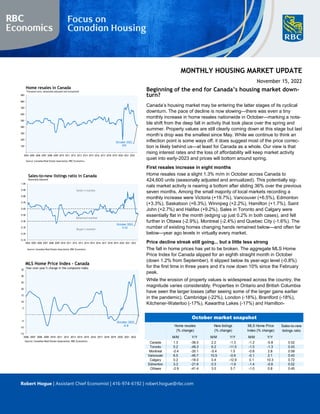
- 1. MONTHLY HOUSING MARKET UPDATE November 15, 2022 Beginning of the end for Canada’s housing market down- turn? Canada’s housing market may be entering the latter stages of its cyclical downturn. The pace of decline is now slowing—there was even a tiny monthly increase in home resales nationwide in October—marking a nota- ble shift from the deep fall in activity that took place over the spring and summer. Property values are still clearly coming down at this stage but last month’s drop was the smallest since May. While we continue to think an inflection point is some ways off, it does suggest most of the price correc- tion is likely behind us—at least for Canada as a whole. Our view is that rising interest rates and the loss of affordability will keep market activity quiet into early-2023 and prices will bottom around spring. First resales increase in eight months Home resales rose a slight 1.3% m/m in October across Canada to 424,600 units (seasonally adjusted and annualized). This potentially sig- nals market activity is nearing a bottom after sliding 36% over the previous seven months. Among the small majority of local markets recording a monthly increase were Victoria (+19.7%), Vancouver (+6.5%), Edmonton (+3.3%), Saskatoon (+6.3%), Winnipeg (+2.2%), Hamilton (+1.7%), Saint John (+2.7%) and Halifax (+9.2%). Sales in Toronto and Calgary were essentially flat in the month (edging up just 0.2% in both cases), and fell further in Ottawa (-2.9%), Montreal (-2.4%) and Quebec City (-1.6%). The number of existing homes changing hands remained below—and often far below—year ago levels in virtually every market. Price decline streak still going... but a little less strong The fall in home prices has yet to be broken. The aggregate MLS Home Price Index for Canada slipped for an eighth straight month in October (down 1.2% from September). It slipped below its year-ago level (-0.8%) for the first time in three years and it’s now down 10% since the February peak. While the erosion of property values is widespread across the country, the magnitude varies considerably. Properties in Ontario and British Columbia have seen the larger losses (after seeing some of the larger gains earlier in the pandemic). Cambridge (-22%), London (-18%), Brantford (-18%), Kitchener-Waterloo (-17%), Kawartha Lakes (-17%) and Hamilton- Robert Hogue | Assistant Chief Economist | 416-974-6192 | robert.hogue@rbc.com October 2022 425 100 200 300 400 500 600 700 800 900 2004 2005 2006 2007 2008 2009 2010 2011 2012 2013 2014 2015 2016 2017 2018 2019 2020 2021 2022 Source: Canadian Real Estate Association, RBC Economics Thousand units, seasonally adjusted and annualized Home resales in Canada October 2022 0.52 0.10 0.20 0.30 0.40 0.50 0.60 0.70 0.80 0.90 1.00 2004 2005 2006 2007 2008 2009 2010 2011 2012 2013 2014 2015 2016 2017 2018 2019 2020 2021 2022 Seller's market Balanced market Buyer's market Source: Canadian Real Estate Association, RBC Economics Seasonally adjusted Sales-to-new listings ratio in Canada October 2022 -0.8 -15 -10 -5 5 10 15 20 25 30 35 2006 2007 2008 2009 2010 2011 2012 2013 2014 2015 2016 2017 2018 2019 2020 2021 2022 Year-over-year % change in the composite index MLS Home Price Index - Canada Source: Canadian Real Estate Association, RBC Economics Sales-to-new listings ratio M/M Y/Y M/M Y/Y M/M Y/Y Canada 1.3 -36.0 2.2 -1.3 -1.2 -0.8 0.52 Toronto 0.2 -49.3 6.2 -11.5 -1.5 -1.3 0.43 Montreal -2.4 -35.1 -5.4 1.5 -0.8 2.8 0.58 Vancouver 6.5 -45.7 10.5 -0.6 -0.1 2.1 0.43 Calgary 0.2 -18.0 0.4 -12.9 0.1 10.3 0.72 Edmonton 3.3 -21.6 0.3 -1.9 -1.4 -0.6 0.52 Ottawa -2.9 -41.4 3.5 3.7 -1.0 0.8 0.45 October market snapshot Home resales (% change) New listings (% change) MLS Home Price Index (% change)
- 2. MONTHLY HOUSING MARKET UPDATE | APRIL 13, 2018 2 MONTHLY HOUSING MARKET UPDATE | NOVEMBER 15, 2022 Burlington (-17%) have recorded the steepest MLS HPI drop since their cyclical peak earlier this year in Ontario. Chilliwack (-18%) and the Fraser Valley (-12%) have led the decline in British Columbia. Affordability issues weigh big on Toronto and Vancouver prices The correction shaved another 1.5% off the Toronto-area MLS HPI last month. It’s now down more than 11% since the February peak (on a seasonally-adjusted basis). The downturn has so far been comparatively less severe in Vancouver. Its MLS HPI has fallen 5.3% since cresting in March. And the monthly rate of decline moderated significantly in October to just -0.9%. We doubt this will mark a turning point. We expect extremely poor affordability conditions will maintain intense downward pressure on property values in the area. The same goes for Toronto where were see prices continuing to fall in the near term. Calgary: the exception to the rule There are very few markets bucking the general weakening trend. Calgary is one of them. While activity is down from sky-high levels at the start of this year, it’s still far above pre-pandemic levels. And prices are holding up. The area’s MLS HPI has essentially been stationary since April. We expect this to continue as demand-supply conditions are among the tightest in Canada. Market unlikely to heat up anytime soon The market downturn may be in a late stage but it doesn’t mean things are about to heat up again. We expect high— and still-rising— interest rates will continue to challenge buyers for some time. This will keep activity quiet for a while longer even if it stabilizes near current levels. We think benchmark prices will keep trending lower until spring. The material contained in this report is the property of Royal Bank of Canada and may not be reproduced in any way, in whole or in part, without ex- press authorization of the copyright holder in writing. The statements and statistics contained herein have been prepared by RBC Economics Research based on information from sources considered to be reliable. We make no representation or warranty, express or implied, as to its accuracy or com- pleteness. This publication is for the information of investors and business persons and does not constitute an offer to sell or a solicitation to buy secu- rities. ®Registered trademark of Royal Bank of Canada. ©Royal Bank of Canada. October 2022 2.1 -20 -10 10 20 30 40 2006 2007 2008 2009 2010 2011 2012 2013 2014 2015 2016 2017 2018 2019 2020 2021 2022 Year-over-year % change in the composite index MLS Home Price Index - Vancouver Source: Canadian Real Estate Association, RBC Economics October 2022 10.4 -20 -10 10 20 30 40 50 60 2006 2007 2008 2009 2010 2011 2012 2013 2014 2015 2016 2017 2018 2019 2020 2021 2022 Year-over-year % change in the composite index MLS Home Price Index - Calgary Source: Canadian Real Estate Association, RBC Economics October 2022 -1.3 -10 -5 5 10 15 20 25 30 35 40 2006 2007 2008 2009 2010 2011 2012 2013 2014 2015 2016 2017 2018 2019 2020 2021 2022 Year-over-year % change in the composite index MLS Home Price Index - Toronto Source: Canadian Real Estate Association, RBC Economics October 2022 2.8 5 10 15 20 25 30 2006 2007 2008 2009 2010 2011 2012 2013 2014 2015 2016 2017 2018 2019 2020 2021 2022 Year-over-year % change in the composite index MLS Home Price Index - Montreal Source: Canadian Real Estate Association, RBC Economics October 2022 0.8 -10 -5 5 10 15 20 25 30 35 40 2006 2007 2008 2009 2010 2011 2012 2013 2014 2015 2016 2017 2018 2019 2020 2021 2022 Year-over-year % change in the composite index MLS Home Price Index - Ottawa Source: Canadian Real Estate Association, RBC Economics October 2022 -0.6 -20 -10 10 20 30 40 50 60 70 2006 2007 2008 2009 2010 2011 2012 2013 2014 2015 2016 2017 2018 2019 2020 2021 2022 Year-over-year % change in the composite index MLS Home Price Index - Edmonton Source: Canadian Real Estate Association, RBC Economics