SlideShare a Scribd company logo
1 of 47
Download to read offline
POLICYreportG o l d w a t e r I n s t i t u t e
No . 1 8 9 I Ja n u a r y 1 2 , 2 0 0 4
Competition or Consolidation? The School District Consolidation
Debate Revisited
by Vicki Murray, Ph.D., Education Analyst, Goldwater Institute, and Ross Groen, Education Researcher,
Goldwater Institute
EXECUTIVE SUMMARY
In November 2002, the Arizona Office of the Auditor General (OAG) released a report on school districts’
administrative spending that found, on average, small school districts spent more per pupil than large districts.
In response, the Arizona State Legislature established a commission to study the potential savings from statewide
school district consolidation.
Understandably, taxpayers want education dollars spent in the classroom, on teacher compensation and
smaller class size, not on wasteful administration. Current proposals by the state superintendent of public
instruction, Tom Horne, and Pinnacle West Capital Corporation’s vice president of government affairs, Martin
L. Shultz, therefore attempt to reduce administrative costs from roughly 11 percent to five percent of Arizona’s
education spending to redirect the savings into the classroom.
A closer examination of the OAG report suggests statewide school district consolidation is unlikely to
produce the hoped-for fiscal savings. Moreover, empirical research shows consolidation increases administrative
costs at the expense of classroom instruction, yielding larger classes, fewer teachers, and lower student
achievement. Therefore, consolidation is a marginal reform, best implemented on a limited, case-by-case basis.
Research shows that competition, not consolidation, improves school efficiency. By fully exercising Arizona’s
existing open enrollment law, school efficiency could rise by 10 percent, achievement could be roughly three to
six percentile points higher, and spending could be almost eight percent lower. Expanding Arizona’s charter
schools could improve test scores of charter students and students attending nearby traditional public schools by
one to three percentile points, while yielding a per-pupil savings of $1,530 – more than 90 times greater than the
estimated $17.34 per-pupil savings from current consolidation proposals.
Like policymakers in Arizona, policymakers in dozens of other states are weighing the potential savings from
projected administrative efficiencies against the potential pitfalls of consolidation. What is the potential fiscal
impact of statewide school district consolidation for Arizona? What other educational quality issues might be
affected? This study examines those questions.
GOLDWATER INSTITUTE I policy report
2
IInnttrroodduuccttiioonn
Over the past 50 years, public
schools nationwide have borne the
responsibility for a growing number of
non-instructional programs, including
provision of transportation, meals, and
numerous health and social services.
While state and federal governments
have dramatically increased funding for
such programs, the corresponding
administrative staff charged with
oversight has grown disproportionately
large and, in effect, now competes for
limited resources with instructional
programs.1
Arizona’s Office of the Auditor
General (OAG) confirmed this trend in
its March 2002 report, Arizona Public
School Dollars Spent in the Classroom.
According to the OAG, “Higher
expenditures for certain non-
instructional costs, such as food service,
transportation and administration were
associated with lower classroom dollar
spending.”2
As a result, “Arizona has
historically been below the national
average for spending on instruction.”3
In a subsequent analysis, Factors
Affecting School Districts’ Costs, the OAG
paid special attention to districts with
unusually high or low per-pupil
administrative costs in 2001, as well as
school districts in which per-pupil
administrative costs increased or
decreased compared with 1999 data.4
It
found that administrative costs varied
widely among Arizona’s school districts,
with some districts spending as little as
$1 on administration for every $7 spent
on instruction, and others spending as
much as $1 on administration for every
$3 dollars spent on instruction.5
In response, the Arizona legislature
established a 19-member School District
Unification and Consolidation Com-
mission to study potential savings
associated with the reduction of school
administration and personnel.6
Consolidation proposals under
consideration, such as those proposed by
the state superintendent of public
instruction, Tom Horne, and Pinnacle
West Capital Corporation’s vice
president of government affairs Martin
L. Shultz, rely heavily on select OAG
findings that larger school districts have
lower administrative costs. While those
consolidation plans address related
educational issues, each focuses on
achieving “economies of scale” by
increasing school district size to generate
administrative savings. According to
Shultz, “A central issue in this debate
centers on the effective and efficient use
of faculty and administrative resources
and how to spread necessary fixed costs
over a larger base to produce dollars to
go directly into the classroom.”7
Superintendent Horne concurs:
CCoommppeettiittiioonn oorr CCoonnssoolliiddaattiioonn?? TThhee SScchhooooll DDiissttrriicctt CCoonnssoolliiddaattiioonn
DDeebbaattee RReevviissiitteedd
by Vicki Murray, Ph.D., Education Analyst, Goldwater Institute, and Ross Groen,
Education Researcher, Goldwater Institute
January 12, 2004
Like policymakers in
Arizona, policymakers
in other states must
weigh the potential
savings from projected
administrative
efficiencies against the
potential pitfalls of
consolidation. What is
the potential fiscal
impact of statewide
school district consol-
idation for Arizona,
and what other
educational quality
issues, such as class size
and local control,
might be affected?
3
The first reason [for consolidating
school districts] is the efficiency.
The Joint Legislative Budget
Committee did a study very
recently where they found
efficient large districts spend $300
and some per pupil on
administration, where some of the
smaller districts spend as much as
$1,000 per student on
administration. We only give
$4,700 per student. So a thousand
dollars is a big chunk out of the
budget. People expect the money
to be spent in the classroom on
teacher compensation and on
smaller class size, rather than
wasteful administration.8
To illustrate, Horne compares the
average per-pupil administrative costs
for 88 school districts – 51 small, 36
large, and one very large.9
The small
districts averaged $1,297 per pupil on
administrative costs, while the large
districts averaged $517, and the very
large district averaged $368. This means
the very large district spent an estimated
eight percent of its revenue on
administration, the large districts spent
11 percent, and the small district spent
28 percent. Thus, consolidation
proponents maintain that overall
administrative spending would decline if
Arizona’s smaller school districts were
either absorbed by larger districts or
combined to create larger districts.
While the OAG’s 2002 report
helped bring school district
consolidation to the forefront of
Arizona’s education debate, the issue is
more than a century old and has been
considered in nearly every state. For
example, New York recently
consolidated its community districts
into a single centralized system, and
Michigan awards a per-pupil bonus for
districts that consolidate.10
Wyoming’s legislature, however,
recently defeated consolidation legis-
lation, while Oregon is considering ways
to reduce the size of its expanding school
districts. In California, efforts are
underway to divide one of the country’s
largest school districts, Los Angeles
Unified School District, with 905,020
students, into 30 separate districts.
Nevada is also considering measures to
reduce the size of one of its largest
districts, Clark County School District,
which has 244,684 students.11
Arkansas, Idaho, Iowa, Kansas, and
South Dakota are among a growing
number of states still grappling with this
issue. Like policymakers in Arizona,
policymakers in those and other states
must weigh the potential savings from
projected administrative efficiencies
against the potential pitfalls of
consolidation. These include loss of local
control and representation, increased
travel times for students, and even
decreased child safety because of the
increased distance between home and
school.12
Those are just some of the stated
reasons why some states are
consolidating school districts, while
others are breaking them up. What is the
potential fiscal impact of statewide
GOLDWATER INSTITUTE I policy report
4
school district consolidation for Arizona,
and what other educational quality
issues, such as class size and local
control, might be affected?
TThhee PPootteennttiiaall FFiissccaall IImmppaacctt ooff
SSttaatteewwiiddee SScchhooooll DDiissttrriicctt
CCoonnssoolliiddaattiioonn
Statewide, administration spending
per pupil varies widely, from as little as
$360 per pupil to $6,013 per pupil. The
OAG concluded in both its 2000 and
2002 reports that, in general, districts
with higher administrative costs are
usually smaller, while districts with
lower administrative costs are typically
larger.
The OAG examined 209 of
Arizona’s 233 regular school districts
that range broadly in size, or average
daily membership (ADM); 51 are very
small, 37 are small, 85 are medium-
sized, and 36 are large districts (13 of
which have 15,000 students or more
enrolled).13
It concluded that districts
with high costs typically serve fewer than
600 students and those with low costs
serve 5,000 or more students.14
Based in part on these findings, the
Shultz consolidation plan recommends
school districts be combined to serve
between 6,000 and 30,000 students,
while Horne prefers closer to 30,000
students.15
If either of those
recommendations were implemented,
however, all very small, small, and
medium districts would be eliminated,
as well as some large districts. Such
eliminations translate into an estimated
83 percent reduction in the number of
school districts, from well over 200 to
roughly 40.16
Horne believes that school district
consolidation of this magnitude would
ultimately bring administrative costs
down from an estimated 11 percent to
five percent of Arizona’s education
spending.17
If successful, such a
reduction would make Arizona a
national leader in administrative
efficiency. But will such savings be
realized through statewide school district
consolidation, and will those savings
actually reach the state’s classrooms?
A closer examination of the OAG’s
findings from its 2000 and 2002 reports
on school districts’ administrative costs
reveals that the relationship between
school district size and administrative
costs is more complex than it seems.
The factors affecting administrative
costs are many, and for this reason,
statewide consolidation efforts may not
produce the hoped-for fiscal savings.
According to the OAG,
administrative costs arise from three
sources: the individual school, the
district, and the governing board, which
includes superintendents’ offices.18
The
largest portion of administrative
expenses, 52 percent, occurs at the
individual school level. Those
administrative costs include salaries and
benefits for principals, clerical support
staff, and assistants, who oversee school
If consolidation were
implemented, all very
small, small, and
medium districts would
be eliminated, as well
as some large districts.
Such eliminations
translate into an
estimated 83 percent
reduction in the
number of school
districts, from well over
200 to roughly 40.
January 12, 2004
5
Because the majority of
all administrative costs
(52 percent) occurs at
the individual school
level, current consol-
idation proposals would
address less than half of
all administrative costs.
Their potential fiscal
impact is further
diminished because
these proposals do not
target the most
expensive types of
administrative costs.
operations, activities, and staff
evaluations.19
Importantly, in its analysis
of accounting data from 206 school
districts on factors influencing
administrative costs, the OAG identified
the size of individual schools, not
districts, as a key factor.20
In contrast, business and central
support services constitute 33 percent of
administrative costs and occur
predominately at the district level.
Business support services include
budgeting and payroll; purchasing,
storing, and distributing equipment,
supplies, and furniture; and publishing
and printing. Central support services
include planning, research, and
evaluation services; publicizing
educational and administrative issues to
students, staff, and the public; personnel
recruiting, placement, and training; and
data processing.21
Expenses related to governing boards
and superintendents’ offices, which also
occur at the district level, account for
only 15 percent of administrative costs.
Those costs include elections, staff
relations, and secretarial, legal, audit,
and other services. They also include
superintendent salaries, benefits, and
office expenses, in addition to lobbying
expenses and expenses related to
community, state, and federal relations.22
Because the majority of all
administrative costs (52 percent) occurs
at the individual school level, current
consolidation proposals would address
less than half of all administrative costs.
Their potential fiscal impact is further
diminished because these proposals do
not target the most expensive types of
administrative costs.23
The primary goal of proposed
consolidation measures is to produce
greater economies of scale. As the OAG
explains, “Districts have certain
functions that must be performed, such
as purchasing supplies and accounting
for the expenditure of public monies
[which requires purchasing the service of
accountants]. Consequently, small
districts are more likely to have higher
per-pupil administrative costs because
there are fewer students over which to
spread these costs.”24
A review of the OAG’s findings on
school districts’ administrative costs,
however, indicates that the potential
fiscal impact of current consolidation
proposals has been greatly overstated.
Purchased services and supplies costs,
such as those described by the OAG
above, constitute only 14 percent of all
types of administrative costs. In contrast,
salaries and benefits constitute 84
percent of administrative costs.
Proponents will counter that a
secondary consequence of consolidation
is the reduction in the number of
schools, and therefore, overall
administrative staff. As described
extensively below, empirical research
demonstrates that this is not the case.
On the contrary, consolidation efforts in
other states have resulted in larger, not
smaller administrative staffs, further
eroding already meager projected
economies-of-scale savings.
GOLDWATER INSTITUTE I policy report
6
Current consolidation proposals
designed to redirect administrative
savings to the classroom presume it is
possible to reverse the OAG’s
administration-to-classroom-dollars
formula: “For every one percent increase
in administrative costs, there is a .5
percent reduction in the classroom
dollar percentage.”25
That is, for every
dollar saved on administration, fifty
cents could be redirected to the
classroom. Thus, in theory, only half of
any administrative savings from
consolidation would be available for the
classroom. If realized, based on available
OAG data, these savings would redirect
only $17.34 more to each student in the
Arizona public school system.
According to Joint Legislative
Budget Committee (JLBC) calculations,
the total administrative costs for the 209
districts studied by the OAG in its 2002
report amounted to $395 million. A 14
percent reduction in administrative
purchased service and supplies costs is
actually only a seven percent reduction,
because only the district level is targeted,
and that is the source of less than half of
all administrative costs.
Divided among the 797,102
students enrolled at schools in the 209
districts studied by the OAG for the
2001-02 school year, this figure amounts
to $34.69 extra per pupil. However, any
potential savings must be reduced once
more because, as suggested above, only
half of any administrative savings would
reach the classroom, resulting in a
savings of $17.34 savings per pupil.
Furthermore, the projected savings of
$17.34 to $34.69 per pupil is valid only
if the most expensive types of
administrative costs-salaries, benefits,
and staffing levels-remain constant at
both the district and individual school
levels.26
By focusing exclusively on the
potential administrative savings from
making school districts larger, current
consolidation proposals overlook the
most expensive types of administrative
costs. A closer examination of the OAG’s
sample school districts reveals that the
relationship between school district size
and administrative costs is not as linear
as consolidation proposals presume, so
even the potential savings of $17.34 to
$34.69 per student is likely overstated.27
Moreover, school district
consolidation reduces the number of
individual schools and makes them
significantly larger, as described in
greater detail below.28
As a result,
consolidation could adversely affect
student achievement, classroom size,
and administrative efficiency.
SScchhooooll DDiissttrriicctt SSiizzee iiss aa PPoooorr
PPrreeddiiccttoorr ooff AAddmmiinniissttrraattiivvee CCoossttss
Turning to the sample districts the
OAG selected for closer examination, it
becomes clear that size is only one factor
affecting school district administrative
costs. To determine the factors affecting
high or low per-pupil administrative
costs, the OAG selected a sample of 20
school districts statewide, 11 with high
A closer examination of
the OAG’s sample
school districts reveals
that the relationship
between school district
size and administrative
costs is not as linear as
consolidation proposals
presume, so even the
potential savings of
$17.34 to $34.69 per
student is likely
overstated.
January 12, 2004
7
costs and nine with low costs.29
While it
identified six factors that contribute to
higher administrative costs (size, salaries,
staffing level, benefits, purchased
services, and supplies), the OAG focused
on size.30
Of the 11 sample districts singled
out in the OAG report for high
administrative costs, nine are classified
as small.31
Given OAG’s general
conclusion about district size and
administrative costs, one might expect
that only the smallest districts would
stand out for high administrative costs.
This is not the case. Districts having
high administrative costs ranged in size
from 15 to 21,115 students.32
In fact, a
large district and even an extra-large
district are cited as having unusually
high administrative costs.33
Common sense dictates that
textbooks, transportation, and cartons of
milk would all be less expensive if
bought in bulk, as would contracting for
services. If small size makes it more
difficult for some districts to achieve
economies of scale, then all of the small
and very small districts listed by the
OAG as having unusually high costs
should also have higher-than-average
costs relating to purchased services and
supplies. Again, this is not the case.
Only four of the nine smaller
districts had higher than average
supplies costs, while six of the nine had
higher than average purchased services
costs. In contrast, both of the large and
extra-large districts in this group had
higher than average purchased services
costs. The large district also had higher
than average supplies costs. These
findings suggest size alone is not a
reliable indicator of administrative
efficiency.
An examination of sample school
districts selected by the OAG for having
lower than average administrative costs
also indicates that size alone does not
predict efficiency. Of the eight districts
selected by the OAG for low admin-
istrative costs,34
one was very small, three
were medium, one was large, and four
were very large.35
The common
denominator for all lower-spending
districts, including small districts, was
lower than average services and supplies
costs, not size. In fact, the only low-
spending district listed that was not
cited as also having low purchased
services costs was a large district.36
Similarly, among the sample districts
that had changing administrative costs,
either higher or lower in 1999 than
2001, the OAG identified nine with
increased costs and two with decreased
costs.37
Among the districts identified as
having growing administrative costs
were districts of all sizes: three very small
districts, four small districts, one large
district, and one very large district.
Smaller district size was common to
six of the nine higher-cost districts. Yet,
if small district size alone caused higher
administrative costs, other costs such as
salaries, benefits, and purchased services
would have remained constant. They did
not.
Smaller district size was
common to six of the
nine higher-cost
districts. Yet, if small
district size alone
caused higher
administrative costs,
other costs such as
salaries, benefits, and
purchased services
would have remained
constant. They did not.
GOLDWATER INSTITUTE I policy report
8
Contrary to expectations, the only
districts that reduced administrative
costs during this period were two smaller
districts. And just one of the two lower-
spending districts experienced an
increase in size, which further suggests
that district size alone is not sufficient to
affect significant cost changes over time.
In fact, among the 11 sample districts
selected for changing administrative
costs, fluctuating district size was a
factor common to only seven of them.
Changes in purchased services were
common to 10 of the 11 sample high-
cost districts studied, yet the only
district that did not experience increased
purchased services costs was a very small
district. Likewise, both of the districts
with reduced administrative costs
experienced lower purchased services
costs.38
Thus, the relationship between
administrative costs and school district
size is not as simple as it initially appears.
Such is the case even with regard to fixed
administrative costs, namely purchased
services and supplies, where larger
districts would be expected to achieve
significant cost reductions through
economies of scale alone. The failure of
the larger districts to realize savings in
these types of administrative costs
indicates that district size alone is an
insufficient factor in controlling
administrative costs. This failure further
suggests that other, more significant
costs besides purchased service and
supplies costs drive up a district’s overall
administrative costs.
The OAG cited salaries and benefits
as contributing more significantly to
administrative cost than size, purchased
services, or supplies. For example,
among the 11 sample districts selected
for changing administrative costs, small
size was listed as a factor for nine
districts, but higher salaries was a factor
cited for 10 districts. Similarly, among
the eight sample districts cited for
particularly low costs, large size was a
factor for four districts, while staffing
levels was cited as a factor for six
districts. For the 11 districts with
changing administrative costs, decreased
size was a factor for seven districts, while
salaries and benefits were factors for
eight.
These findings indicate that large
size is not sufficient to contain the most
expensive types of administrative costs.
They further suggest that the impact of
various types of administrative costs on
overall costs is far more complex than
linear size-cost consolidation proposals
admit.
SSmmaalllleerr DDiissttrriiccttss RReegguullaarrllyy HHaavvee
LLoowweerr AAddmmiinniissttrraattiivvee CCoossttss
tthhaann LLaarrggeerr DDiissttrriiccttss
Another consequence of linear size-
cost consolidation proposals is that they
overlook the administrative costs of
Arizona’s medium districts. Current
consolidation proposals take as their
departure point the OAG’s conclusion
that, in general, smaller districts (fewer
than 600 students) have higher
administrative costs, while larger
These findings indicate
that large size is not
sufficient to contain the
most expensive types of
administrative costs.
They further suggest
that the impact of
various types of
administrative costs on
overall costs is far more
complex than linear
size-cost consolidation
proposals admit.
GOLDWATER INSTITUTE I policy report
January 12, 2004
9
districts (over 5,000 students) have
lower administrative costs. Yet 39
percent of all school districts examined
by the OAG in its 2002 study are
medium districts, which fall between
those size ranges. The OAG did not cite
any medium district as having
particularly high administrative costs,
but it did select three for having low
costs, which constitutes one-third of the
OAG sample.
To conduct a more comprehensive
analysis of school district administrative
costs, we used Table 6 of the OAG’s
2002 report, which ranks all 209
districts from highest to lowest
administrative spending per pupil.39
The
OAG table does not, however, show
school district size. School size figures
were calculated by taking the total cost
column amounts in Table 6 and dividing
them by the per-pupil cost amounts.
With this larger sample size, it is possible
to test how the administrative costs of
smaller and medium districts statewide
compare to those of larger districts.
If larger districts spend the least per
pupil on administration generally, then
the state’s 10 largest districts should
provide a standard by which to judge the
spending of medium districts. The state’s
10 largest school districts spent between
$348 and $638 per pupil on
administration in 2001. Fifty-two, or 64
percent, of medium-size districts fall
within this range.40
The average size of
medium districts within this range is
2,406 students, while the average large
district within this range is nearly seven
times larger, at 15,765 students.41
Contrary to expectations, the school
district ranked first in terms of lowest
administrative spending per pupil is very
small. This district is an anomaly,
however, as the county superintendent
has agreed to manage the district for
free.42
Nevertheless, it is illustrative of
the finding highlighted by the OAG in
its 2000 report, but not in its 2002
report: “Districts that assigned two or
more duties to one employee . . . were
frequently associated with low
administrative costs per pupil.”43
According to the OAG, small districts
often assign multiple duties to their
administrators, thereby reducing the
number of employees and associated
compensation costs, which constitute
the largest types of administrative costs.44
Next on the list for lowest per-pupil
administrative costs are two medium
districts.45
Among the top tier of school
districts for lowest per-pupil spending
on administration (the top 70 of 209) -
where one would expect large school
districts to dominate - medium, small,
and even one very small district spent
less on administration per-pupil than
many of Arizona’s 10 largest school
districts. In fact, one of the state’s largest
districts, Phoenix Unified High School
District, does not even rank among the
top tier, as shown in Table 1.
Medium districts Snowflake Unified
School District (4,632 students) and
Peach Springs Unified School District
(1,834 students) outperformed all of
Arizona’s 10 largest school districts,
which range in size from 69,148
students (Mesa Unified School District)
Among the top tier of
school districts for
lowest per-pupil
spending on
administration (the top
70 of 209) - where one
would expect large
school districts to
dominate - medium,
small, and even one
very small district spent
less on administration
per-pupil than many of
Arizona’s 10 largest
school districts.
GOLDWATER INSTITUTE I policy report
10
GOLDWATER INSTITUTE I policy report
District name Number of students Size categoryb
Per-pupil spending
on administration
Murphy ESD 2,409 Medium 571
Colorado River UHSD 1,981 Medium 570
Sierra Vista USD 6,478 Large 570
Page USD 3,065 Medium 569
Liberty ESD 1,455 Medium 565
Buckeye UHSD 1,112 Medium 564
Mohave Valley ESD 1,651 Medium 558
Eloy ESD 1,311 Medium 555
Cottonwood-Oak Creek ESD 2,260 Medium 552
Naco ESD 284 Small 551
Glendale UHSD 13,479 Large 550
Buckeye ESD 1,270 Medium 540
Agua Fria UHSD 2,372 Medium 537
Vail USD 3,200 Medium 535
Douglas USD 4,183 Medium 534
Blue Ridge USD 2,339 Medium 531
Tolleson UHSD 4,353 Medium 530
Gadsden ESD 3,209 Medium 529
Winslow USD 2,481 Medium 525
Santa Cruz Valley USD 2,363 Medium 512
Osborn ESD 3,791 Medium 504
Litchfield ESD 3,438 Medium 502
Dysart USD 5,205 Large 494
Tempe UHSD 12,528 Large 493
Payson USD 2,761 Medium 488
Tucson USD #2 59,068 Large 488
Amphitheater USD 15,957 Large 487
Williams USD 747 Medium 481
Sunnyside USD 13,963 Large 480
Casa Grande ESD 5,035 Large 479
Madison ESD 4,600 Large 473
Nogales USD 6,139 Large 471
Apache Junction USD 5,335 Large 470
Isaac ESD 7,825 Large 469
Balsz ESD 3,030 Medium 468
Prescott USD 4,804 Large 462
Chino Valley USD 2,415 Medium 462
Deer Valley USD #6 26,124 Large 457
Scottsdale USD #7 26,082 Large 457
Higley USD 2,050 Medium 455
TTaabbllee 11.. TToopp TTiieerr SScchhooooll DDiissttrriiccttss ffoorr LLoowweesstt PPeerr--ppuuppiill SSppeennddiinngg oonn
AAddmmiinniissttrraattiioonn ffrroomm HHiigghheesstt ttoo LLoowweessttaa
January 12, 2004
11
a
The top 70 out of 209. Listing based on Table 6 of Factors Affecting, 2002. The
2001 number of students was calculated by taking the total cost column amounts in
Table 6 and dividing them by the per-pupil cost amounts. Ranks for 10 largest
schools districts are given next to their names.
b
According to the OAG, very small districts have fewer than 200 students; small
districts have between 200 and 599 students; medium districts have between 600
and 4,999 students; and large districts have 5,000 students or more. The National
Center for Education Statistics (NCES) categorizes extra-large districts as 15,000
students or more and super-large districts have 40,000 students or more.
District name Number of students Size categoryb
Per-pupil spending
on administration
Quartzsite ESD 314 Small 450
Yuma ESD 9,515 Large 450
Humboldt USD 5,094 Large 449
Clarkdale-Jerome ESD 347 Small 449
Marana USD 11,522 Large 448
Lake Havasu USD 5,604 Large 445
Safford USD 2,792 Medium 442
Kyrene ESD 18,402 Large 441
Yuma UHSD 7,988 Large 439
Creighton ESD 7,895 Large 438
Flowing Wells USD 5,822 Large 437
Chandler USD #9 20,729 Large 435
Mesa USD #1 69,148 Large 428
Toltec ESD 793 Medium 426
Avondale ESD 3,150 Medium 423
Pendergast ESD 7,661 Large 423
Flagstaff USD 11,145 Large 417
Alhambra ESD 13,050 Large 414
Kingman ESD 4,459 Medium 411
Tempe ESD 11,894 Large 411
Peoria USD #4 32,569 Large 404
Glendale ESD 11,303 Large 390
Washington ESD #8 23,507 Large 388
Bullhead City ESD 3,628 Medium 372
Cartwright ESD 17,612 Large 363
Casa Grande UHSD 2,443 Medium 362
Paradise Valley USD #3 33,616 Large 349
Gilbert USD #5 27,979 Large 348
Snowflake USD 4,632 Medium 326
Peach Springs USD 1,834 Medium 233
Blue ESD 0 Very small 0
TTaabbllee 11 ((ccoonnttiinnuueedd)).. TToopp TTiieerr SScchhooooll DDiissttrriiccttss ffoorr LLoowweesstt PPeerr--ppuuppiill SSppeennddiinngg oonn
AAddmmiinniissttrraattiioonn ffrroomm HHiigghheesstt ttoo LLoowweessttaa
GOLDWATER INSTITUTE I policy report
12
to 21,115 (Phoenix Unified High
School District). While Snowflake
Unified School District spent $326 per
pupil on administration and Peach
Springs Unified School District spent
$233 per pupil, Arizona’s 10 largest
districts spent between $348 and $638
per pupil.
As the OAG makes clear, however,
one-time or idiosyncratic expenses can
have a significant impact on the per-
pupil administrative costs for school
districts of all sizes during any given
fiscal year. For example, to attract a new
superintendent, one district increased its
salary level by roughly $10,000 per year.
Another district had an estimated
$100,000 in attorney fees relating to
contract and personnel matters. Two
districts pre-paid health insurance
premiums, inflating administrative costs
in one fiscal year but achieving increased
savings in subsequent fiscal years.46
For
this reason, a district’s administrative
spending for a single fiscal year can be
misleading. To ensure that the instances
of very small, small, and medium
districts outperforming the state’s 10
largest districts were not aberrations, we
compared the OAG’s 2002 district
rankings and expenditures with the
OAG’s 2000 district rankings and
expenditures.47
Using Arizona’s 10 largest districts as
a guide, we identified all very small,
small, and medium districts that fell
within the per-pupil spending ranges for
the state’s largest districts in 1999 ($326
to $634) and 2001 ($348 to $638). Of
the 52 medium districts that fell within
the 2001 spending range, only two did
not also fall within the fiscal year 1999
range: Peach Springs Unified School
District and Higley Unified School
District. However, both of these districts
were classified by the OAG as small
districts in 1999.
All seven of the small school districts
that fell within the 2001 per-pupil
administrative spending range for
Arizona’s top 10 largest school districts
also fell within this range in fiscal year
1999. Very small district Kirkland
Elementary School District, which spent
only $5 more per pupil on
administration in 2001 than the tenth-
largest district, Phoenix Unified High
School District, spent $198 less per
pupil than Phoenix Unified High School
District in 1999.
Comparing the OAG’s 2000 and
2002 district rankings based on 1999
and 2001 fiscal year data shows that the
performance of the state’s best smaller
and medium districts is not an
aberration. Small and medium districts
that performed as well or better than
their very large counterparts in 2001
also did so in 1999.
For example, in 1999, medium
district Snowflake Unified School
District outperformed only one of
Arizona’s 10 largest districts, spending
$492 per pupil on administration
compared to Phoenix Unified High
School District’s $634. By 2001,
Snowflake Unified School District’s
administrative spending had dropped by
34 percent to only $326 per pupil, tied
Comparing the OAG’s
2000 and 2002 district
rankings based on
1999 and 2001 fiscal
year data shows that
the performance of the
state’s best smaller and
medium districts is not
an aberration. Small
and medium districts
that performed as well
or better than their very
large counterparts in
2001 also did so in
1999.
January 12, 2004
A cursory review of the
OAG’s findings on
school district admin-
istrative costs revealed
that the potential fiscal
impact would yield at
most an additional
$17.34 to $34.69 per
student. In fact, a closer
examination of how the
best smaller and
medium districts
compare with Arizona’s
largest districts suggests
that even this projection
may be too optimistic,
since factors other than
size influence schools
district administrative
costs.
13
with top-ranked large district Scottsdale
Unified School District and
outperforming the state’s other nine
largest districts. Also in 1999, medium
district Casa Grande Unified High
School District outperformed eight of
the state’s largest school districts,
spending $364 per pupil on
administration.
Therefore, according to the OAG’s
rankings, the best small and medium
districts perform on par with or better
than Arizona’s 10 largest districts in
terms of administrative cost per pupil.
That is, both very small and small school
districts averaging 307 students and
medium districts averaging 2,406
students compete well with the state’s
ten largest districts, which average
33,994 students. The fact that
significantly smaller districts can keep
administrative costs so low indicates that
the impact of various types of
administrative costs is far more complex
than the linear size-cost consolidation
model suggests.
A cursory review of the OAG’s
findings on school district admin-
istrative costs revealed that the potential
fiscal impact would yield at most an
additional $17.34 to $34.69 per
student. In fact, a closer examination of
how the best smaller and medium
districts compare with Arizona’s largest
districts suggests that even this
projection may be too optimistic, since
factors other than size influence schools
district administrative costs.
Current statewide consolidation
proposals would reduce the number of
school districts statewide by 83 percent
(from over 200 to roughly 40),
eliminating very small, small, medium,
and even some large school districts. Yet
our analysis of 209 Arizona school
districts reveals that smaller districts
averaging 307 students and medium
districts averaging roughly 2,400
students perform as well as or better
than the state’s 10 largest districts
averaging almost 34,000 students. In
light of these findings, the
recommended optimal school district
size of 6,000 to 30,000 students appears
unwarranted.
Furthermore, the negligible
potential fiscal savings of school district
consolidation must be weighed against
its negative impact on numerous
education quality issues.
BBiiggggeerr DDiissttrriiccttss LLeeaadd ttoo
AAddmmiinniissttrraattiivvee BBllooaatt,, nnoott
SSttrreeaammlliinniinngg
In light of available Arizona data,
statewide school district consolidation
appears ill-advised. A growing body of
national research on consolidation
supports this assessment. Syracuse
University’s Maxwell School Center for
Policy Research scholars Matthew
Andrews, William Duncombe, and John
Yinger recently surveyed three decades
of empirical research on school district
consolidation. They concluded that cost
savings might be achieved by moving
from a very small district (500 or fewer
While both the Shultz
and Horne consol-
idation plans point to
districts of 6,000 or
more students as models
of administrative
savings, Andrews,
Duncombe, and Yinger
caution that
diseconomies of scale
begin to emerge when
districts grow larger
than 6,000 students,
and “sizeable
diseconomies of size
may begin to emerge for
districts above 15,000
students.”
GOLDWATER INSTITUTE I policy report
14
students) to a district with enrollment
between 2,000 and 4,000 students,
roughly the size of Arizona’s most
efficient medium districts.48
In fact, the Shultz proposal calling
for consolidation of school districts to
reach between 6,000 and 30,000
students bases its recommendation on
the work of Duncombe, who is the
associate director of the Education
Finance Accountability Program at
Syracuse University, as well as a senior
research associate of the Maxwell
School’s Center for Policy Research.49
Yet Shultz’s recommendation runs
counter to Duncombe’s findings,
namely that 6,000 is the optimal
number of students in a district for total
cost effectiveness. Furthermore,
Duncombe finds “no support for the use
of state tax dollars to encourage
consolidation among districts with
1,500 or more pupils.”50
While both the Shultz and Horne
consolidation plans point to districts of
6,000 or more students as models of
administrative savings, Andrews,
Duncombe, and Yinger caution that
diseconomies of scale begin to emerge
when districts grow larger than 6,000
students, and “sizeable diseconomies of
size may begin to emerge for districts
above 15,000 students.”51
Similarly, a growing body of research
questions the validity of economies of
scale applied to school district
performance. As industrial economics
expert Bela Gold puts it, “From the
standpoint of economic analysis, it is
important to recognize that the
widespread faith in the ‘economies of
scale’ has not gained much support from
the relevant theoretical and empirical
literature.”52
In his study of New York
state school districts, economist Herbert
Kiesling concludes that “no evidence has
been found to support the popular idea
of economies of scale in school district
performance.”53
James W. Guthrie, now chair of the
Peabody Center for Education Policy at
Vanderbilt University, concluded that
the consolidation trend has generally
failed to produce promised economies of
scale.54
Likewise, William F. Fox,
director of the Center for Business and
Economic Research at the University of
Tennessee at Knoxville, finds much of
the research on economies of scale in
education to be flawed methodologically
and concludes that “size economies
results must be applied cautiously, and
with full recognition of the unique
characteristics of each place, because
considerations [besides size] are vital to
determining the cost implications of
policy decisions.”55
Over 30 years of research indicates
that school district size does not
determine efficiency. As far back as
1972, research indicated that school
district size did not affect spending
patterns, there was no absolute
“optimum” size, and in general, the
impact of school district size on
efficiency must not be considered in a
vacuum.56
Writing for the American
School Boards Journal, Carolyn Mullins
January 12, 2004
15
reviewed the pros and cons of
consolidation and found consolidation
is no “panacea for all education’s ills.”
Mullins concluded, “Like the bikini, it
isn’t for everybody and never will be.”57
PPootteennttiiaall IImmppaacctt ooff CCoonnssoolliiddaattiioonn
oonn EEdduuccaattiioonnaall QQuuaalliittyy IIssssuueess
Superintendent Horne favors
statewide school district consolidation
because, as he says, “People expect the
money to be spent in the classroom on
teacher compensation and on smaller
class size, rather than wasteful
administration.”58
However, empirical
research indicates that consolidation,
and the accompanying centralization,
will increase administration at the
expense of classroom instruction, with
fewer resources, larger classes, and more
administrative work for teachers.
In 2002, a research team led by
William Ouchi, a professor at UCLA’s
Anderson School of Management,
examined nine different school systems,
including the United States’ three largest
districts. The research team found that
the centralized management of schools
brought about by consolidation actually
led to administrative bloat, not
streamlining. For example, in the highly
centralized Los Angeles Unified School
District, only 45 percent of education
dollars were spent in the classroom.59
Education expert Mike Antonucci
explains, “Paradoxically, the larger a
school district gets, the more resources it
devotes to secondary or even non-
essential activities.” He refers to this
phenomenon as “mission creep,” in
which secondary administrative support
services subvert a district’s primary
purpose of educating students.60
Focusing on theoretical economies of
scale, consolidation proponents overlook
the negative constraints of large school
districts. Former Clinton Admin-
istration assistant secretary of the U.S.
Department of Education and
Education Commission of the States
senior education analyst Kent McGuire
cautions that such “negative
mechanisms” include shifting resources
away from core educational activities.61
From 1938 to 1980, school
administrations changed from small,
local organizations to large,
professionally run bureaucracies.62
It was
widely believed that schools and
districts, like corporations, should be
made larger and be run according to the
“scientific management” model to
achieve higher productivity at reduced
costs. Yet as early as 1955, F. W. Terrien
and D. L. Mills’ analysis of California
districts for the 1951-52 school year
showed that as school districts grow, “the
school administrator may expect that the
percentage of his organization which is
devoted to administrative tasks may
rise.”63
Seven years later, Raymond E.
Callahan published Education and the
Cult of Efficiency. His findings confirmed
that consolidated districts run by
professionals according to the “scientific
management” model sacrifice
Writing for the
American School
Boards Journal,
Carolyn Mullins
reviewed the pros and
cons of consolidation
and found consol-
idation is no “panacea
for all education’s ills.”
Mullins concluded,
“Like the bikini, it isn’t
for everybody and never
will be.”
GOLDWATER INSTITUTE I policy report
16
educational quality. According to
Callahan:
The tragedy itself was fourfold:
that educational questions were
subordinated to business
considerations; that administrators
were produced who were not, in
any true sense, educators; that a
scientific label was put on some
very unscientific and dubious
methods and practices; and the
anti-intellectual climate, already
prevalent, was strengthened.64
Contrary to expectations, research
overwhelmingly shows smaller,
decentralized school districts have
superior student achievement and
efficiency. After examining school
districts nationwide, Ouchi and his
UCLA research team conclude, “Our
data generally support the view that
decentralized public school districts
outperform more centralized districts on
student performance outcomes,
administrative efficiency, and incidence
of corruption.”65
Commonwealth Foundation senior
fellow and University of Idaho
economics professor emeritus John T.
Wenders concludes that increased school
district centralization consumes any
savings intended to go to the classroom:
“The result [where districts have been
consolidated] has been higher, not lower,
per-pupil costs and worse education. In
the jargon of Economics 101, any
economies gained by movements down
cost curves have been more than offset
by upward shifts in these same curves.”66
National data confirm that as school
districts consolidate they become more
inefficient, the number of individual
schools declines, and schools become
larger. According to the National Center
for Education Statistics (NCES) June
2003 Digest of Education Statistics,
“During most of the last century, the
trend to consolidate small schools
brought a large decline in the total
number of public schools in the United
States.” For example, from the 1938-39
school year to the 2000-01 school year,
the number of school districts declined
almost twice as fast as overall enrollment
increased, resulting in larger schools.
More recently, from 1990-91 to 2000-
01, the average elementary school size
grew by six percent, while the average
secondary school size grew by seven
percent.67
As discussed above, the
consolidation plans proposed by Horne
and Shultz would drastically reduce the
number of school districts statewide
without addressing the primary source
of all administrative costs, the individual
school. As a result, any potential fiscal
savings would amount, at best, to
between $17.34 and $34.69 per pupil.
But if school district consolidation also
reduces the number of individual
schools, would not administration levels
also decline, yielding savings at the
source of most administrative costs?
The lion’s share of consolidation
research focuses on this very question
but finds that administrative levels have
skyrocketed. Cato Institute executive
vice president David Boaz and writer R.
After examining school
districts nationwide,
Ouchi and his UCLA
research team conclude,
“Our data generally
support the view that
decentralized public
school districts
outperform more
centralized districts on
student performance
outcomes, admin-
istrative efficiency, and
incidence of
corruption.”
January 12, 2004
17
Morris Barrett found that between 1960
and 1984, the number of school districts
nationwide declined 39 percent, from
40,520 to 15,747. During this time,
however, school administration grew by
a staggering 500 percent, while “the
number of teachers and principals grew
by a comparatively puny 57 percent and
79 percent, respectively.”68
Data from the NCES reveal that as
schools get bigger, pupil/teacher ratios
grow. As a result of elementary
enrollment rising faster than the number
of schools, class sizes increased
nationwide from the 1990-91 school
year to the 2000-01 school year.69
Nevertheless, the average public
elementary and secondary pupil/teacher
ratio has dropped nearly constantly from
the fall of 1955 to the fall of 2001, from
roughly 27:1 to 16:1.70
Larger schools, however, have higher
pupil/teacher ratios. As of fall 2000,
only schools with fewer than 499
students had pupil/teacher ratios below
the national average of 16:1.71
Schools
with enrollment between 500 and 999
did not have statistically higher
pupil/teacher ratios than the national
average. Schools with enrollment
between 1,000 and 1,999 had
pupil/teacher ratios of more than 17:1,
and those with enrollment over 1,500
were higher still, at more than 19:1.72
While national pupil/teacher ratios
have been decreasing, from the fall of
1995 to the fall of 2000, Arizona’s ratio
increased slightly, from 19.6 students
per teacher to 19.8 students per teacher,
almost 4 more than the national
average.73
In fact, Arizona’s current
overall ratios are higher than those of the
country’s largest schools.74
Consol-
idation would exacerbate this trend,
given that the resulting larger schools
tend to have higher pupil/teacher
ratios.75
Furthermore, following years of
school district consolidation nationwide,
administrators now equal, and in some
states exceed, teachers and instructional
staff as a proportion of school staff. In
fact, from 1994 to 2000, teachers in
public elementary and secondary schools
as a percentage of staff have decreased
overall nationally from 52.0 percent to
51.6 percent.76
In Arizona, this trend is even more
pronounced. Over the same period,
teachers in the state’s public elementary
and secondary schools as a percentage of
staff have decreased from 51.2 percent to
49.3 percent. As a result, Arizona ties for
the tenth worst teacher-as-a-percentage-
of-staff ranking in the country.77
As of the 1999-00 school year, 71
percent of public school teachers
nationwide indicated “routine duties
and paperwork interfere with the job of
teaching.”78
Thus, after decades of school
district consolidation, teachers believe
that they are doing more administrative
work, even though there are now as
many or more administrators than
teachers on staff.
Consolidation efforts nationwide
have also resulted in diminished local
While national
pupil/teacher ratios
have been decreasing,
from the fall of 1995 to
the fall of 2000,
Arizona’s ratio
increased slightly, from
19.6 students per
teacher to 19.8 students
per teacher, almost 4
more than the national
average. In fact,
Arizona’s current
overall ratios are higher
than those of the
country’s largest schools.
Consolidation would
exacerbate this trend,
given that the resulting
larger schools tend to
have higher pupil/
teacher ratios.
Whereas smaller
districts allowed for
greater parental
involvement because
school board members
and school officials were
more accessible and had
fewer constituents,
larger districts have
diminished the role of
parents and increased
the influence of special
interest groups. This
effect is unavoidable
when districts
consolidate and become
more bureaucratic.
GOLDWATER INSTITUTE I policy report
18
and parental influence. The research of
education scholar and former teacher
Matthew J. Brouillette found:
The dramatic reduction of school
districts and the increase in
student population dilutes the
parental influence on their
children’s education. Whereas
smaller districts allowed for
greater parental involvement
because school board members
and school officials were more
accessible and had fewer
constituents, larger districts have
diminished the role of parents
and increased the influence of
special interest groups. This
effect is unavoidable when
districts consolidate and become
more bureaucratic.79
Rural districts, typically the targets
of consolidation efforts, pay an
especially high price in this regard.
Idaho is currently considering two
school district consolidation measures.
State representative Allen Andersen (D-
Pocatello), who is also the director of the
Idaho Education Association in
southeast Idaho, notes that local schools
are an essential part of the rural
community’s identity and structure. For
this reason, rural constituents typically
oppose consolidation. According to
Andersen, “Most of their activities and
identity revolve around the school
district. So I think there is a fear from
folks that that sense of identity and
community spirit would be lost.”80
In perhaps one of the first seminal
studies to question the belief that bigger
schools are better, Big School, Small
School: High School Size and Student
Behavior, University of Kansas
psychologists and authors Roger G.
Barker and Paul V. Gump document the
vital contribution small local schools
make to rural communities, and the
opportunities small schools offer
students. For example, Barker and
Gump found that the proportion of
students participating in artistic,
journalistic, and student government
competitions was highest in high schools
with between 61 and 150 students. Not
only were the number and kinds of
activities twice as great in smaller
schools, participation levels were also
three to 20 times higher in smaller high
schools.81
Emil J. Haller and David H. Monk,
professors of education administration
at Cornell University, studied rural
school district consolidation from the
1940s to the 1970s and concluded that
consolidation was “profoundly
undemocratic.”82
Focusing his research
on rural school districts, Paul Nachtigall
explains why: “Seeking economies of
scale through school consolidation are,
at best, elusive,” and at worst, he
continues, “to the extent that closing
schools [as a result of district
consolidation] contributes to the demise
of rural communities, the dollars saved
are a high price to pay for the loss of
those communities.”83
According to the NCES, Arizona
currently has 1,706 regular public
schools. Excluding the state’s charter
January 12, 2004
In fact, data show that
in consolidated districts
administration grows,
instructional staff
shrinks, and economies
of scale fail to
materialize. Likewise, a
growing body of
research now suggests
school district
consolidation may have
a negative impact on
student achievement.
19
schools, there are 351 schools statewide
whose student populations range from
800 to over 3,000 students.84
Roughly
84 percent of these schools are in or
located near large cities.85
By increasing
the number of large high schools and
creating more populated elementary and
secondary schools, consolidation efforts
would substantially alter the majority of
Arizona’s schools, roughly 74 percent of
which have fewer than 800 students. In
addition, rural areas would be affected
disproportionately, as only 20 schools
with more than 800 students now exist
in rural areas, or less than six percent of
all schools. Research further suggests
that potential administrative savings do
not justify the upheaval attendant to
school closures in rural areas.
Tracing consolidation and related
efforts in rural areas back to 1840,
Jonathan P. Sher and Rachel B.
Tompkins conclude the claim that
consolidation of rural districts “will, ipso
facto, save money appears to have no
empirical or logical basis. It is simply
incorrect to assert that consolidation is
synonymous with economy.”86
Rural residents are not the only ones
who want a vital connection to their
local schools. Nationwide, as public
elementary and secondary enrollments
were increasing overall, and the number
of regular school districts and schools
were decreasing, public survey
respondents have consistently given
their local schools and the nation’s
schools lower grades.87
From 1974
through 1989, the average grade
respondents would give their local (and
the nation’s) public schools was in the
C+/C range. From 1990 to 1994 the
average grades declined to the C/C-,
even D+, range.88
Over this twenty-year period, the
decline in the number of school districts
and the corresponding decline in the
number of schools outpaced shrinking
enrollment by five to one and three to
one, respectively. As a result, schools
became more crowded, and this
phenomenon likely contributed to lower
public approval ratings. Not
surprisingly, the items most frequently
cited as major problems facing public
schools from 1992 to 2002 were large
schools and overcrowding (increasing
from 9 to 23 percent), and lack of
discipline (17 percent in both 1992 and
2002).89
PPootteennttiiaall IImmppaacctt ooff CCoonnssoolliiddaattiioonn
oonn SSttuuddeenntt AAcchhiieevveemmeenntt
Research thus far shows that
consolidation fails to reduce wasteful
administration or achieve significant
savings. In fact, data show that in
consolidated districts administration
grows, instructional staff shrinks, and
economies of scale fail to materialize.
Likewise, a growing body of research
now suggests school district
consolidation may have a negative
impact on student achievement.
While acknowledging the method-
ological challenges to comparing student
achievement in centralized and
While all students
appear to benefit
academically from
smaller schools and
districts, at-risk
students benefit even
more. Ouchi’s UCLA
research team found
that when districts
decentralize, “data
generally show improve-
ments in average
[student] achievement
across every ethnic
group and every grade.”
Further, data suggest
that in decentralized
districts, ethnic
achievement gaps are
smaller.
GOLDWATER INSTITUTE I policy report
20
decentralized school districts across the
country, Ouchi’s UCLA research team
concluded that “decentralized school
districts will outperform centralized
school districts in producing positive
student achievement in academics.”90
Kathleen Cotton of the Northwest
Regional Education Laboratory analyzed
more than 100 documents, including 69
studies, evaluations, reviews, and
syntheses on school size and educational
quality.91
As with Ouchi et al., Cotton
found that roughly half the literature
found no difference in achievement
between students attending large and
small schools, while the other half of the
literature concluded achievement levels
were higher in small schools. Cotton
notes, “None of the research finds large
schools superior to small schools in their
achievement effects.”92
All of the researchers Cotton cites
reached their conclusions about school
size and student achievement after
controlling for other variables, including
student and staff characteristics. Among
those characteristics is the advantage of a
rural setting, where most of the country’s
small schools are found. While most
consolidation proponents consider a
rural setting a disadvantage, some
research shows it contributes to higher
student achievement.
For example, Cotton refers to
Herbert J. Walberg, research professor of
education and psychology at the
University of Illinois at Chicago and
distinguished visiting fellow at the
Hoover Institution at Stanford
University, who concludes that “even
discounting the positive effects of rural
location, smaller high schools yielded
greater achievement and years of
attained education after high school.
Thus, smaller schools showed long-
range effects independent of rural
setting.”93
While all students appear to benefit
academically from smaller schools and
districts, at-risk students benefit even
more. Ouchi’s UCLA research team
found that when districts decentralize,
“data generally show improvements in
average [student] achievement across
every ethnic group and every grade.”94
Further, data suggest that in
decentralized districts, ethnic
achievement gaps are smaller.95
This finding substantiates the
findings of previous research on school
district consolidation and minority
student achievement. As Cotton
summarized, the effects of small schools
on achievement for both minority
students and students of low
socioeconomic status are the most
positive. Similarly, research shows large
schools disproportionately harm
achievement for these students.96
In October 2002, the American
Legislative Exchange Council (ALEC)
released its Report Card on American
Education, which included a state-by-
state analysis of education outcomes
from 1976 through 2001. Among the
many factors the ALEC report examined
were school district size, school size, and
their effects on student achievement.97
January 12, 2004
On average, fewer
students per school and
fewer schools per district
(which means more
and smaller districts
with more and smaller
schools) are associated
with higher SAT, ACT,
and National Assess-
ment of Educational
Progress (NAEP) scores.
21
The report concluded that on average,
fewer students per school and fewer
schools per district (which means more
and smaller districts with more and
smaller schools) are associated with
higher SAT, ACT, and National
Assessment of Educational Progress
(NAEP) scores.98
Likewise, trendline
analyses from 1981 to 2001 suggest
positive relationships between higher
average SAT scores and smaller school
sizes, as well as fewer schools per
district.99
Figures 3.7, 3.8, and 3.9 from the
Report Card on American Education are
shown in Figure 1.100
The bold line
drawn through each diagram is the trend
line. In all three diagrams, the trendline
slopes down, indicating that fewer
schools per district may be associated
with higher academic achievement.
Each dot represents a single state. Each
state’s average number of schools per
district is measured along the vertical
axis, while the average test scores are
measured along the horizontal axis.
Thus, if a state’s dot is located in the
upper left corner, the state has a large
number of schools per district but a low
average test score. In contrast, if a state’s
dot is located in the lower right corner, it
has a low number of schools per district
but a high average test score.
Statistical analysis, however, reveals
that no single factor guarantees student
achievement, including fewer districts,
smaller schools, more per-pupil
spending, more federal funding, higher
teacher salaries, or lower pupil/teacher
ratios. In fact, when all other factors are
held constant, only fewer students per
school had a positive, statistically
significant relationship with student
achievement, albeit a weak one.101
While the ALEC report shows no
statistical relationship between the
individual factors and student
achievement over time, Arizona data
from 1981 to 2001 is revealing. During
that period, the average nationwide SAT
score rose by 2.5 percent, while Arizona’s
average SAT score dropped by 6.1
percent, placing the state last in the
nation.102
From 1977 to 1999, Arizona
had a nearly 60 percent increase in the
number of students per district, roughly
three times the national average. At the
same time, the number of Arizona
schools per districts fell by more than
three percent.
Nationwide, the number of schools
per district grew nearly five percent.
Likewise, as pupil/teacher ratios fell an
average of 13 percent nationally,
Arizona’s ratio hardly budged, falling less
than one percent. In contrast, top-
ranking Alabama improved its SAT
scores by more than 10 percent, while
the number of students and schools per
district fell by roughly four and five
percent, respectively.
As seen in Tables 2 and 3, a more
detailed examination of the 10 best and
worst states for SAT positive score
changes, including the changes in
students and schools per district, is even
more revealing. Nationwide, from 1981
to 2001, average SAT scores improved
2.5 percent. In the case of the ten worst
GOLDWATER INSTITUTE I policy report
22
FFiigguurree 11.. SSttaannddaarrddiizzeedd TTeesstt SSccoorreess aanndd SScchhoooollss ppeerr DDiissttrriicctt
900 950 1000 1050 1100
Average SAT Score
1150 1200 1250
does not include the District of Colombia or Hawaii
0
10
AverageSchoolsperDistrict
20
30
40
50
60
FIGURE 3.7 SAT SCORES AND SCHOOLS PER DISTRICT
FIGURE 3.8 NAEP SCORES AND SCHOOLS PER DISTRICT
FIGURE 3.9 ACT SCORES AND SCHOOLS PER DISTRICT
0
10
AverageSchoolsperDistrict
20
30
40
50
60
0
10
AverageSchoolsperDistrict
20
30
40
50
60
18 20 20.5 21.5 22 22.518.5 19 19.5 21
Average ACT Score
23
245 250 255 260 265 270 275 280 285 290
does not include the District of Colombia or HawaiiAverage NAEP 8th Grade Mathematics Score
Source: Andrew T. LeFevre and Rea S. Hederman Jr., Report Card on American
Education: A State-By-State Analysis, 1976-2001, ALEC, October 2002, p. 94.
January 12, 2004
23
Changes in Changes in
SAT Score Students per Schools per
Change 1981- District 1977- District 1977-
State 2001 (%) Rank 1999 (%) Rank 1999 (%) Rank
AL 10.5 1 -3.96 39 -6.46 9
SC 8.7 2 9.40 28 8.59 38
IL 8.7 3 11.60 26 -1.41 19
DC 8.0 4 -94.81 51 28.05 1
ID 8.0 5 23.09 17 -0.42 20
MO 7.9 6 8.33 30 -4.76 13
NC 7.5 7 33.62 11 1.90 23
MI 6.1 8 -33.10 50 -10.67 5
WI 6.0 9 4.25 33 3.10 27
GA 5.8 10 37.07 10 28.17 50
U. S. Average 2.5 18.85 4.74
TTaabbllee 22.. TToopp TTeenn SSttaatteess ffoorr PPoossiittiivvee SSAATT CChhaannggeess
Changes in Changes in
SAT Score Students per Schools per
Change 1981- District 1977- District 1977-
State 2001 (%) Rank 1999 (%) Rank 1999 (%) Rank
AZ -6.1 51 59.62 4 -3.39 15
MT -4.9 50 24.60 16 -11.70 4
WA -4.6 49 33.00 12 0 .73 22
WY -3.5 48 -1.79 35 -2.31 17
WV -2.9 47 -25.09 49 0.55 21
NV -2.6 46 120.40 1 23.89 48
UT -2.2 45 42.91 8 15.53 43
AK -2.0 44 52.64 7 34.19 51
DE -1.6 43 -8.05 43 8.60 39
SD -1.1 42 4.26 32 -6.05 11
U.S. Average 2.5 18.85 4.74
TTaabbllee 33.. TTeenn WWoorrsstt SSttaatteess ffoorr NNeeggaattiivvee SSAATT CChhaannggeess
Note: Tables based on Table 3.4 of Andrew T. LeFevre and Rea S. Hederman Jr.,
Report Card on American Education: A State-By-State Analysis, 1976-2001, ALEC,
October 2002, pp. 102-103.
In contrast to
consolidation, the
benefits of competition
upon student
performance and school
efficiency are well
documented.
GOLDWATER INSTITUTE I policy report
24
states, the average change in SAT scores
was a three percent decline, while the
best states realized an average
achievement increase of nearly eight
percent.
Corresponding to this time frame
(1977 to 1999), the average number of
students in districts with the worst SAT
changes grew nearly four times faster
than the number of schools per district.
Conversely, in states with the greatest
improvement in SAT scores, the number
of schools per district increased while the
number of students per school
decreased.
It is important to note that states
with the highest achievement losses
experienced an overall average
enrollment growth that was eight times
greater than states with the highest
achievement gains, roughly 24 percent
and three percent, respectively. High-
achieving states were well below the
national average enrollment growth of
8.6 percent from 1979 to 2002, and low
achieving states were well above the
national average.103
Nevertheless, ensuring the number
of schools per district keeps pace with
explosive growth in student enrollment
should be a primary concern for state
policymakers, especially since Arizona’s
average growth from 1979 to 2002 was
69 percent, second only to Nevada.104
CCoommppeettiittiioonn,, nnoott CCoonnssoolliiddaattiioonn,,
IImmpprroovveess tthhee CCllaassssrroooomm
Consolidation efforts are designed to
increase classroom spending by
redirecting administrative savings into
the classroom. But administrative
savings can be elusive, and if they do
materialize, there is no guarantee that
they will reach their intended
destination.105
As explained above, the trend toward
consolidation during most of the 20th
century has reduced the number of
public schools. Because enrollment has
grown steadily, the result is fewer, larger
schools. And, empirical research
indicates a negative impact of
consolidation on student achievement
scores. However, as the NCES explains,
the rising number of alternative schools
has mitigated the average increase in
school size.106
The emergence of these
schools is a recent development, but the
positive impact of even the limited
amount of competition they offer
traditional public schools is already
discernable.
In contrast to consolidation, the
benefits of competition upon student
performance and school efficiency are
well documented. In their meta-analysis
of 41 empirical studies spanning 30
years, Columbia University researchers
Clive R. Belfield and Henry M. Levin
demonstrate that the literature
overwhelmingly shows a statistically
significant, positive relationship between
competition and educational
outcomes.107
January 12, 2004
Research indicates that
not only does
educational inno-
vation and freedom
result in greater
academic achievement
for all students, the
introduction of
educational compe-
tition, such as charter
schools, scholarships,
and open enrollment,
improves productivity
for every per-pupil
dollar spent.
25
Nowhere is this trend more evident
than in Arizona. Unlike many states that
strictly regulate any competition to
public schools, Arizona lawmakers have
introduced greater competition into the
state’s education system over the last
decade. As a result, Arizona has twice
been named the national leader in
educational freedom, according to the
Manhattan Institute’s Education Freedom
Index, by Jay P. Greene.108
Research indicates that not only
does educational innovation and
freedom result in greater academic
achievement for all students, the
introduction of educational com-
petition, such as charter schools,
scholarships, and open enrollment,
improves productivity for every per-
pupil dollar spent.
As Greene demonstrates, com-
petition raises test scores without
increasing per-pupil spending. Two
public school approaches in particular
distinguish Arizona from other states
according to Greene: an unrestricted
inter-district public school choice
program and the largest number of
charter schools in the country.109
Greene finds that “a one point
increase in the EFI [Education Freedom
Index] produces the same improvement
in NAEP math results as increasing per-
pupil spending by $2,490, about a 36
percent increase in spending over the
current national average.”110
Similarly, a
state’s median household income would
have to increase by more than $6,000 to
achieve the same improvement as a one-
point increase on the EFI.
Greene’s findings, however, are not
isolated. In her study of more than
6,500 school districts nationwide,
Harvard economist Caroline Hoxby
examined the effects of inter-district
choice, or choice among various public
schools, on school productivity. She
finds that “[inter-district] choice raises
productivity [of each education dollar]
by simultaneously raising achievement
and lowering spending. The effects on
productivity, student achievement and
per-pupil spending are substantial in size
if one considers the potential of [inter-
district] choice as a policy.”111
Contrary to consolidation measures
that decrease the number of school
districts and schools, Hoxby’s research
demonstrates that school district
multiplicity raises school productivity
and academic achievement. For
example, she finds that the decrease in
per-pupil spending produced by
competition from inter-district choice
actually increases teaching resources per
student by decreasing pupil/teacher
ratios. “An increase from 0 to 1 in the
index of [inter-district] choice,”
according to Hoxby, “generates a
decrease of 2.7 students in the student-
teacher ratio.”112
Moreover, productivity
increases by at least one-quarter of a
standard deviation in states where school
districts are controlled locally, compared
with only one-tenth of a standard
deviation in consolidated, state-
controlled districts, which have less
financial independence.113
Hoxby believes, “[Inter-
district] choice among
districts is the most
powerful market force
in American public
education.” Yet, she
notes, school district
consolidation is one
factor that greatly
inhibits inter-district
choice and its
effectiveness.
GOLDWATER INSTITUTE I policy report
26
Thus, “When inter-district choice
goes from its minimum to its maximum
value (from 0 to 1), school productivity
rises by 10 percent; achievement is 3.1
to 5.8 percentile points higher; and
spending is 7.6 percent lower.”114
In fact,
Hoxby believes, “[Inter-district] choice
among districts is the most powerful
market force in American public
education.”115
Yet she notes school
district consolidation is one factor that
greatly inhibits inter-district choice and
its effectiveness.
Unfortunately, and despite new
federal mandates, in many instances
such inter-district freedom is restricted.
School districts often put up roadblocks
that make it difficult to switch to
another public school.116
Arizona’s open enrollment law is one
way to achieve significant administrative
savings through inter-district public
school competition while improving
student achievement and enhancing
local control. The state’s existing law
should be enforced more rigorously to
prevent school districts from blocking
student transfers. School districts should
become smaller to increase the
probability of having many good schools
located close by and to diminish the
undue hardships associated with
relocating, which might prevent parents
from enrolling their children in the
schools that are best for them.
Arizona’s charter schools offer
another path to administrative
efficiency. Enacted in 1994, Arizona’s
charter school legislation is considered
the nation’s strongest charter school law,
with no limit on the number of charter
schools that can be created. There has
been a meteoric rise in the number of
charter schools in Arizona, increasing by
663 percent, from 70 schools during the
1995-96 school year to more than 460
as of the 2002-03 school year.117
Charter schools are public schools
and must provide the same level of
educational quality as traditional public
schools. Yet charter schools in Arizona
receive about 80 percent of the per-
pupil funding that traditional public
schools receive, so they are forced to be
efficient.118
Last June, Manhattan Institute
scholars Jay P. Greene, Greg Forster, and
Marcus A. Winters released an in-depth
study of charter school performance,
which found that “charter schools
serving the general student population
outperformed nearby regular public
schools on math tests by . . . 3 percentile
points for a student starting at the 50th
percentile. These charter schools also
outperformed nearby regular public
schools on reading tests by . . . 2
percentile points for a student starting at
the 50th percentile.”119
Focusing on Arizona’s charter
schools and their effect on surrounding
traditional public schools, Hoxby finds
that students in both types of schools
benefit. Even after controlling for both
kinds of schools’ initial conditions, data
showed “charter competition made
Arizona public schools improve their
productivity relative to their own initial
January 12, 2004
“The top-down flow of
power and respon-
sibility in traditional
school districts has been
likened to an inverted
pyramid weighing
down on the heads of
schools.” The prevailing
bureaucratic school
district structure
impedes innovation
and would only become
more rigid under the
centralizing nature of
current Arizona
consolidation proposals.
27
proposals are designed to correct.124
Nelson Smith, vice president for
policy and governance at New American
Schools and author of the ECS study,
writes, “The top-down flow of power
and responsibility in traditional school
districts has been likened to an inverted
pyramid weighing down on the heads of
schools.”125
The prevailing bureaucratic
school district structure impedes
innovation and would only become
more rigid under the centralizing nature
of current Arizona consolidation
proposals.
In fact, this centralizing tendency is
the primary reason most large districts
nationwide are decentralizing. For
example, in July 2001, the Los Angeles
Alliance for Student Achievement
approached WestEd for recom-
mendations on improving student
performance in the Los Angeles Unified
School District (LAUSD), which has
905,020 students. Paul Koehler, former
superintendent in Peoria and associate
state superintendent in the Arizona
Department of Education, led the
WestEd project team.
In 2003, WestEd recommended
breaking up the LAUSD, implementing
a network of new charter schools, and
streamlining the charter approval
process to make it “straightforward and
timely.”126
Koehler’s team proposed,
“Taking the concept of charter schools
to the next level by thinking
systematically from the start and
creating a network of highly
accountable, independent charter
trends.”120
That is, when faced with
charter school competition, Arizona’s
regular public schools raised
productivity by improving achievement
levels within initial per-pupil spending
levels.121
Hoxby concludes that in Arizona,
“Charter competition focused on public
schools that initially had achievement
and productivity that was below average,
but charter competition induced public
schools to improve their productivity
and achievement . . . relative to the
schools’ own past performance and
relative to gains made, over the same
period, by schools that were not
subjected to charter competition.”122
Even public schools that lagged
behind other public schools improved
their student achievement dramatically
in response to charter competition. For
example, public schools with
achievement gains 0.6 percentile points
lower than public schools not facing
charter competition raised their annual
improvement on NAEP scores by 1.4
and 1.39 percentile points in fourth
grade reading and math, respectively,
once charter school competition was
introduced.123
Arizona’s charter school heritage
provides a strong foundation for
administrative streamlining in the state’s
traditional public schools. A recent series
of papers by the non-partisan Education
Commission of the States (ECS)
recommends all-charter public school
districts as an effective solution to the
very inefficiencies consolidation
By employing the
charter district model
rather than
consolidation, each
district school would be
able to tailor its
educational programs to
the particular needs of
prospective students.
Parents, in turn, would
be genuinely free to
choose any school in the
state. This would
provide a wide variety
of educational options
to all families. Schools
would be free to budget
independently and find
cost savings without
needing the approval of
a central office or
unelected board.
GOLDWATER INSTITUTE I policy report
28
schools that effectively serve students in
LAUSD’s most challenging com-
munities.” Unlike highly centralized
districts “that might not directly address
the needs of students in a particular
school community, charter schools will
receive resources that they can target
directly to programs designed with their
community in mind.”127
Ouchi and his research team
corroborate Koehler’s conclusion, based
on twenty years of data, that
decentralized districts foster the
innovation and flexibility essential to the
success of schools: “Our findings
confirm what [Richard] Daft (1982) has
asserted: that organizations that are
highly centralized and bureaucratic are
less likely to innovate and perform
effectively.” Ouchi concludes, “Most
important of all, our results suggest that
a properly organized school district can
produce superior educational results for
children, including those of low-income,
minority homes.”129
Writing for the Progressive Policy
Institute, Nelson Smith analyzed
findings from three in-depth studies on
student achievement in California
charter schools. The results show charter
schools do a superior job of educating
at-risk students than non-charter
schools.130
Furthermore, the average
Academic Performance Index (API)
gains over the past five years for charter
high schools are twice as high as other
public high schools, and while only 38
percent of California charter schools
have been in existence long enough to
test improvement over time, 70 percent
of them showed improvement over the
previous year’s scores.
There is much debate surrounding
the potential savings or costs of the
charter district model. Smith and
members of the ECS charter district
working group acknowledge potential
sources of additional savings from the
charter model: “With just a handful of
employees, the new central office itself
will cost far less than its predecessor, and
competition may well drive down the
cost of services.” In addition, charters
can compete for grants on their own.
However, facilities costs were shown to
drive up operational costs in
Massachusetts charter schools.
Members of the working group therefore
concluded that the charter district
model is a revenue-neutral reform.131
By employing the charter district
model rather than consolidation, each
district school would be able to tailor its
educational programs to the particular
needs of prospective students. Parents,
in turn, would be genuinely free to
choose any school in the state. This
would provide a wide variety of
educational options to all families.
Schools would be free to budget
independently and find cost savings
without needing the approval of a
central office or unelected board.
And, because charter schools receive
only 80 percent of traditional public
school funding, there is a potential per-
pupil fiscal savings that far surpasses that
of statewide school district
consolidation. According to data from
January 12, 2004
29
the Joint Legislative Budget Committee
(JLBC), per-pupil funding for regular
school districts in Arizona is $7,816,
compared to $6,286 for charter
schools.132
Per-pupil savings from
competition is therefore over 90 times
greater than the projected per-pupil
savings from consolidation, or $1,530
compared to an estimated $17.34.
The limited amount of choice
provided by charter schools nationwide
has already encouraged traditional
public schools to compete for students,
resulting in greater parental
satisfaction133
and improved academic
achievement.134
The success of the public
charter model underscores that the
educational goals of policymakers and
the general public can be reconciled. In
contrast to the goals of consolidation
efforts, the public wants more schools
with diverse curricula. And by virtually
eliminating an entire layer of extra
school-site administration, charter
schools achieve the primary goal of
consolidation measures: significant
administrative savings that go directly
into the classroom.
RReeccoommmmeennddaattiioonnss
Based on data presented in this
report, to achieve optimal productivity
in classrooms and administrative
programs, policymakers should consider
the following reforms.
PPrroommoottee CCoommppeettiittiioonn,, nnoott
CCoonnssoolliiddaattiioonn
Enhancing educational competition
through the promotion of inter-district
choice and charter schools has a
potential savings of $1,530 per pupil
compared to only $17.34 to $35 per
pupil from statewide consolidation
under the best-case scenario. Research
indicates that if Arizona’s system of
inter-district choice were fully exercised,
school productivity could rise by 10
percent, achievement could be three to
six percentile points higher, and
spending could be almost eight percent
lower. Strictly enforcing the state’s open
enrollment policy and improving
educational freedom in Arizona by as
little as one point on the Education
Freedom Index, would produce the same
improvement in NAEP math results as
increasing per-pupil spending by $2,490
or raising the median household income
by more than $6,000.
EEmmuullaattee BBeesstt PPrraaccttiicceess ooff EEffffiicciieenntt
SScchhoooollss ooff AAllll SSiizzeess
While statewide consolidation will
likely not result in anticipated
administrative savings, the OAG’s
reports show schools of all sizes are
cutting costs and achieving sustained
administrative efficiencies. A linear size-
cost analysis should be replaced with a
more in-depth analysis of those schools,
so that schools of all sizes could adopt
administrative best practices. Because 52
percent of all administrative costs arise at
individual schools, reform at the school
level, not the district level, could address
the major source of inefficiency.
Moreover, such a ground-up cooperative
effort within districts would make them
Per-pupil savings from
competition is therefore
over 90 times greater
than the projected per-
pupil savings from
consolidation, or
$1,530 compared to an
estimated $17.34.
Closer examination of
209 Arizona school
districts reveals that
medium districts
averaging roughly
2,400 students perform
as well as or better than
the state’s 10 largest
districts, which average
nearly 34,000 students.
These findings suggest
that administrative
savings are not simply a
matter of size.
GOLDWATER INSTITUTE I policy report
30
progressively more efficient without
stifling innovation and competition.
EExxaammiinnee tthhee PPeerrffoorrmmaannccee ooff MMeeddiiuumm--
ssiizzee DDiissttrriiccttss
Medium-size school districts may
provide an indispensable “mean-
between-the-extreme” approach to
school district efficiency. Unfortunately,
the linear size-cost analysis considers
only small or large school districts.
Closer examination of 209 Arizona
school districts reveals that medium
districts averaging roughly 2,400
students perform as well as or better
than the state’s 10 largest districts, which
average nearly 34,000 students. These
findings suggest that administrative
savings are not simply a matter of size.
While current consolidation proposals
focus on creating districts ranging from
6,000 to 30,000 students, medium
districts avoid many of the disadvantages
associated with large districts.
CCoonncclluussiioonn
Superintendent Tom Horne aptly
sums up the rationale of current school
district consolidation proposals: “People
expect the money to be spent in the
classroom on teacher compensation and
on smaller class size, rather than wasteful
administration.”
Upon closer examination, however,
consolidation appears to be at best a
marginal reform yielding negligible fiscal
savings. Economists find little evidence
that economies of scale improve school
district efficiency, and empirical
consolidation research indicates smaller,
decentralized school districts are
significantly more efficient than larger,
centralized districts. Likewise, in
Arizona, data show that small and
medium districts consistently spend as
much as or less on administration than
the state’s largest districts.
In fact, empirical research shows that
in consolidated school districts, the
result is worse education and higher, not
lower, per-pupil costs. Consolidation
and its accompanying centralization
would likely increase administration at
the expense of classroom instruction,
leading to larger classes, more
administrators, and fewer teachers.
Partly as a result of decades of
consolidation, administrators nation-
wide now equal, and in some states
exceed, teachers and instructional staff as
a proportion of school staff. This
imbalance is especially pronounced in
Arizona, which has the 10th worst
teacher-as-a-percentage-of-staff ranking
in the country.
Of paramount concern is student
achievement, and evidence suggests
smaller districts contribute to higher
SAT, ACT, and NAEP scores. For
example, comparing the 10 best and 10
worst states in terms of SAT
achievement gains from 1981 to 2001,
average SAT scores declined three
percent in states with larger school
districts, while average SAT scores
increased nearly eight percent in states
with smaller school districts.
January 12, 2004
31
Competition, rather than
consolidation, improves school
efficiency. By fully exercising Arizona’s
existing inter-district choice policy,
school efficiency could rise by 10
percent, student achievement could be
roughly three to six percentile points
higher, and spending could be almost
eight percent lower. Research also shows
that expanding Arizona’s charter schools
would improve test scores of charter
students and students attending nearby
traditional public schools by one to three
percentile points, while yielding a per-
pupil savings over 90 times greater than
that promised by consolidation
proposals, $1,530 per pupil compared to
an estimated $17.34.
It is possible that consolidation
could achieve limited administrative
savings if carefully implemented on a
case-by-case basis. Yet targeted
consolidation measures cannot approach
the potential fiscal savings from
expanding existing school choice policies
in Arizona. School district consolidation
also poses significant risks to educational
quality. Expanding options for parents
and students by encouraging growth in
the number of charter schools and fully
exercising Arizona’s existing open-
enrollment law are far more promising
ways to direct more education dollars
into the classroom.
GOLDWATER INSTITUTE I policy report
32
1. Thomas D. Synder and Charles M.
Hoffman, Digest of Education Statistics
2002, National Center for Education
Statistics (NCES), June 2003, p. 6; cf.
Tables 29-35 and Table 167.
2. Deborah K. Davenport, Auditor
General, Arizona Public School Dollars
Spent in the Classroom, March 2002, p.
ii.
3. Ibid., p. 1. The Office of the
Auditor General’s definition of “dollars
spent in the classroom” is based on
NCES categories: classroom personnel;
instructional aids; general instructional
supplies, tuition, and activities, which
includes field trips, athletics; and co-
curricular activities such as band and
choir. See p. 4.
4. Data from fiscal year 1999 was the
subject for the OAG’s previous report to
the legislature, also called Factors
Affecting School Districts’ Administrative
Costs, November 2000. Unlike its 2000
report, the 2002 OAG report, based on
fiscal year 2001 data, included
additional analysis using NCES
expenditure categories for administrative
costs in programs other than regular and
special education programs.
5. Factors Affecting, 2002, p. 16.
6. Senate Bill 1180, May 29, 2002.
7. Consolidation proponents cite
school board membership and
governance as important issues to
consider, but their primary focus is with
increasing local school district size to
achieve administrative cost savings.
Goldwater Institute education analyst
Vicki Murray met with Superintendent
Horne to discuss his consolidation
proposal on July 17, 2003. For Horne,
consolidation encompasses four core
issues: 1) reducing administrative costs;
2) fortifying student curriculum; 3)
ensuring professional school leadership;
and 4) capital finance. Martin L. Shultz,
“A Case for Unification and Where
Appropriate Consolidation of Districts
in Arizona” (unpublished paper; copy in
authors’ files), advocates increasing the
number of school governing board
members from five to nine; increasing
the governing board’s role; and
developing a Superintendent’s Institute
to “re-educate” administrators in
management and technology-assisted
instruction. See Shultz, “A Case for
Unification,” p. 3.
8. The OAG’s 2002 Factors Affecting
report is based largely on Joint
Legislative Budget Committee (JLBC)
data. Superintendent Horne explained
the need for consolidation to host
Michael Grant during the PBS KAET
public affairs show Horizon on January
22, 2003 (elipses indicate statement
quoted in text above):
Grant: You are a strong supporter
of school district consolidation.
Horne: Yes, I am . . . .
Grant: What about the local
control issue? That’s the one that is
always brought up and in fact was
mentioned in the package.
NOTES
January 12, 2004
33
Horne: Well, there is an ideal size
for a school district, sufficiently
large for economies of scale but
small enough so that people have a
say in the school district and that’s
probably around 30,000 students
or so. But we have districts with
just a few hundred students. So we
can still have local control and still
have the district be large enough so
that they have the economies of
scale.
9. Tom Horne, “Finances, quality and
politics point to consolidation,” Arizona
Republic, December 29, 2002. Though
Horne does not specify the precise size
of the small, large, and very large
districts to which he refers, according to
the OAG, small districts have between
200 and 599 average daily membership
(ADM); medium districts have between
600 and 4,999 ADM; and large districts
have 5,000 or more ADM. See n. 13
below. The NCES adds a category for
extra-large districts, which have an
ADM of 15,000 or more. See Digest of
Education Statistics 2002, Table 90. The
OAG also refers to “super-large schools,”
which have more than 40,000 students.
See Dollars Spent in the Classroom, Table
2, p. 9; cf. n. 30 below. Arizona has only
two “super-large” districts (Mesa USD
and Tucson USD).
10. John T. Wenders, “School District
Consolidation is a Bad Idea: Large
Districts Don’t Serve Students.” Internet
Education Exchange, http://www.iedx.
org/printer_friendly_1.asp?SectionGrou
pID=NEWS&ContentID=EN578,
reprinted with permission of The
Thomas B. Fordham Foundation from
Education Gadfly, vol. 3, no. 12, April
10, 2003.
11. Ibid. For more detailed information
on Los Angeles Unified School District
and Clark County School District, see
http://www.lausd.k12.ca.us/lausd/office
s/Office_of_Communications/ and
http://ccsd.net/admin/images/update02
.pdf.
12. Marvin E. Dodson III and Thomas
A. Garrett, Inefficient Education
Spending in Public School Districts: A
Case for Consolidation, The Federal
Reserve Bank of St. Louis, Working
Paper Series, 2002-010C, rev. April
2003, pp. 37-38, http://research.
stlouisfed.org/wp/2002/2002-010.pdf;
see also Wenders, “School District
Consolidation is a Bad Idea;” Mary F.
Hughes and James E. Metzger,
Restructuring: Cost Savings and Benefits,
Arkansas Public School Districts, February
2003, http://rsdweb.k12.ar.us/pdf/
Legislation/efficiency%20study.pdf;
Graham Garner, “Legislature considers
school district mergers,” Idaho State
Journal, August 22, 2003, http://www.
journalnet.com/articles/2003/03/22/ne
ws/local/news07.txt; Testimony on
School District Consolidation Before
House Committee on Education, by
Mark Thallam, Kansas Association of
School Boards, February 18, 2003,
http://www.kasb.org/districtconsolidati
ontesth.pdf; and Firstline Midwest, The
Midwestern Office of The Council of
State Governments, vol. 8, no. 3, March
2001, http://www.csgmidwest.org/mem
ber_services/flmw/2001/0301.pdf.
GOLDWATER INSTITUTE I policy report
34
13. Factors Affecting, 2002, Table 5, p.
17. Very small districts have less than
200 ADM, small districts have between
200 and 599 ADM, medium-sized
districts have between 600 and 4,999
ADM; and large districts have 5,000
ADM or more. According to the OAG’s
March 2002 report, there are 233
regular school districts in Arizona. See
Davenport, Dollars Spent in the
Classroom, p. 3. For definitions of other
kinds of school districts not examined by
the OAG, see Factors Affecting, 2002,
Appendix B, p. b-i. According to the
NCES, as of the 2000-01 school year,
there are 14,859 regular school districts
in the United States. See Digest for
Education Statistics 2002, Table 87.
Arizona’s 233 regular school districts
constitute a mere 1.6 percent of the
nationwide total, even though the state
was second only to Nevada in terms of
population growth from 1990 to 2000
(Arizona’s population growth was 40
percent and Nevada’s, 66.3 percent),
according to the U.S. Census Bureau,
Census 2000. On Arizona’s enrollment
growth, see p. 17 above and n. 104
below.
14. Factors Affecting, 2002, pp. 5 and 9.
15. Shultz, “A Case for Unification,” p.
4; Tom Horne, “Finances, quality and
politics point to consolidation,” Arizona
Republic, December 29, 2002.
16. When Goldwater Institute
education analyst Murray cited this
estimate to Superintendent Horne
during her July 17, 2003, interview, he
stated that around 40 districts or fewer
would be optimal.
17. Ibid. See also Factors Affecting,
2002, p. 3. It is interesting to note that
according to the OAG’s 2002 findings,
Arizona’s administrative spending is on
par with the national average, which has
been roughly 11 percent of education
expenditures since 1994, and
administrative costs as a part of total
educational expenditures in Arizona
have actually decreased slightly from
11.3 percent as reported by the OAG in
2000 to 10.8 percent as it reported in
2002; cf. Factors Affecting, 2000, p. 3.
18. Factors Affecting, 2002, Figure 1, p. 2.
19. Factors Affecting, 2002, p. 1 (“What
are administrative costs”).
20. The OAG reached this conclusion
even after exempting 50 of the smallest
school districts with fewer than 200
students from its analysis. See Factors
Affecting, 2002, p. 15, n. 2.
21. Factors Affecting, 2002, Figure 1,
pp. 1 and 2.
22. Ibid.
23. Ibid., p. 5.
24. Ibid., p. 3, Figure 3. Salaries
constitute nearly three-quarters of all
types of administrative costs (71
percent). Benefits are a distant second at
13 percent, followed closely by
purchased services at 11 percent,
supplies at 3 percent, and other
administrative costs at 2 percent.
January 12, 2004
35
25. Davenport, Dollars Spent in the
Classroom, p. 11.
26. See Factors Affecting, 2002, p. 3 and
Table 6. The 2001 ADMs were
calculated by taking the total cost
column amounts in Table 6 and dividing
them by the per-pupil cost amounts.
27. In a current cost-benefit analysis of
consolidation in Arkansas public school
districts, for example, school district size
is one of four separate efficiency
categories (fiscal, academic achievement,
and administrative), and was assigned
five separate efficiency indicators: ADM
per school, ADM per grade, pupil-
teacher ratio, student-administrator
ratio, and average daily attendance
(ADA). See Hughes and Metzger, Cost
Savings and Benefits, Arkansas Public
School Districts, pp. 11-13,
http://rsdweb.k12.ar.us/pdf/Legislation/
efficiency%20study.pdf.
28. On consolidation decreasing the
number of individual schools, see pp.
16.
29. Factors Affecting, 2002, Tables 1 and
2, pp. 6 and 10.
30. School district size is categorized by
ADM. See n. 13. The NCES adds a
further category for extra-large districts,
which have an ADM of 15,000 or more.
See Digest of Education Statistics 2002,
Table 90. Elsewhere, the OAG refers to
“super-large schools,” which have more
than 40,000 students. See Davenport,
Dollars Spent in the Classroom, Table 2,
p. 9.
31. Factors Affecting, 2002, Table 1, p.
6. The number of students for each
district listed in Table 1 and subsequent
tables is not provided in the OAG’s 2002
report. The 2001 ADMs were calculated
by taking the total cost column amounts
in Table 6 and dividing them by the per-
pupil cost amounts.
32. Mobile ESD, 15 students; and
Phoenix UHSD, 21,115 students.
33. Roosevelt ESD, 10,856 students;
and Phoenix UHSD, 21,115 students.
34. While nine districts were originally
selected by the OAG as having
particularly low administrative costs,
one had a data error that artificially
deflated its costs. It was therefore
removed. See Factors Affecting, 2002, p.
9.
35. Factors Affecting, 2002, Table 2, p.
10.
36. The 2001 ADM was calculated by
taking the total cost column amount in
Table 6 and dividing it by the per-pupil
cost amount.
37. Data errors were responsible for
decreasing costs in two of the five low-
cost districts, and a third district, Blue
Elementary, is unique. Since that district
has only two pupils, the county
superintendent performs the district’s
administrative duties at no charge. See
Factors Affecting, 2002, p. 11.
38. Unlike its previous analyses, the
OAG did not include supply costs when
Potential savings from consolidation overstated

More Related Content

What's hot

Dynamics of Educational Decentralisation on Effective Management of Primary S...
Dynamics of Educational Decentralisation on Effective Management of Primary S...Dynamics of Educational Decentralisation on Effective Management of Primary S...
Dynamics of Educational Decentralisation on Effective Management of Primary S...ijtsrd
 
Corruption in the Education Sector
 Corruption in the Education Sector Corruption in the Education Sector
Corruption in the Education SectorDr Lendy Spires
 
School Voucher Capstone Paper
School Voucher Capstone PaperSchool Voucher Capstone Paper
School Voucher Capstone Papercarlyle55
 
Utah Higher Ed Public Opinion Survey
Utah Higher Ed Public Opinion SurveyUtah Higher Ed Public Opinion Survey
Utah Higher Ed Public Opinion SurveyHigherEdUtah
 
Excerpted declaration with_signatures_and_districts
Excerpted declaration with_signatures_and_districtsExcerpted declaration with_signatures_and_districts
Excerpted declaration with_signatures_and_districtsEducationNC
 
20150731 Alger The Future of School Choice in Maine
20150731 Alger The Future of School Choice in Maine20150731 Alger The Future of School Choice in Maine
20150731 Alger The Future of School Choice in MaineVicki Alger
 
Belk Foundation Impact Plan
Belk Foundation Impact PlanBelk Foundation Impact Plan
Belk Foundation Impact PlanAnalisa Sorrells
 
20100101 Murray (Alger) Race to the Top - Can We Compete Nebraska’s Charter S...
20100101 Murray (Alger) Race to the Top - Can We Compete Nebraska’s Charter S...20100101 Murray (Alger) Race to the Top - Can We Compete Nebraska’s Charter S...
20100101 Murray (Alger) Race to the Top - Can We Compete Nebraska’s Charter S...Vicki Alger
 
Ceresta dpe 13_b
Ceresta dpe 13_bCeresta dpe 13_b
Ceresta dpe 13_bdefendk16
 
Megin Show - Updated Version 2
Megin Show - Updated Version 2Megin Show - Updated Version 2
Megin Show - Updated Version 2Blackboard
 
Megin Show - Version 3 Final
Megin Show - Version 3 FinalMegin Show - Version 3 Final
Megin Show - Version 3 FinalBlackboard
 
Megin Version 4
Megin Version 4Megin Version 4
Megin Version 4Blackboard
 
How public schools benefit local economies
How public schools benefit local economiesHow public schools benefit local economies
How public schools benefit local economieslexie4
 
20110128 10 Questions State Legislators Should Ask About Higher Education
20110128 10 Questions State Legislators Should Ask About Higher Education20110128 10 Questions State Legislators Should Ask About Higher Education
20110128 10 Questions State Legislators Should Ask About Higher EducationVicki Alger
 
The 3 E's, I love E- Economic, Education, Ethics
The 3 E's, I love E- Economic, Education, EthicsThe 3 E's, I love E- Economic, Education, Ethics
The 3 E's, I love E- Economic, Education, EthicsE.S.G. JR. Consulting, Inc.
 
The Perception of Stakeholders’ on Academic Performance of Junior high Schoo...
The Perception of Stakeholders’ on Academic Performance of  Junior high Schoo...The Perception of Stakeholders’ on Academic Performance of  Junior high Schoo...
The Perception of Stakeholders’ on Academic Performance of Junior high Schoo...AI Publications
 

What's hot (20)

Dynamics of Educational Decentralisation on Effective Management of Primary S...
Dynamics of Educational Decentralisation on Effective Management of Primary S...Dynamics of Educational Decentralisation on Effective Management of Primary S...
Dynamics of Educational Decentralisation on Effective Management of Primary S...
 
Corruption in the Education Sector
 Corruption in the Education Sector Corruption in the Education Sector
Corruption in the Education Sector
 
School Voucher Capstone Paper
School Voucher Capstone PaperSchool Voucher Capstone Paper
School Voucher Capstone Paper
 
Utah Higher Ed Public Opinion Survey
Utah Higher Ed Public Opinion SurveyUtah Higher Ed Public Opinion Survey
Utah Higher Ed Public Opinion Survey
 
12139
1213912139
12139
 
Stuart LCFF FINAL_12-10-2014
Stuart LCFF FINAL_12-10-2014Stuart LCFF FINAL_12-10-2014
Stuart LCFF FINAL_12-10-2014
 
Excerpted declaration with_signatures_and_districts
Excerpted declaration with_signatures_and_districtsExcerpted declaration with_signatures_and_districts
Excerpted declaration with_signatures_and_districts
 
20150731 Alger The Future of School Choice in Maine
20150731 Alger The Future of School Choice in Maine20150731 Alger The Future of School Choice in Maine
20150731 Alger The Future of School Choice in Maine
 
Belk Foundation Impact Plan
Belk Foundation Impact PlanBelk Foundation Impact Plan
Belk Foundation Impact Plan
 
20100101 Murray (Alger) Race to the Top - Can We Compete Nebraska’s Charter S...
20100101 Murray (Alger) Race to the Top - Can We Compete Nebraska’s Charter S...20100101 Murray (Alger) Race to the Top - Can We Compete Nebraska’s Charter S...
20100101 Murray (Alger) Race to the Top - Can We Compete Nebraska’s Charter S...
 
Ceresta dpe 13_b
Ceresta dpe 13_bCeresta dpe 13_b
Ceresta dpe 13_b
 
IAU_KU_2011_Gichuhi
IAU_KU_2011_GichuhiIAU_KU_2011_Gichuhi
IAU_KU_2011_Gichuhi
 
Megin Show - Updated Version 2
Megin Show - Updated Version 2Megin Show - Updated Version 2
Megin Show - Updated Version 2
 
Megin Show - Version 3 Final
Megin Show - Version 3 FinalMegin Show - Version 3 Final
Megin Show - Version 3 Final
 
SP Research Paper
SP Research PaperSP Research Paper
SP Research Paper
 
Megin Version 4
Megin Version 4Megin Version 4
Megin Version 4
 
How public schools benefit local economies
How public schools benefit local economiesHow public schools benefit local economies
How public schools benefit local economies
 
20110128 10 Questions State Legislators Should Ask About Higher Education
20110128 10 Questions State Legislators Should Ask About Higher Education20110128 10 Questions State Legislators Should Ask About Higher Education
20110128 10 Questions State Legislators Should Ask About Higher Education
 
The 3 E's, I love E- Economic, Education, Ethics
The 3 E's, I love E- Economic, Education, EthicsThe 3 E's, I love E- Economic, Education, Ethics
The 3 E's, I love E- Economic, Education, Ethics
 
The Perception of Stakeholders’ on Academic Performance of Junior high Schoo...
The Perception of Stakeholders’ on Academic Performance of  Junior high Schoo...The Perception of Stakeholders’ on Academic Performance of  Junior high Schoo...
The Perception of Stakeholders’ on Academic Performance of Junior high Schoo...
 

Viewers also liked

20110830 Alger Safety Opportunity Scholarships (SOS) How States Can Fulfill t...
20110830 Alger Safety Opportunity Scholarships (SOS) How States Can Fulfill t...20110830 Alger Safety Opportunity Scholarships (SOS) How States Can Fulfill t...
20110830 Alger Safety Opportunity Scholarships (SOS) How States Can Fulfill t...Vicki Alger
 
2015+Popcorn+Unit+Leader+Guide+-FINAL+-+8-11-15 compressed
2015+Popcorn+Unit+Leader+Guide+-FINAL+-+8-11-15 compressed2015+Popcorn+Unit+Leader+Guide+-FINAL+-+8-11-15 compressed
2015+Popcorn+Unit+Leader+Guide+-FINAL+-+8-11-15 compressedHerbert Kemp III, MSM
 
20130212 Comparing Public and Private Schools in Omaha
20130212 Comparing Public and Private Schools in Omaha20130212 Comparing Public and Private Schools in Omaha
20130212 Comparing Public and Private Schools in OmahaVicki Alger
 
20120109 Teacher Selection and Evaluation in Nebraska
20120109 Teacher Selection and Evaluation in Nebraska20120109 Teacher Selection and Evaluation in Nebraska
20120109 Teacher Selection and Evaluation in NebraskaVicki Alger
 
20120807 Alger Student Loans and College Affordability
20120807 Alger Student Loans and College Affordability20120807 Alger Student Loans and College Affordability
20120807 Alger Student Loans and College AffordabilityVicki Alger
 
20050105 Murray Survey of Arizona Private Schools Tuition, Testing and Curricula
20050105 Murray Survey of Arizona Private Schools Tuition, Testing and Curricula20050105 Murray Survey of Arizona Private Schools Tuition, Testing and Curricula
20050105 Murray Survey of Arizona Private Schools Tuition, Testing and CurriculaVicki Alger
 
20100630 Fostering Opportunity and Improving Achievement The Benefits of a Fo...
20100630 Fostering Opportunity and Improving Achievement The Benefits of a Fo...20100630 Fostering Opportunity and Improving Achievement The Benefits of a Fo...
20100630 Fostering Opportunity and Improving Achievement The Benefits of a Fo...Vicki Alger
 
20140428 Alger Ending Nebraska's Achievement Gap
20140428 Alger Ending Nebraska's Achievement Gap20140428 Alger Ending Nebraska's Achievement Gap
20140428 Alger Ending Nebraska's Achievement GapVicki Alger
 
20130718 Alger Time to Retire, Not Reauthorize, No Child Left Behind
20130718 Alger Time to Retire, Not Reauthorize, No Child Left Behind20130718 Alger Time to Retire, Not Reauthorize, No Child Left Behind
20130718 Alger Time to Retire, Not Reauthorize, No Child Left BehindVicki Alger
 
20060417 Murray Opening the Books 2006 Annual Report on Arizona Public School...
20060417 Murray Opening the Books 2006 Annual Report on Arizona Public School...20060417 Murray Opening the Books 2006 Annual Report on Arizona Public School...
20060417 Murray Opening the Books 2006 Annual Report on Arizona Public School...Vicki Alger
 
20050119 Murray and Aud A Guide to Understanding State Funding of Arizona Pub...
20050119 Murray and Aud A Guide to Understanding State Funding of Arizona Pub...20050119 Murray and Aud A Guide to Understanding State Funding of Arizona Pub...
20050119 Murray and Aud A Guide to Understanding State Funding of Arizona Pub...Vicki Alger
 
Deep Dive Into Android Design Support Library And AppCompat
Deep Dive Into Android Design Support Library And AppCompatDeep Dive Into Android Design Support Library And AppCompat
Deep Dive Into Android Design Support Library And AppCompatFernando Cesar da Silva
 

Viewers also liked (14)

20110830 Alger Safety Opportunity Scholarships (SOS) How States Can Fulfill t...
20110830 Alger Safety Opportunity Scholarships (SOS) How States Can Fulfill t...20110830 Alger Safety Opportunity Scholarships (SOS) How States Can Fulfill t...
20110830 Alger Safety Opportunity Scholarships (SOS) How States Can Fulfill t...
 
2015+Popcorn+Unit+Leader+Guide+-FINAL+-+8-11-15 compressed
2015+Popcorn+Unit+Leader+Guide+-FINAL+-+8-11-15 compressed2015+Popcorn+Unit+Leader+Guide+-FINAL+-+8-11-15 compressed
2015+Popcorn+Unit+Leader+Guide+-FINAL+-+8-11-15 compressed
 
20130212 Comparing Public and Private Schools in Omaha
20130212 Comparing Public and Private Schools in Omaha20130212 Comparing Public and Private Schools in Omaha
20130212 Comparing Public and Private Schools in Omaha
 
20120109 Teacher Selection and Evaluation in Nebraska
20120109 Teacher Selection and Evaluation in Nebraska20120109 Teacher Selection and Evaluation in Nebraska
20120109 Teacher Selection and Evaluation in Nebraska
 
20120807 Alger Student Loans and College Affordability
20120807 Alger Student Loans and College Affordability20120807 Alger Student Loans and College Affordability
20120807 Alger Student Loans and College Affordability
 
20050105 Murray Survey of Arizona Private Schools Tuition, Testing and Curricula
20050105 Murray Survey of Arizona Private Schools Tuition, Testing and Curricula20050105 Murray Survey of Arizona Private Schools Tuition, Testing and Curricula
20050105 Murray Survey of Arizona Private Schools Tuition, Testing and Curricula
 
20100630 Fostering Opportunity and Improving Achievement The Benefits of a Fo...
20100630 Fostering Opportunity and Improving Achievement The Benefits of a Fo...20100630 Fostering Opportunity and Improving Achievement The Benefits of a Fo...
20100630 Fostering Opportunity and Improving Achievement The Benefits of a Fo...
 
20140428 Alger Ending Nebraska's Achievement Gap
20140428 Alger Ending Nebraska's Achievement Gap20140428 Alger Ending Nebraska's Achievement Gap
20140428 Alger Ending Nebraska's Achievement Gap
 
20130718 Alger Time to Retire, Not Reauthorize, No Child Left Behind
20130718 Alger Time to Retire, Not Reauthorize, No Child Left Behind20130718 Alger Time to Retire, Not Reauthorize, No Child Left Behind
20130718 Alger Time to Retire, Not Reauthorize, No Child Left Behind
 
Resume
ResumeResume
Resume
 
20060417 Murray Opening the Books 2006 Annual Report on Arizona Public School...
20060417 Murray Opening the Books 2006 Annual Report on Arizona Public School...20060417 Murray Opening the Books 2006 Annual Report on Arizona Public School...
20060417 Murray Opening the Books 2006 Annual Report on Arizona Public School...
 
20050119 Murray and Aud A Guide to Understanding State Funding of Arizona Pub...
20050119 Murray and Aud A Guide to Understanding State Funding of Arizona Pub...20050119 Murray and Aud A Guide to Understanding State Funding of Arizona Pub...
20050119 Murray and Aud A Guide to Understanding State Funding of Arizona Pub...
 
Deep Dive Into Android Design Support Library And AppCompat
Deep Dive Into Android Design Support Library And AppCompatDeep Dive Into Android Design Support Library And AppCompat
Deep Dive Into Android Design Support Library And AppCompat
 
Construindo App's Android com Firebase
Construindo App's Android com FirebaseConstruindo App's Android com Firebase
Construindo App's Android com Firebase
 

Similar to Potential savings from consolidation overstated

20050317 A Case Study of Arizona’s School District Consolidation Debate SWPSA
20050317 A Case Study of Arizona’s School District Consolidation Debate SWPSA20050317 A Case Study of Arizona’s School District Consolidation Debate SWPSA
20050317 A Case Study of Arizona’s School District Consolidation Debate SWPSAVicki Alger
 
The Fiscal Externalities of Charter Schools: Evidence from North Carolina
The Fiscal Externalities of Charter Schools: Evidence from North CarolinaThe Fiscal Externalities of Charter Schools: Evidence from North Carolina
The Fiscal Externalities of Charter Schools: Evidence from North CarolinaAnalisa Sorrells
 
Matthew_Sullivan_Honors_Thesis
Matthew_Sullivan_Honors_ThesisMatthew_Sullivan_Honors_Thesis
Matthew_Sullivan_Honors_ThesisMatthew Sullivan
 
Development and impact of conceptual theories of state support
Development and impact of conceptual theories of state supportDevelopment and impact of conceptual theories of state support
Development and impact of conceptual theories of state supportMarilyn Sicat
 
Citation (APA) Greenlee, B. J. (2007). When school advisory co.docx
Citation (APA) Greenlee, B. J. (2007). When school advisory co.docxCitation (APA) Greenlee, B. J. (2007). When school advisory co.docx
Citation (APA) Greenlee, B. J. (2007). When school advisory co.docxmonicafrancis71118
 
Flypaper_Effect_09152012
Flypaper_Effect_09152012Flypaper_Effect_09152012
Flypaper_Effect_09152012Sean Sall
 
Greg Abbott Educating Texans Plan Governance List of Recommendations
Greg Abbott Educating Texans Plan Governance List of RecommendationsGreg Abbott Educating Texans Plan Governance List of Recommendations
Greg Abbott Educating Texans Plan Governance List of RecommendationsTam Nguyen
 
20090420 10 Questions State Legislators Should Ask About Higher Education
20090420 10 Questions State Legislators Should Ask About Higher Education20090420 10 Questions State Legislators Should Ask About Higher Education
20090420 10 Questions State Legislators Should Ask About Higher EducationVicki Alger
 
US Education Reform Essay
US Education Reform EssayUS Education Reform Essay
US Education Reform EssayQ.Marie Patton
 
Module OverviewLiberal and Market Models of Higher Education .docx
Module OverviewLiberal and Market Models of Higher Education .docxModule OverviewLiberal and Market Models of Higher Education .docx
Module OverviewLiberal and Market Models of Higher Education .docxaudeleypearl
 
Charters.TitleI.Riddle.2015
Charters.TitleI.Riddle.2015Charters.TitleI.Riddle.2015
Charters.TitleI.Riddle.2015Wayne Riddle
 
Institutional Retention Strategies at Historically Black Colleges and Univers...
Institutional Retention Strategies at Historically Black Colleges and Univers...Institutional Retention Strategies at Historically Black Colleges and Univers...
Institutional Retention Strategies at Historically Black Colleges and Univers...Dawn Follin
 
Dr Steve Smith Consolidation Facts
Dr Steve Smith Consolidation FactsDr Steve Smith Consolidation Facts
Dr Steve Smith Consolidation FactsAl Rowell
 

Similar to Potential savings from consolidation overstated (20)

20050317 A Case Study of Arizona’s School District Consolidation Debate SWPSA
20050317 A Case Study of Arizona’s School District Consolidation Debate SWPSA20050317 A Case Study of Arizona’s School District Consolidation Debate SWPSA
20050317 A Case Study of Arizona’s School District Consolidation Debate SWPSA
 
The Fiscal Externalities of Charter Schools: Evidence from North Carolina
The Fiscal Externalities of Charter Schools: Evidence from North CarolinaThe Fiscal Externalities of Charter Schools: Evidence from North Carolina
The Fiscal Externalities of Charter Schools: Evidence from North Carolina
 
Wp 182
Wp 182Wp 182
Wp 182
 
Do School Districts Matter?
Do School Districts Matter?Do School Districts Matter?
Do School Districts Matter?
 
Matthew_Sullivan_Honors_Thesis
Matthew_Sullivan_Honors_ThesisMatthew_Sullivan_Honors_Thesis
Matthew_Sullivan_Honors_Thesis
 
Development and impact of conceptual theories of state support
Development and impact of conceptual theories of state supportDevelopment and impact of conceptual theories of state support
Development and impact of conceptual theories of state support
 
Finished pp
Finished ppFinished pp
Finished pp
 
Citation (APA) Greenlee, B. J. (2007). When school advisory co.docx
Citation (APA) Greenlee, B. J. (2007). When school advisory co.docxCitation (APA) Greenlee, B. J. (2007). When school advisory co.docx
Citation (APA) Greenlee, B. J. (2007). When school advisory co.docx
 
Brockington.White Paper
Brockington.White PaperBrockington.White Paper
Brockington.White Paper
 
Flypaper_Effect_09152012
Flypaper_Effect_09152012Flypaper_Effect_09152012
Flypaper_Effect_09152012
 
Greg Abbott Educating Texans Plan Governance List of Recommendations
Greg Abbott Educating Texans Plan Governance List of RecommendationsGreg Abbott Educating Texans Plan Governance List of Recommendations
Greg Abbott Educating Texans Plan Governance List of Recommendations
 
20090420 10 Questions State Legislators Should Ask About Higher Education
20090420 10 Questions State Legislators Should Ask About Higher Education20090420 10 Questions State Legislators Should Ask About Higher Education
20090420 10 Questions State Legislators Should Ask About Higher Education
 
ihenacho_Writing_Sample
ihenacho_Writing_Sampleihenacho_Writing_Sample
ihenacho_Writing_Sample
 
US Education Reform Essay
US Education Reform EssayUS Education Reform Essay
US Education Reform Essay
 
Where Does the Education Dollar Go?
Where Does the Education Dollar Go?Where Does the Education Dollar Go?
Where Does the Education Dollar Go?
 
Module OverviewLiberal and Market Models of Higher Education .docx
Module OverviewLiberal and Market Models of Higher Education .docxModule OverviewLiberal and Market Models of Higher Education .docx
Module OverviewLiberal and Market Models of Higher Education .docx
 
Charters.TitleI.Riddle.2015
Charters.TitleI.Riddle.2015Charters.TitleI.Riddle.2015
Charters.TitleI.Riddle.2015
 
Institutional Retention Strategies at Historically Black Colleges and Univers...
Institutional Retention Strategies at Historically Black Colleges and Univers...Institutional Retention Strategies at Historically Black Colleges and Univers...
Institutional Retention Strategies at Historically Black Colleges and Univers...
 
ihenacho_Writing_Sample
ihenacho_Writing_Sampleihenacho_Writing_Sample
ihenacho_Writing_Sample
 
Dr Steve Smith Consolidation Facts
Dr Steve Smith Consolidation FactsDr Steve Smith Consolidation Facts
Dr Steve Smith Consolidation Facts
 

Potential savings from consolidation overstated

  • 1. POLICYreportG o l d w a t e r I n s t i t u t e No . 1 8 9 I Ja n u a r y 1 2 , 2 0 0 4 Competition or Consolidation? The School District Consolidation Debate Revisited by Vicki Murray, Ph.D., Education Analyst, Goldwater Institute, and Ross Groen, Education Researcher, Goldwater Institute EXECUTIVE SUMMARY In November 2002, the Arizona Office of the Auditor General (OAG) released a report on school districts’ administrative spending that found, on average, small school districts spent more per pupil than large districts. In response, the Arizona State Legislature established a commission to study the potential savings from statewide school district consolidation. Understandably, taxpayers want education dollars spent in the classroom, on teacher compensation and smaller class size, not on wasteful administration. Current proposals by the state superintendent of public instruction, Tom Horne, and Pinnacle West Capital Corporation’s vice president of government affairs, Martin L. Shultz, therefore attempt to reduce administrative costs from roughly 11 percent to five percent of Arizona’s education spending to redirect the savings into the classroom. A closer examination of the OAG report suggests statewide school district consolidation is unlikely to produce the hoped-for fiscal savings. Moreover, empirical research shows consolidation increases administrative costs at the expense of classroom instruction, yielding larger classes, fewer teachers, and lower student achievement. Therefore, consolidation is a marginal reform, best implemented on a limited, case-by-case basis. Research shows that competition, not consolidation, improves school efficiency. By fully exercising Arizona’s existing open enrollment law, school efficiency could rise by 10 percent, achievement could be roughly three to six percentile points higher, and spending could be almost eight percent lower. Expanding Arizona’s charter schools could improve test scores of charter students and students attending nearby traditional public schools by one to three percentile points, while yielding a per-pupil savings of $1,530 – more than 90 times greater than the estimated $17.34 per-pupil savings from current consolidation proposals. Like policymakers in Arizona, policymakers in dozens of other states are weighing the potential savings from projected administrative efficiencies against the potential pitfalls of consolidation. What is the potential fiscal impact of statewide school district consolidation for Arizona? What other educational quality issues might be affected? This study examines those questions.
  • 2. GOLDWATER INSTITUTE I policy report 2 IInnttrroodduuccttiioonn Over the past 50 years, public schools nationwide have borne the responsibility for a growing number of non-instructional programs, including provision of transportation, meals, and numerous health and social services. While state and federal governments have dramatically increased funding for such programs, the corresponding administrative staff charged with oversight has grown disproportionately large and, in effect, now competes for limited resources with instructional programs.1 Arizona’s Office of the Auditor General (OAG) confirmed this trend in its March 2002 report, Arizona Public School Dollars Spent in the Classroom. According to the OAG, “Higher expenditures for certain non- instructional costs, such as food service, transportation and administration were associated with lower classroom dollar spending.”2 As a result, “Arizona has historically been below the national average for spending on instruction.”3 In a subsequent analysis, Factors Affecting School Districts’ Costs, the OAG paid special attention to districts with unusually high or low per-pupil administrative costs in 2001, as well as school districts in which per-pupil administrative costs increased or decreased compared with 1999 data.4 It found that administrative costs varied widely among Arizona’s school districts, with some districts spending as little as $1 on administration for every $7 spent on instruction, and others spending as much as $1 on administration for every $3 dollars spent on instruction.5 In response, the Arizona legislature established a 19-member School District Unification and Consolidation Com- mission to study potential savings associated with the reduction of school administration and personnel.6 Consolidation proposals under consideration, such as those proposed by the state superintendent of public instruction, Tom Horne, and Pinnacle West Capital Corporation’s vice president of government affairs Martin L. Shultz, rely heavily on select OAG findings that larger school districts have lower administrative costs. While those consolidation plans address related educational issues, each focuses on achieving “economies of scale” by increasing school district size to generate administrative savings. According to Shultz, “A central issue in this debate centers on the effective and efficient use of faculty and administrative resources and how to spread necessary fixed costs over a larger base to produce dollars to go directly into the classroom.”7 Superintendent Horne concurs: CCoommppeettiittiioonn oorr CCoonnssoolliiddaattiioonn?? TThhee SScchhooooll DDiissttrriicctt CCoonnssoolliiddaattiioonn DDeebbaattee RReevviissiitteedd by Vicki Murray, Ph.D., Education Analyst, Goldwater Institute, and Ross Groen, Education Researcher, Goldwater Institute
  • 3. January 12, 2004 Like policymakers in Arizona, policymakers in other states must weigh the potential savings from projected administrative efficiencies against the potential pitfalls of consolidation. What is the potential fiscal impact of statewide school district consol- idation for Arizona, and what other educational quality issues, such as class size and local control, might be affected? 3 The first reason [for consolidating school districts] is the efficiency. The Joint Legislative Budget Committee did a study very recently where they found efficient large districts spend $300 and some per pupil on administration, where some of the smaller districts spend as much as $1,000 per student on administration. We only give $4,700 per student. So a thousand dollars is a big chunk out of the budget. People expect the money to be spent in the classroom on teacher compensation and on smaller class size, rather than wasteful administration.8 To illustrate, Horne compares the average per-pupil administrative costs for 88 school districts – 51 small, 36 large, and one very large.9 The small districts averaged $1,297 per pupil on administrative costs, while the large districts averaged $517, and the very large district averaged $368. This means the very large district spent an estimated eight percent of its revenue on administration, the large districts spent 11 percent, and the small district spent 28 percent. Thus, consolidation proponents maintain that overall administrative spending would decline if Arizona’s smaller school districts were either absorbed by larger districts or combined to create larger districts. While the OAG’s 2002 report helped bring school district consolidation to the forefront of Arizona’s education debate, the issue is more than a century old and has been considered in nearly every state. For example, New York recently consolidated its community districts into a single centralized system, and Michigan awards a per-pupil bonus for districts that consolidate.10 Wyoming’s legislature, however, recently defeated consolidation legis- lation, while Oregon is considering ways to reduce the size of its expanding school districts. In California, efforts are underway to divide one of the country’s largest school districts, Los Angeles Unified School District, with 905,020 students, into 30 separate districts. Nevada is also considering measures to reduce the size of one of its largest districts, Clark County School District, which has 244,684 students.11 Arkansas, Idaho, Iowa, Kansas, and South Dakota are among a growing number of states still grappling with this issue. Like policymakers in Arizona, policymakers in those and other states must weigh the potential savings from projected administrative efficiencies against the potential pitfalls of consolidation. These include loss of local control and representation, increased travel times for students, and even decreased child safety because of the increased distance between home and school.12 Those are just some of the stated reasons why some states are consolidating school districts, while others are breaking them up. What is the potential fiscal impact of statewide
  • 4. GOLDWATER INSTITUTE I policy report 4 school district consolidation for Arizona, and what other educational quality issues, such as class size and local control, might be affected? TThhee PPootteennttiiaall FFiissccaall IImmppaacctt ooff SSttaatteewwiiddee SScchhooooll DDiissttrriicctt CCoonnssoolliiddaattiioonn Statewide, administration spending per pupil varies widely, from as little as $360 per pupil to $6,013 per pupil. The OAG concluded in both its 2000 and 2002 reports that, in general, districts with higher administrative costs are usually smaller, while districts with lower administrative costs are typically larger. The OAG examined 209 of Arizona’s 233 regular school districts that range broadly in size, or average daily membership (ADM); 51 are very small, 37 are small, 85 are medium- sized, and 36 are large districts (13 of which have 15,000 students or more enrolled).13 It concluded that districts with high costs typically serve fewer than 600 students and those with low costs serve 5,000 or more students.14 Based in part on these findings, the Shultz consolidation plan recommends school districts be combined to serve between 6,000 and 30,000 students, while Horne prefers closer to 30,000 students.15 If either of those recommendations were implemented, however, all very small, small, and medium districts would be eliminated, as well as some large districts. Such eliminations translate into an estimated 83 percent reduction in the number of school districts, from well over 200 to roughly 40.16 Horne believes that school district consolidation of this magnitude would ultimately bring administrative costs down from an estimated 11 percent to five percent of Arizona’s education spending.17 If successful, such a reduction would make Arizona a national leader in administrative efficiency. But will such savings be realized through statewide school district consolidation, and will those savings actually reach the state’s classrooms? A closer examination of the OAG’s findings from its 2000 and 2002 reports on school districts’ administrative costs reveals that the relationship between school district size and administrative costs is more complex than it seems. The factors affecting administrative costs are many, and for this reason, statewide consolidation efforts may not produce the hoped-for fiscal savings. According to the OAG, administrative costs arise from three sources: the individual school, the district, and the governing board, which includes superintendents’ offices.18 The largest portion of administrative expenses, 52 percent, occurs at the individual school level. Those administrative costs include salaries and benefits for principals, clerical support staff, and assistants, who oversee school If consolidation were implemented, all very small, small, and medium districts would be eliminated, as well as some large districts. Such eliminations translate into an estimated 83 percent reduction in the number of school districts, from well over 200 to roughly 40.
  • 5. January 12, 2004 5 Because the majority of all administrative costs (52 percent) occurs at the individual school level, current consol- idation proposals would address less than half of all administrative costs. Their potential fiscal impact is further diminished because these proposals do not target the most expensive types of administrative costs. operations, activities, and staff evaluations.19 Importantly, in its analysis of accounting data from 206 school districts on factors influencing administrative costs, the OAG identified the size of individual schools, not districts, as a key factor.20 In contrast, business and central support services constitute 33 percent of administrative costs and occur predominately at the district level. Business support services include budgeting and payroll; purchasing, storing, and distributing equipment, supplies, and furniture; and publishing and printing. Central support services include planning, research, and evaluation services; publicizing educational and administrative issues to students, staff, and the public; personnel recruiting, placement, and training; and data processing.21 Expenses related to governing boards and superintendents’ offices, which also occur at the district level, account for only 15 percent of administrative costs. Those costs include elections, staff relations, and secretarial, legal, audit, and other services. They also include superintendent salaries, benefits, and office expenses, in addition to lobbying expenses and expenses related to community, state, and federal relations.22 Because the majority of all administrative costs (52 percent) occurs at the individual school level, current consolidation proposals would address less than half of all administrative costs. Their potential fiscal impact is further diminished because these proposals do not target the most expensive types of administrative costs.23 The primary goal of proposed consolidation measures is to produce greater economies of scale. As the OAG explains, “Districts have certain functions that must be performed, such as purchasing supplies and accounting for the expenditure of public monies [which requires purchasing the service of accountants]. Consequently, small districts are more likely to have higher per-pupil administrative costs because there are fewer students over which to spread these costs.”24 A review of the OAG’s findings on school districts’ administrative costs, however, indicates that the potential fiscal impact of current consolidation proposals has been greatly overstated. Purchased services and supplies costs, such as those described by the OAG above, constitute only 14 percent of all types of administrative costs. In contrast, salaries and benefits constitute 84 percent of administrative costs. Proponents will counter that a secondary consequence of consolidation is the reduction in the number of schools, and therefore, overall administrative staff. As described extensively below, empirical research demonstrates that this is not the case. On the contrary, consolidation efforts in other states have resulted in larger, not smaller administrative staffs, further eroding already meager projected economies-of-scale savings.
  • 6. GOLDWATER INSTITUTE I policy report 6 Current consolidation proposals designed to redirect administrative savings to the classroom presume it is possible to reverse the OAG’s administration-to-classroom-dollars formula: “For every one percent increase in administrative costs, there is a .5 percent reduction in the classroom dollar percentage.”25 That is, for every dollar saved on administration, fifty cents could be redirected to the classroom. Thus, in theory, only half of any administrative savings from consolidation would be available for the classroom. If realized, based on available OAG data, these savings would redirect only $17.34 more to each student in the Arizona public school system. According to Joint Legislative Budget Committee (JLBC) calculations, the total administrative costs for the 209 districts studied by the OAG in its 2002 report amounted to $395 million. A 14 percent reduction in administrative purchased service and supplies costs is actually only a seven percent reduction, because only the district level is targeted, and that is the source of less than half of all administrative costs. Divided among the 797,102 students enrolled at schools in the 209 districts studied by the OAG for the 2001-02 school year, this figure amounts to $34.69 extra per pupil. However, any potential savings must be reduced once more because, as suggested above, only half of any administrative savings would reach the classroom, resulting in a savings of $17.34 savings per pupil. Furthermore, the projected savings of $17.34 to $34.69 per pupil is valid only if the most expensive types of administrative costs-salaries, benefits, and staffing levels-remain constant at both the district and individual school levels.26 By focusing exclusively on the potential administrative savings from making school districts larger, current consolidation proposals overlook the most expensive types of administrative costs. A closer examination of the OAG’s sample school districts reveals that the relationship between school district size and administrative costs is not as linear as consolidation proposals presume, so even the potential savings of $17.34 to $34.69 per student is likely overstated.27 Moreover, school district consolidation reduces the number of individual schools and makes them significantly larger, as described in greater detail below.28 As a result, consolidation could adversely affect student achievement, classroom size, and administrative efficiency. SScchhooooll DDiissttrriicctt SSiizzee iiss aa PPoooorr PPrreeddiiccttoorr ooff AAddmmiinniissttrraattiivvee CCoossttss Turning to the sample districts the OAG selected for closer examination, it becomes clear that size is only one factor affecting school district administrative costs. To determine the factors affecting high or low per-pupil administrative costs, the OAG selected a sample of 20 school districts statewide, 11 with high A closer examination of the OAG’s sample school districts reveals that the relationship between school district size and administrative costs is not as linear as consolidation proposals presume, so even the potential savings of $17.34 to $34.69 per student is likely overstated.
  • 7. January 12, 2004 7 costs and nine with low costs.29 While it identified six factors that contribute to higher administrative costs (size, salaries, staffing level, benefits, purchased services, and supplies), the OAG focused on size.30 Of the 11 sample districts singled out in the OAG report for high administrative costs, nine are classified as small.31 Given OAG’s general conclusion about district size and administrative costs, one might expect that only the smallest districts would stand out for high administrative costs. This is not the case. Districts having high administrative costs ranged in size from 15 to 21,115 students.32 In fact, a large district and even an extra-large district are cited as having unusually high administrative costs.33 Common sense dictates that textbooks, transportation, and cartons of milk would all be less expensive if bought in bulk, as would contracting for services. If small size makes it more difficult for some districts to achieve economies of scale, then all of the small and very small districts listed by the OAG as having unusually high costs should also have higher-than-average costs relating to purchased services and supplies. Again, this is not the case. Only four of the nine smaller districts had higher than average supplies costs, while six of the nine had higher than average purchased services costs. In contrast, both of the large and extra-large districts in this group had higher than average purchased services costs. The large district also had higher than average supplies costs. These findings suggest size alone is not a reliable indicator of administrative efficiency. An examination of sample school districts selected by the OAG for having lower than average administrative costs also indicates that size alone does not predict efficiency. Of the eight districts selected by the OAG for low admin- istrative costs,34 one was very small, three were medium, one was large, and four were very large.35 The common denominator for all lower-spending districts, including small districts, was lower than average services and supplies costs, not size. In fact, the only low- spending district listed that was not cited as also having low purchased services costs was a large district.36 Similarly, among the sample districts that had changing administrative costs, either higher or lower in 1999 than 2001, the OAG identified nine with increased costs and two with decreased costs.37 Among the districts identified as having growing administrative costs were districts of all sizes: three very small districts, four small districts, one large district, and one very large district. Smaller district size was common to six of the nine higher-cost districts. Yet, if small district size alone caused higher administrative costs, other costs such as salaries, benefits, and purchased services would have remained constant. They did not. Smaller district size was common to six of the nine higher-cost districts. Yet, if small district size alone caused higher administrative costs, other costs such as salaries, benefits, and purchased services would have remained constant. They did not.
  • 8. GOLDWATER INSTITUTE I policy report 8 Contrary to expectations, the only districts that reduced administrative costs during this period were two smaller districts. And just one of the two lower- spending districts experienced an increase in size, which further suggests that district size alone is not sufficient to affect significant cost changes over time. In fact, among the 11 sample districts selected for changing administrative costs, fluctuating district size was a factor common to only seven of them. Changes in purchased services were common to 10 of the 11 sample high- cost districts studied, yet the only district that did not experience increased purchased services costs was a very small district. Likewise, both of the districts with reduced administrative costs experienced lower purchased services costs.38 Thus, the relationship between administrative costs and school district size is not as simple as it initially appears. Such is the case even with regard to fixed administrative costs, namely purchased services and supplies, where larger districts would be expected to achieve significant cost reductions through economies of scale alone. The failure of the larger districts to realize savings in these types of administrative costs indicates that district size alone is an insufficient factor in controlling administrative costs. This failure further suggests that other, more significant costs besides purchased service and supplies costs drive up a district’s overall administrative costs. The OAG cited salaries and benefits as contributing more significantly to administrative cost than size, purchased services, or supplies. For example, among the 11 sample districts selected for changing administrative costs, small size was listed as a factor for nine districts, but higher salaries was a factor cited for 10 districts. Similarly, among the eight sample districts cited for particularly low costs, large size was a factor for four districts, while staffing levels was cited as a factor for six districts. For the 11 districts with changing administrative costs, decreased size was a factor for seven districts, while salaries and benefits were factors for eight. These findings indicate that large size is not sufficient to contain the most expensive types of administrative costs. They further suggest that the impact of various types of administrative costs on overall costs is far more complex than linear size-cost consolidation proposals admit. SSmmaalllleerr DDiissttrriiccttss RReegguullaarrllyy HHaavvee LLoowweerr AAddmmiinniissttrraattiivvee CCoossttss tthhaann LLaarrggeerr DDiissttrriiccttss Another consequence of linear size- cost consolidation proposals is that they overlook the administrative costs of Arizona’s medium districts. Current consolidation proposals take as their departure point the OAG’s conclusion that, in general, smaller districts (fewer than 600 students) have higher administrative costs, while larger These findings indicate that large size is not sufficient to contain the most expensive types of administrative costs. They further suggest that the impact of various types of administrative costs on overall costs is far more complex than linear size-cost consolidation proposals admit. GOLDWATER INSTITUTE I policy report
  • 9. January 12, 2004 9 districts (over 5,000 students) have lower administrative costs. Yet 39 percent of all school districts examined by the OAG in its 2002 study are medium districts, which fall between those size ranges. The OAG did not cite any medium district as having particularly high administrative costs, but it did select three for having low costs, which constitutes one-third of the OAG sample. To conduct a more comprehensive analysis of school district administrative costs, we used Table 6 of the OAG’s 2002 report, which ranks all 209 districts from highest to lowest administrative spending per pupil.39 The OAG table does not, however, show school district size. School size figures were calculated by taking the total cost column amounts in Table 6 and dividing them by the per-pupil cost amounts. With this larger sample size, it is possible to test how the administrative costs of smaller and medium districts statewide compare to those of larger districts. If larger districts spend the least per pupil on administration generally, then the state’s 10 largest districts should provide a standard by which to judge the spending of medium districts. The state’s 10 largest school districts spent between $348 and $638 per pupil on administration in 2001. Fifty-two, or 64 percent, of medium-size districts fall within this range.40 The average size of medium districts within this range is 2,406 students, while the average large district within this range is nearly seven times larger, at 15,765 students.41 Contrary to expectations, the school district ranked first in terms of lowest administrative spending per pupil is very small. This district is an anomaly, however, as the county superintendent has agreed to manage the district for free.42 Nevertheless, it is illustrative of the finding highlighted by the OAG in its 2000 report, but not in its 2002 report: “Districts that assigned two or more duties to one employee . . . were frequently associated with low administrative costs per pupil.”43 According to the OAG, small districts often assign multiple duties to their administrators, thereby reducing the number of employees and associated compensation costs, which constitute the largest types of administrative costs.44 Next on the list for lowest per-pupil administrative costs are two medium districts.45 Among the top tier of school districts for lowest per-pupil spending on administration (the top 70 of 209) - where one would expect large school districts to dominate - medium, small, and even one very small district spent less on administration per-pupil than many of Arizona’s 10 largest school districts. In fact, one of the state’s largest districts, Phoenix Unified High School District, does not even rank among the top tier, as shown in Table 1. Medium districts Snowflake Unified School District (4,632 students) and Peach Springs Unified School District (1,834 students) outperformed all of Arizona’s 10 largest school districts, which range in size from 69,148 students (Mesa Unified School District) Among the top tier of school districts for lowest per-pupil spending on administration (the top 70 of 209) - where one would expect large school districts to dominate - medium, small, and even one very small district spent less on administration per-pupil than many of Arizona’s 10 largest school districts.
  • 10. GOLDWATER INSTITUTE I policy report 10 GOLDWATER INSTITUTE I policy report District name Number of students Size categoryb Per-pupil spending on administration Murphy ESD 2,409 Medium 571 Colorado River UHSD 1,981 Medium 570 Sierra Vista USD 6,478 Large 570 Page USD 3,065 Medium 569 Liberty ESD 1,455 Medium 565 Buckeye UHSD 1,112 Medium 564 Mohave Valley ESD 1,651 Medium 558 Eloy ESD 1,311 Medium 555 Cottonwood-Oak Creek ESD 2,260 Medium 552 Naco ESD 284 Small 551 Glendale UHSD 13,479 Large 550 Buckeye ESD 1,270 Medium 540 Agua Fria UHSD 2,372 Medium 537 Vail USD 3,200 Medium 535 Douglas USD 4,183 Medium 534 Blue Ridge USD 2,339 Medium 531 Tolleson UHSD 4,353 Medium 530 Gadsden ESD 3,209 Medium 529 Winslow USD 2,481 Medium 525 Santa Cruz Valley USD 2,363 Medium 512 Osborn ESD 3,791 Medium 504 Litchfield ESD 3,438 Medium 502 Dysart USD 5,205 Large 494 Tempe UHSD 12,528 Large 493 Payson USD 2,761 Medium 488 Tucson USD #2 59,068 Large 488 Amphitheater USD 15,957 Large 487 Williams USD 747 Medium 481 Sunnyside USD 13,963 Large 480 Casa Grande ESD 5,035 Large 479 Madison ESD 4,600 Large 473 Nogales USD 6,139 Large 471 Apache Junction USD 5,335 Large 470 Isaac ESD 7,825 Large 469 Balsz ESD 3,030 Medium 468 Prescott USD 4,804 Large 462 Chino Valley USD 2,415 Medium 462 Deer Valley USD #6 26,124 Large 457 Scottsdale USD #7 26,082 Large 457 Higley USD 2,050 Medium 455 TTaabbllee 11.. TToopp TTiieerr SScchhooooll DDiissttrriiccttss ffoorr LLoowweesstt PPeerr--ppuuppiill SSppeennddiinngg oonn AAddmmiinniissttrraattiioonn ffrroomm HHiigghheesstt ttoo LLoowweessttaa
  • 11. January 12, 2004 11 a The top 70 out of 209. Listing based on Table 6 of Factors Affecting, 2002. The 2001 number of students was calculated by taking the total cost column amounts in Table 6 and dividing them by the per-pupil cost amounts. Ranks for 10 largest schools districts are given next to their names. b According to the OAG, very small districts have fewer than 200 students; small districts have between 200 and 599 students; medium districts have between 600 and 4,999 students; and large districts have 5,000 students or more. The National Center for Education Statistics (NCES) categorizes extra-large districts as 15,000 students or more and super-large districts have 40,000 students or more. District name Number of students Size categoryb Per-pupil spending on administration Quartzsite ESD 314 Small 450 Yuma ESD 9,515 Large 450 Humboldt USD 5,094 Large 449 Clarkdale-Jerome ESD 347 Small 449 Marana USD 11,522 Large 448 Lake Havasu USD 5,604 Large 445 Safford USD 2,792 Medium 442 Kyrene ESD 18,402 Large 441 Yuma UHSD 7,988 Large 439 Creighton ESD 7,895 Large 438 Flowing Wells USD 5,822 Large 437 Chandler USD #9 20,729 Large 435 Mesa USD #1 69,148 Large 428 Toltec ESD 793 Medium 426 Avondale ESD 3,150 Medium 423 Pendergast ESD 7,661 Large 423 Flagstaff USD 11,145 Large 417 Alhambra ESD 13,050 Large 414 Kingman ESD 4,459 Medium 411 Tempe ESD 11,894 Large 411 Peoria USD #4 32,569 Large 404 Glendale ESD 11,303 Large 390 Washington ESD #8 23,507 Large 388 Bullhead City ESD 3,628 Medium 372 Cartwright ESD 17,612 Large 363 Casa Grande UHSD 2,443 Medium 362 Paradise Valley USD #3 33,616 Large 349 Gilbert USD #5 27,979 Large 348 Snowflake USD 4,632 Medium 326 Peach Springs USD 1,834 Medium 233 Blue ESD 0 Very small 0 TTaabbllee 11 ((ccoonnttiinnuueedd)).. TToopp TTiieerr SScchhooooll DDiissttrriiccttss ffoorr LLoowweesstt PPeerr--ppuuppiill SSppeennddiinngg oonn AAddmmiinniissttrraattiioonn ffrroomm HHiigghheesstt ttoo LLoowweessttaa
  • 12. GOLDWATER INSTITUTE I policy report 12 to 21,115 (Phoenix Unified High School District). While Snowflake Unified School District spent $326 per pupil on administration and Peach Springs Unified School District spent $233 per pupil, Arizona’s 10 largest districts spent between $348 and $638 per pupil. As the OAG makes clear, however, one-time or idiosyncratic expenses can have a significant impact on the per- pupil administrative costs for school districts of all sizes during any given fiscal year. For example, to attract a new superintendent, one district increased its salary level by roughly $10,000 per year. Another district had an estimated $100,000 in attorney fees relating to contract and personnel matters. Two districts pre-paid health insurance premiums, inflating administrative costs in one fiscal year but achieving increased savings in subsequent fiscal years.46 For this reason, a district’s administrative spending for a single fiscal year can be misleading. To ensure that the instances of very small, small, and medium districts outperforming the state’s 10 largest districts were not aberrations, we compared the OAG’s 2002 district rankings and expenditures with the OAG’s 2000 district rankings and expenditures.47 Using Arizona’s 10 largest districts as a guide, we identified all very small, small, and medium districts that fell within the per-pupil spending ranges for the state’s largest districts in 1999 ($326 to $634) and 2001 ($348 to $638). Of the 52 medium districts that fell within the 2001 spending range, only two did not also fall within the fiscal year 1999 range: Peach Springs Unified School District and Higley Unified School District. However, both of these districts were classified by the OAG as small districts in 1999. All seven of the small school districts that fell within the 2001 per-pupil administrative spending range for Arizona’s top 10 largest school districts also fell within this range in fiscal year 1999. Very small district Kirkland Elementary School District, which spent only $5 more per pupil on administration in 2001 than the tenth- largest district, Phoenix Unified High School District, spent $198 less per pupil than Phoenix Unified High School District in 1999. Comparing the OAG’s 2000 and 2002 district rankings based on 1999 and 2001 fiscal year data shows that the performance of the state’s best smaller and medium districts is not an aberration. Small and medium districts that performed as well or better than their very large counterparts in 2001 also did so in 1999. For example, in 1999, medium district Snowflake Unified School District outperformed only one of Arizona’s 10 largest districts, spending $492 per pupil on administration compared to Phoenix Unified High School District’s $634. By 2001, Snowflake Unified School District’s administrative spending had dropped by 34 percent to only $326 per pupil, tied Comparing the OAG’s 2000 and 2002 district rankings based on 1999 and 2001 fiscal year data shows that the performance of the state’s best smaller and medium districts is not an aberration. Small and medium districts that performed as well or better than their very large counterparts in 2001 also did so in 1999.
  • 13. January 12, 2004 A cursory review of the OAG’s findings on school district admin- istrative costs revealed that the potential fiscal impact would yield at most an additional $17.34 to $34.69 per student. In fact, a closer examination of how the best smaller and medium districts compare with Arizona’s largest districts suggests that even this projection may be too optimistic, since factors other than size influence schools district administrative costs. 13 with top-ranked large district Scottsdale Unified School District and outperforming the state’s other nine largest districts. Also in 1999, medium district Casa Grande Unified High School District outperformed eight of the state’s largest school districts, spending $364 per pupil on administration. Therefore, according to the OAG’s rankings, the best small and medium districts perform on par with or better than Arizona’s 10 largest districts in terms of administrative cost per pupil. That is, both very small and small school districts averaging 307 students and medium districts averaging 2,406 students compete well with the state’s ten largest districts, which average 33,994 students. The fact that significantly smaller districts can keep administrative costs so low indicates that the impact of various types of administrative costs is far more complex than the linear size-cost consolidation model suggests. A cursory review of the OAG’s findings on school district admin- istrative costs revealed that the potential fiscal impact would yield at most an additional $17.34 to $34.69 per student. In fact, a closer examination of how the best smaller and medium districts compare with Arizona’s largest districts suggests that even this projection may be too optimistic, since factors other than size influence schools district administrative costs. Current statewide consolidation proposals would reduce the number of school districts statewide by 83 percent (from over 200 to roughly 40), eliminating very small, small, medium, and even some large school districts. Yet our analysis of 209 Arizona school districts reveals that smaller districts averaging 307 students and medium districts averaging roughly 2,400 students perform as well as or better than the state’s 10 largest districts averaging almost 34,000 students. In light of these findings, the recommended optimal school district size of 6,000 to 30,000 students appears unwarranted. Furthermore, the negligible potential fiscal savings of school district consolidation must be weighed against its negative impact on numerous education quality issues. BBiiggggeerr DDiissttrriiccttss LLeeaadd ttoo AAddmmiinniissttrraattiivvee BBllooaatt,, nnoott SSttrreeaammlliinniinngg In light of available Arizona data, statewide school district consolidation appears ill-advised. A growing body of national research on consolidation supports this assessment. Syracuse University’s Maxwell School Center for Policy Research scholars Matthew Andrews, William Duncombe, and John Yinger recently surveyed three decades of empirical research on school district consolidation. They concluded that cost savings might be achieved by moving from a very small district (500 or fewer
  • 14. While both the Shultz and Horne consol- idation plans point to districts of 6,000 or more students as models of administrative savings, Andrews, Duncombe, and Yinger caution that diseconomies of scale begin to emerge when districts grow larger than 6,000 students, and “sizeable diseconomies of size may begin to emerge for districts above 15,000 students.” GOLDWATER INSTITUTE I policy report 14 students) to a district with enrollment between 2,000 and 4,000 students, roughly the size of Arizona’s most efficient medium districts.48 In fact, the Shultz proposal calling for consolidation of school districts to reach between 6,000 and 30,000 students bases its recommendation on the work of Duncombe, who is the associate director of the Education Finance Accountability Program at Syracuse University, as well as a senior research associate of the Maxwell School’s Center for Policy Research.49 Yet Shultz’s recommendation runs counter to Duncombe’s findings, namely that 6,000 is the optimal number of students in a district for total cost effectiveness. Furthermore, Duncombe finds “no support for the use of state tax dollars to encourage consolidation among districts with 1,500 or more pupils.”50 While both the Shultz and Horne consolidation plans point to districts of 6,000 or more students as models of administrative savings, Andrews, Duncombe, and Yinger caution that diseconomies of scale begin to emerge when districts grow larger than 6,000 students, and “sizeable diseconomies of size may begin to emerge for districts above 15,000 students.”51 Similarly, a growing body of research questions the validity of economies of scale applied to school district performance. As industrial economics expert Bela Gold puts it, “From the standpoint of economic analysis, it is important to recognize that the widespread faith in the ‘economies of scale’ has not gained much support from the relevant theoretical and empirical literature.”52 In his study of New York state school districts, economist Herbert Kiesling concludes that “no evidence has been found to support the popular idea of economies of scale in school district performance.”53 James W. Guthrie, now chair of the Peabody Center for Education Policy at Vanderbilt University, concluded that the consolidation trend has generally failed to produce promised economies of scale.54 Likewise, William F. Fox, director of the Center for Business and Economic Research at the University of Tennessee at Knoxville, finds much of the research on economies of scale in education to be flawed methodologically and concludes that “size economies results must be applied cautiously, and with full recognition of the unique characteristics of each place, because considerations [besides size] are vital to determining the cost implications of policy decisions.”55 Over 30 years of research indicates that school district size does not determine efficiency. As far back as 1972, research indicated that school district size did not affect spending patterns, there was no absolute “optimum” size, and in general, the impact of school district size on efficiency must not be considered in a vacuum.56 Writing for the American School Boards Journal, Carolyn Mullins
  • 15. January 12, 2004 15 reviewed the pros and cons of consolidation and found consolidation is no “panacea for all education’s ills.” Mullins concluded, “Like the bikini, it isn’t for everybody and never will be.”57 PPootteennttiiaall IImmppaacctt ooff CCoonnssoolliiddaattiioonn oonn EEdduuccaattiioonnaall QQuuaalliittyy IIssssuueess Superintendent Horne favors statewide school district consolidation because, as he says, “People expect the money to be spent in the classroom on teacher compensation and on smaller class size, rather than wasteful administration.”58 However, empirical research indicates that consolidation, and the accompanying centralization, will increase administration at the expense of classroom instruction, with fewer resources, larger classes, and more administrative work for teachers. In 2002, a research team led by William Ouchi, a professor at UCLA’s Anderson School of Management, examined nine different school systems, including the United States’ three largest districts. The research team found that the centralized management of schools brought about by consolidation actually led to administrative bloat, not streamlining. For example, in the highly centralized Los Angeles Unified School District, only 45 percent of education dollars were spent in the classroom.59 Education expert Mike Antonucci explains, “Paradoxically, the larger a school district gets, the more resources it devotes to secondary or even non- essential activities.” He refers to this phenomenon as “mission creep,” in which secondary administrative support services subvert a district’s primary purpose of educating students.60 Focusing on theoretical economies of scale, consolidation proponents overlook the negative constraints of large school districts. Former Clinton Admin- istration assistant secretary of the U.S. Department of Education and Education Commission of the States senior education analyst Kent McGuire cautions that such “negative mechanisms” include shifting resources away from core educational activities.61 From 1938 to 1980, school administrations changed from small, local organizations to large, professionally run bureaucracies.62 It was widely believed that schools and districts, like corporations, should be made larger and be run according to the “scientific management” model to achieve higher productivity at reduced costs. Yet as early as 1955, F. W. Terrien and D. L. Mills’ analysis of California districts for the 1951-52 school year showed that as school districts grow, “the school administrator may expect that the percentage of his organization which is devoted to administrative tasks may rise.”63 Seven years later, Raymond E. Callahan published Education and the Cult of Efficiency. His findings confirmed that consolidated districts run by professionals according to the “scientific management” model sacrifice Writing for the American School Boards Journal, Carolyn Mullins reviewed the pros and cons of consolidation and found consol- idation is no “panacea for all education’s ills.” Mullins concluded, “Like the bikini, it isn’t for everybody and never will be.”
  • 16. GOLDWATER INSTITUTE I policy report 16 educational quality. According to Callahan: The tragedy itself was fourfold: that educational questions were subordinated to business considerations; that administrators were produced who were not, in any true sense, educators; that a scientific label was put on some very unscientific and dubious methods and practices; and the anti-intellectual climate, already prevalent, was strengthened.64 Contrary to expectations, research overwhelmingly shows smaller, decentralized school districts have superior student achievement and efficiency. After examining school districts nationwide, Ouchi and his UCLA research team conclude, “Our data generally support the view that decentralized public school districts outperform more centralized districts on student performance outcomes, administrative efficiency, and incidence of corruption.”65 Commonwealth Foundation senior fellow and University of Idaho economics professor emeritus John T. Wenders concludes that increased school district centralization consumes any savings intended to go to the classroom: “The result [where districts have been consolidated] has been higher, not lower, per-pupil costs and worse education. In the jargon of Economics 101, any economies gained by movements down cost curves have been more than offset by upward shifts in these same curves.”66 National data confirm that as school districts consolidate they become more inefficient, the number of individual schools declines, and schools become larger. According to the National Center for Education Statistics (NCES) June 2003 Digest of Education Statistics, “During most of the last century, the trend to consolidate small schools brought a large decline in the total number of public schools in the United States.” For example, from the 1938-39 school year to the 2000-01 school year, the number of school districts declined almost twice as fast as overall enrollment increased, resulting in larger schools. More recently, from 1990-91 to 2000- 01, the average elementary school size grew by six percent, while the average secondary school size grew by seven percent.67 As discussed above, the consolidation plans proposed by Horne and Shultz would drastically reduce the number of school districts statewide without addressing the primary source of all administrative costs, the individual school. As a result, any potential fiscal savings would amount, at best, to between $17.34 and $34.69 per pupil. But if school district consolidation also reduces the number of individual schools, would not administration levels also decline, yielding savings at the source of most administrative costs? The lion’s share of consolidation research focuses on this very question but finds that administrative levels have skyrocketed. Cato Institute executive vice president David Boaz and writer R. After examining school districts nationwide, Ouchi and his UCLA research team conclude, “Our data generally support the view that decentralized public school districts outperform more centralized districts on student performance outcomes, admin- istrative efficiency, and incidence of corruption.”
  • 17. January 12, 2004 17 Morris Barrett found that between 1960 and 1984, the number of school districts nationwide declined 39 percent, from 40,520 to 15,747. During this time, however, school administration grew by a staggering 500 percent, while “the number of teachers and principals grew by a comparatively puny 57 percent and 79 percent, respectively.”68 Data from the NCES reveal that as schools get bigger, pupil/teacher ratios grow. As a result of elementary enrollment rising faster than the number of schools, class sizes increased nationwide from the 1990-91 school year to the 2000-01 school year.69 Nevertheless, the average public elementary and secondary pupil/teacher ratio has dropped nearly constantly from the fall of 1955 to the fall of 2001, from roughly 27:1 to 16:1.70 Larger schools, however, have higher pupil/teacher ratios. As of fall 2000, only schools with fewer than 499 students had pupil/teacher ratios below the national average of 16:1.71 Schools with enrollment between 500 and 999 did not have statistically higher pupil/teacher ratios than the national average. Schools with enrollment between 1,000 and 1,999 had pupil/teacher ratios of more than 17:1, and those with enrollment over 1,500 were higher still, at more than 19:1.72 While national pupil/teacher ratios have been decreasing, from the fall of 1995 to the fall of 2000, Arizona’s ratio increased slightly, from 19.6 students per teacher to 19.8 students per teacher, almost 4 more than the national average.73 In fact, Arizona’s current overall ratios are higher than those of the country’s largest schools.74 Consol- idation would exacerbate this trend, given that the resulting larger schools tend to have higher pupil/teacher ratios.75 Furthermore, following years of school district consolidation nationwide, administrators now equal, and in some states exceed, teachers and instructional staff as a proportion of school staff. In fact, from 1994 to 2000, teachers in public elementary and secondary schools as a percentage of staff have decreased overall nationally from 52.0 percent to 51.6 percent.76 In Arizona, this trend is even more pronounced. Over the same period, teachers in the state’s public elementary and secondary schools as a percentage of staff have decreased from 51.2 percent to 49.3 percent. As a result, Arizona ties for the tenth worst teacher-as-a-percentage- of-staff ranking in the country.77 As of the 1999-00 school year, 71 percent of public school teachers nationwide indicated “routine duties and paperwork interfere with the job of teaching.”78 Thus, after decades of school district consolidation, teachers believe that they are doing more administrative work, even though there are now as many or more administrators than teachers on staff. Consolidation efforts nationwide have also resulted in diminished local While national pupil/teacher ratios have been decreasing, from the fall of 1995 to the fall of 2000, Arizona’s ratio increased slightly, from 19.6 students per teacher to 19.8 students per teacher, almost 4 more than the national average. In fact, Arizona’s current overall ratios are higher than those of the country’s largest schools. Consolidation would exacerbate this trend, given that the resulting larger schools tend to have higher pupil/ teacher ratios.
  • 18. Whereas smaller districts allowed for greater parental involvement because school board members and school officials were more accessible and had fewer constituents, larger districts have diminished the role of parents and increased the influence of special interest groups. This effect is unavoidable when districts consolidate and become more bureaucratic. GOLDWATER INSTITUTE I policy report 18 and parental influence. The research of education scholar and former teacher Matthew J. Brouillette found: The dramatic reduction of school districts and the increase in student population dilutes the parental influence on their children’s education. Whereas smaller districts allowed for greater parental involvement because school board members and school officials were more accessible and had fewer constituents, larger districts have diminished the role of parents and increased the influence of special interest groups. This effect is unavoidable when districts consolidate and become more bureaucratic.79 Rural districts, typically the targets of consolidation efforts, pay an especially high price in this regard. Idaho is currently considering two school district consolidation measures. State representative Allen Andersen (D- Pocatello), who is also the director of the Idaho Education Association in southeast Idaho, notes that local schools are an essential part of the rural community’s identity and structure. For this reason, rural constituents typically oppose consolidation. According to Andersen, “Most of their activities and identity revolve around the school district. So I think there is a fear from folks that that sense of identity and community spirit would be lost.”80 In perhaps one of the first seminal studies to question the belief that bigger schools are better, Big School, Small School: High School Size and Student Behavior, University of Kansas psychologists and authors Roger G. Barker and Paul V. Gump document the vital contribution small local schools make to rural communities, and the opportunities small schools offer students. For example, Barker and Gump found that the proportion of students participating in artistic, journalistic, and student government competitions was highest in high schools with between 61 and 150 students. Not only were the number and kinds of activities twice as great in smaller schools, participation levels were also three to 20 times higher in smaller high schools.81 Emil J. Haller and David H. Monk, professors of education administration at Cornell University, studied rural school district consolidation from the 1940s to the 1970s and concluded that consolidation was “profoundly undemocratic.”82 Focusing his research on rural school districts, Paul Nachtigall explains why: “Seeking economies of scale through school consolidation are, at best, elusive,” and at worst, he continues, “to the extent that closing schools [as a result of district consolidation] contributes to the demise of rural communities, the dollars saved are a high price to pay for the loss of those communities.”83 According to the NCES, Arizona currently has 1,706 regular public schools. Excluding the state’s charter
  • 19. January 12, 2004 In fact, data show that in consolidated districts administration grows, instructional staff shrinks, and economies of scale fail to materialize. Likewise, a growing body of research now suggests school district consolidation may have a negative impact on student achievement. 19 schools, there are 351 schools statewide whose student populations range from 800 to over 3,000 students.84 Roughly 84 percent of these schools are in or located near large cities.85 By increasing the number of large high schools and creating more populated elementary and secondary schools, consolidation efforts would substantially alter the majority of Arizona’s schools, roughly 74 percent of which have fewer than 800 students. In addition, rural areas would be affected disproportionately, as only 20 schools with more than 800 students now exist in rural areas, or less than six percent of all schools. Research further suggests that potential administrative savings do not justify the upheaval attendant to school closures in rural areas. Tracing consolidation and related efforts in rural areas back to 1840, Jonathan P. Sher and Rachel B. Tompkins conclude the claim that consolidation of rural districts “will, ipso facto, save money appears to have no empirical or logical basis. It is simply incorrect to assert that consolidation is synonymous with economy.”86 Rural residents are not the only ones who want a vital connection to their local schools. Nationwide, as public elementary and secondary enrollments were increasing overall, and the number of regular school districts and schools were decreasing, public survey respondents have consistently given their local schools and the nation’s schools lower grades.87 From 1974 through 1989, the average grade respondents would give their local (and the nation’s) public schools was in the C+/C range. From 1990 to 1994 the average grades declined to the C/C-, even D+, range.88 Over this twenty-year period, the decline in the number of school districts and the corresponding decline in the number of schools outpaced shrinking enrollment by five to one and three to one, respectively. As a result, schools became more crowded, and this phenomenon likely contributed to lower public approval ratings. Not surprisingly, the items most frequently cited as major problems facing public schools from 1992 to 2002 were large schools and overcrowding (increasing from 9 to 23 percent), and lack of discipline (17 percent in both 1992 and 2002).89 PPootteennttiiaall IImmppaacctt ooff CCoonnssoolliiddaattiioonn oonn SSttuuddeenntt AAcchhiieevveemmeenntt Research thus far shows that consolidation fails to reduce wasteful administration or achieve significant savings. In fact, data show that in consolidated districts administration grows, instructional staff shrinks, and economies of scale fail to materialize. Likewise, a growing body of research now suggests school district consolidation may have a negative impact on student achievement. While acknowledging the method- ological challenges to comparing student achievement in centralized and
  • 20. While all students appear to benefit academically from smaller schools and districts, at-risk students benefit even more. Ouchi’s UCLA research team found that when districts decentralize, “data generally show improve- ments in average [student] achievement across every ethnic group and every grade.” Further, data suggest that in decentralized districts, ethnic achievement gaps are smaller. GOLDWATER INSTITUTE I policy report 20 decentralized school districts across the country, Ouchi’s UCLA research team concluded that “decentralized school districts will outperform centralized school districts in producing positive student achievement in academics.”90 Kathleen Cotton of the Northwest Regional Education Laboratory analyzed more than 100 documents, including 69 studies, evaluations, reviews, and syntheses on school size and educational quality.91 As with Ouchi et al., Cotton found that roughly half the literature found no difference in achievement between students attending large and small schools, while the other half of the literature concluded achievement levels were higher in small schools. Cotton notes, “None of the research finds large schools superior to small schools in their achievement effects.”92 All of the researchers Cotton cites reached their conclusions about school size and student achievement after controlling for other variables, including student and staff characteristics. Among those characteristics is the advantage of a rural setting, where most of the country’s small schools are found. While most consolidation proponents consider a rural setting a disadvantage, some research shows it contributes to higher student achievement. For example, Cotton refers to Herbert J. Walberg, research professor of education and psychology at the University of Illinois at Chicago and distinguished visiting fellow at the Hoover Institution at Stanford University, who concludes that “even discounting the positive effects of rural location, smaller high schools yielded greater achievement and years of attained education after high school. Thus, smaller schools showed long- range effects independent of rural setting.”93 While all students appear to benefit academically from smaller schools and districts, at-risk students benefit even more. Ouchi’s UCLA research team found that when districts decentralize, “data generally show improvements in average [student] achievement across every ethnic group and every grade.”94 Further, data suggest that in decentralized districts, ethnic achievement gaps are smaller.95 This finding substantiates the findings of previous research on school district consolidation and minority student achievement. As Cotton summarized, the effects of small schools on achievement for both minority students and students of low socioeconomic status are the most positive. Similarly, research shows large schools disproportionately harm achievement for these students.96 In October 2002, the American Legislative Exchange Council (ALEC) released its Report Card on American Education, which included a state-by- state analysis of education outcomes from 1976 through 2001. Among the many factors the ALEC report examined were school district size, school size, and their effects on student achievement.97
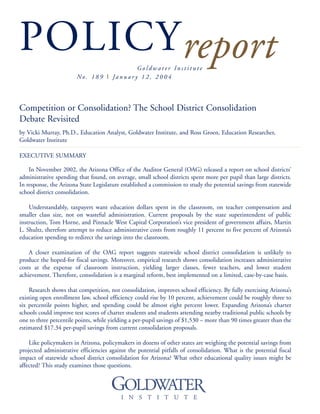
  • 21. January 12, 2004 On average, fewer students per school and fewer schools per district (which means more and smaller districts with more and smaller schools) are associated with higher SAT, ACT, and National Assess- ment of Educational Progress (NAEP) scores. 21 The report concluded that on average, fewer students per school and fewer schools per district (which means more and smaller districts with more and smaller schools) are associated with higher SAT, ACT, and National Assessment of Educational Progress (NAEP) scores.98 Likewise, trendline analyses from 1981 to 2001 suggest positive relationships between higher average SAT scores and smaller school sizes, as well as fewer schools per district.99 Figures 3.7, 3.8, and 3.9 from the Report Card on American Education are shown in Figure 1.100 The bold line drawn through each diagram is the trend line. In all three diagrams, the trendline slopes down, indicating that fewer schools per district may be associated with higher academic achievement. Each dot represents a single state. Each state’s average number of schools per district is measured along the vertical axis, while the average test scores are measured along the horizontal axis. Thus, if a state’s dot is located in the upper left corner, the state has a large number of schools per district but a low average test score. In contrast, if a state’s dot is located in the lower right corner, it has a low number of schools per district but a high average test score. Statistical analysis, however, reveals that no single factor guarantees student achievement, including fewer districts, smaller schools, more per-pupil spending, more federal funding, higher teacher salaries, or lower pupil/teacher ratios. In fact, when all other factors are held constant, only fewer students per school had a positive, statistically significant relationship with student achievement, albeit a weak one.101 While the ALEC report shows no statistical relationship between the individual factors and student achievement over time, Arizona data from 1981 to 2001 is revealing. During that period, the average nationwide SAT score rose by 2.5 percent, while Arizona’s average SAT score dropped by 6.1 percent, placing the state last in the nation.102 From 1977 to 1999, Arizona had a nearly 60 percent increase in the number of students per district, roughly three times the national average. At the same time, the number of Arizona schools per districts fell by more than three percent. Nationwide, the number of schools per district grew nearly five percent. Likewise, as pupil/teacher ratios fell an average of 13 percent nationally, Arizona’s ratio hardly budged, falling less than one percent. In contrast, top- ranking Alabama improved its SAT scores by more than 10 percent, while the number of students and schools per district fell by roughly four and five percent, respectively. As seen in Tables 2 and 3, a more detailed examination of the 10 best and worst states for SAT positive score changes, including the changes in students and schools per district, is even more revealing. Nationwide, from 1981 to 2001, average SAT scores improved 2.5 percent. In the case of the ten worst
  • 22. GOLDWATER INSTITUTE I policy report 22 FFiigguurree 11.. SSttaannddaarrddiizzeedd TTeesstt SSccoorreess aanndd SScchhoooollss ppeerr DDiissttrriicctt 900 950 1000 1050 1100 Average SAT Score 1150 1200 1250 does not include the District of Colombia or Hawaii 0 10 AverageSchoolsperDistrict 20 30 40 50 60 FIGURE 3.7 SAT SCORES AND SCHOOLS PER DISTRICT FIGURE 3.8 NAEP SCORES AND SCHOOLS PER DISTRICT FIGURE 3.9 ACT SCORES AND SCHOOLS PER DISTRICT 0 10 AverageSchoolsperDistrict 20 30 40 50 60 0 10 AverageSchoolsperDistrict 20 30 40 50 60 18 20 20.5 21.5 22 22.518.5 19 19.5 21 Average ACT Score 23 245 250 255 260 265 270 275 280 285 290 does not include the District of Colombia or HawaiiAverage NAEP 8th Grade Mathematics Score Source: Andrew T. LeFevre and Rea S. Hederman Jr., Report Card on American Education: A State-By-State Analysis, 1976-2001, ALEC, October 2002, p. 94.
  • 23. January 12, 2004 23 Changes in Changes in SAT Score Students per Schools per Change 1981- District 1977- District 1977- State 2001 (%) Rank 1999 (%) Rank 1999 (%) Rank AL 10.5 1 -3.96 39 -6.46 9 SC 8.7 2 9.40 28 8.59 38 IL 8.7 3 11.60 26 -1.41 19 DC 8.0 4 -94.81 51 28.05 1 ID 8.0 5 23.09 17 -0.42 20 MO 7.9 6 8.33 30 -4.76 13 NC 7.5 7 33.62 11 1.90 23 MI 6.1 8 -33.10 50 -10.67 5 WI 6.0 9 4.25 33 3.10 27 GA 5.8 10 37.07 10 28.17 50 U. S. Average 2.5 18.85 4.74 TTaabbllee 22.. TToopp TTeenn SSttaatteess ffoorr PPoossiittiivvee SSAATT CChhaannggeess Changes in Changes in SAT Score Students per Schools per Change 1981- District 1977- District 1977- State 2001 (%) Rank 1999 (%) Rank 1999 (%) Rank AZ -6.1 51 59.62 4 -3.39 15 MT -4.9 50 24.60 16 -11.70 4 WA -4.6 49 33.00 12 0 .73 22 WY -3.5 48 -1.79 35 -2.31 17 WV -2.9 47 -25.09 49 0.55 21 NV -2.6 46 120.40 1 23.89 48 UT -2.2 45 42.91 8 15.53 43 AK -2.0 44 52.64 7 34.19 51 DE -1.6 43 -8.05 43 8.60 39 SD -1.1 42 4.26 32 -6.05 11 U.S. Average 2.5 18.85 4.74 TTaabbllee 33.. TTeenn WWoorrsstt SSttaatteess ffoorr NNeeggaattiivvee SSAATT CChhaannggeess Note: Tables based on Table 3.4 of Andrew T. LeFevre and Rea S. Hederman Jr., Report Card on American Education: A State-By-State Analysis, 1976-2001, ALEC, October 2002, pp. 102-103.
  • 24. In contrast to consolidation, the benefits of competition upon student performance and school efficiency are well documented. GOLDWATER INSTITUTE I policy report 24 states, the average change in SAT scores was a three percent decline, while the best states realized an average achievement increase of nearly eight percent. Corresponding to this time frame (1977 to 1999), the average number of students in districts with the worst SAT changes grew nearly four times faster than the number of schools per district. Conversely, in states with the greatest improvement in SAT scores, the number of schools per district increased while the number of students per school decreased. It is important to note that states with the highest achievement losses experienced an overall average enrollment growth that was eight times greater than states with the highest achievement gains, roughly 24 percent and three percent, respectively. High- achieving states were well below the national average enrollment growth of 8.6 percent from 1979 to 2002, and low achieving states were well above the national average.103 Nevertheless, ensuring the number of schools per district keeps pace with explosive growth in student enrollment should be a primary concern for state policymakers, especially since Arizona’s average growth from 1979 to 2002 was 69 percent, second only to Nevada.104 CCoommppeettiittiioonn,, nnoott CCoonnssoolliiddaattiioonn,, IImmpprroovveess tthhee CCllaassssrroooomm Consolidation efforts are designed to increase classroom spending by redirecting administrative savings into the classroom. But administrative savings can be elusive, and if they do materialize, there is no guarantee that they will reach their intended destination.105 As explained above, the trend toward consolidation during most of the 20th century has reduced the number of public schools. Because enrollment has grown steadily, the result is fewer, larger schools. And, empirical research indicates a negative impact of consolidation on student achievement scores. However, as the NCES explains, the rising number of alternative schools has mitigated the average increase in school size.106 The emergence of these schools is a recent development, but the positive impact of even the limited amount of competition they offer traditional public schools is already discernable. In contrast to consolidation, the benefits of competition upon student performance and school efficiency are well documented. In their meta-analysis of 41 empirical studies spanning 30 years, Columbia University researchers Clive R. Belfield and Henry M. Levin demonstrate that the literature overwhelmingly shows a statistically significant, positive relationship between competition and educational outcomes.107
  • 25. January 12, 2004 Research indicates that not only does educational inno- vation and freedom result in greater academic achievement for all students, the introduction of educational compe- tition, such as charter schools, scholarships, and open enrollment, improves productivity for every per-pupil dollar spent. 25 Nowhere is this trend more evident than in Arizona. Unlike many states that strictly regulate any competition to public schools, Arizona lawmakers have introduced greater competition into the state’s education system over the last decade. As a result, Arizona has twice been named the national leader in educational freedom, according to the Manhattan Institute’s Education Freedom Index, by Jay P. Greene.108 Research indicates that not only does educational innovation and freedom result in greater academic achievement for all students, the introduction of educational com- petition, such as charter schools, scholarships, and open enrollment, improves productivity for every per- pupil dollar spent. As Greene demonstrates, com- petition raises test scores without increasing per-pupil spending. Two public school approaches in particular distinguish Arizona from other states according to Greene: an unrestricted inter-district public school choice program and the largest number of charter schools in the country.109 Greene finds that “a one point increase in the EFI [Education Freedom Index] produces the same improvement in NAEP math results as increasing per- pupil spending by $2,490, about a 36 percent increase in spending over the current national average.”110 Similarly, a state’s median household income would have to increase by more than $6,000 to achieve the same improvement as a one- point increase on the EFI. Greene’s findings, however, are not isolated. In her study of more than 6,500 school districts nationwide, Harvard economist Caroline Hoxby examined the effects of inter-district choice, or choice among various public schools, on school productivity. She finds that “[inter-district] choice raises productivity [of each education dollar] by simultaneously raising achievement and lowering spending. The effects on productivity, student achievement and per-pupil spending are substantial in size if one considers the potential of [inter- district] choice as a policy.”111 Contrary to consolidation measures that decrease the number of school districts and schools, Hoxby’s research demonstrates that school district multiplicity raises school productivity and academic achievement. For example, she finds that the decrease in per-pupil spending produced by competition from inter-district choice actually increases teaching resources per student by decreasing pupil/teacher ratios. “An increase from 0 to 1 in the index of [inter-district] choice,” according to Hoxby, “generates a decrease of 2.7 students in the student- teacher ratio.”112 Moreover, productivity increases by at least one-quarter of a standard deviation in states where school districts are controlled locally, compared with only one-tenth of a standard deviation in consolidated, state- controlled districts, which have less financial independence.113
  • 26. Hoxby believes, “[Inter- district] choice among districts is the most powerful market force in American public education.” Yet, she notes, school district consolidation is one factor that greatly inhibits inter-district choice and its effectiveness. GOLDWATER INSTITUTE I policy report 26 Thus, “When inter-district choice goes from its minimum to its maximum value (from 0 to 1), school productivity rises by 10 percent; achievement is 3.1 to 5.8 percentile points higher; and spending is 7.6 percent lower.”114 In fact, Hoxby believes, “[Inter-district] choice among districts is the most powerful market force in American public education.”115 Yet she notes school district consolidation is one factor that greatly inhibits inter-district choice and its effectiveness. Unfortunately, and despite new federal mandates, in many instances such inter-district freedom is restricted. School districts often put up roadblocks that make it difficult to switch to another public school.116 Arizona’s open enrollment law is one way to achieve significant administrative savings through inter-district public school competition while improving student achievement and enhancing local control. The state’s existing law should be enforced more rigorously to prevent school districts from blocking student transfers. School districts should become smaller to increase the probability of having many good schools located close by and to diminish the undue hardships associated with relocating, which might prevent parents from enrolling their children in the schools that are best for them. Arizona’s charter schools offer another path to administrative efficiency. Enacted in 1994, Arizona’s charter school legislation is considered the nation’s strongest charter school law, with no limit on the number of charter schools that can be created. There has been a meteoric rise in the number of charter schools in Arizona, increasing by 663 percent, from 70 schools during the 1995-96 school year to more than 460 as of the 2002-03 school year.117 Charter schools are public schools and must provide the same level of educational quality as traditional public schools. Yet charter schools in Arizona receive about 80 percent of the per- pupil funding that traditional public schools receive, so they are forced to be efficient.118 Last June, Manhattan Institute scholars Jay P. Greene, Greg Forster, and Marcus A. Winters released an in-depth study of charter school performance, which found that “charter schools serving the general student population outperformed nearby regular public schools on math tests by . . . 3 percentile points for a student starting at the 50th percentile. These charter schools also outperformed nearby regular public schools on reading tests by . . . 2 percentile points for a student starting at the 50th percentile.”119 Focusing on Arizona’s charter schools and their effect on surrounding traditional public schools, Hoxby finds that students in both types of schools benefit. Even after controlling for both kinds of schools’ initial conditions, data showed “charter competition made Arizona public schools improve their productivity relative to their own initial
  • 27. January 12, 2004 “The top-down flow of power and respon- sibility in traditional school districts has been likened to an inverted pyramid weighing down on the heads of schools.” The prevailing bureaucratic school district structure impedes innovation and would only become more rigid under the centralizing nature of current Arizona consolidation proposals. 27 proposals are designed to correct.124 Nelson Smith, vice president for policy and governance at New American Schools and author of the ECS study, writes, “The top-down flow of power and responsibility in traditional school districts has been likened to an inverted pyramid weighing down on the heads of schools.”125 The prevailing bureaucratic school district structure impedes innovation and would only become more rigid under the centralizing nature of current Arizona consolidation proposals. In fact, this centralizing tendency is the primary reason most large districts nationwide are decentralizing. For example, in July 2001, the Los Angeles Alliance for Student Achievement approached WestEd for recom- mendations on improving student performance in the Los Angeles Unified School District (LAUSD), which has 905,020 students. Paul Koehler, former superintendent in Peoria and associate state superintendent in the Arizona Department of Education, led the WestEd project team. In 2003, WestEd recommended breaking up the LAUSD, implementing a network of new charter schools, and streamlining the charter approval process to make it “straightforward and timely.”126 Koehler’s team proposed, “Taking the concept of charter schools to the next level by thinking systematically from the start and creating a network of highly accountable, independent charter trends.”120 That is, when faced with charter school competition, Arizona’s regular public schools raised productivity by improving achievement levels within initial per-pupil spending levels.121 Hoxby concludes that in Arizona, “Charter competition focused on public schools that initially had achievement and productivity that was below average, but charter competition induced public schools to improve their productivity and achievement . . . relative to the schools’ own past performance and relative to gains made, over the same period, by schools that were not subjected to charter competition.”122 Even public schools that lagged behind other public schools improved their student achievement dramatically in response to charter competition. For example, public schools with achievement gains 0.6 percentile points lower than public schools not facing charter competition raised their annual improvement on NAEP scores by 1.4 and 1.39 percentile points in fourth grade reading and math, respectively, once charter school competition was introduced.123 Arizona’s charter school heritage provides a strong foundation for administrative streamlining in the state’s traditional public schools. A recent series of papers by the non-partisan Education Commission of the States (ECS) recommends all-charter public school districts as an effective solution to the very inefficiencies consolidation
  • 28. By employing the charter district model rather than consolidation, each district school would be able to tailor its educational programs to the particular needs of prospective students. Parents, in turn, would be genuinely free to choose any school in the state. This would provide a wide variety of educational options to all families. Schools would be free to budget independently and find cost savings without needing the approval of a central office or unelected board. GOLDWATER INSTITUTE I policy report 28 schools that effectively serve students in LAUSD’s most challenging com- munities.” Unlike highly centralized districts “that might not directly address the needs of students in a particular school community, charter schools will receive resources that they can target directly to programs designed with their community in mind.”127 Ouchi and his research team corroborate Koehler’s conclusion, based on twenty years of data, that decentralized districts foster the innovation and flexibility essential to the success of schools: “Our findings confirm what [Richard] Daft (1982) has asserted: that organizations that are highly centralized and bureaucratic are less likely to innovate and perform effectively.” Ouchi concludes, “Most important of all, our results suggest that a properly organized school district can produce superior educational results for children, including those of low-income, minority homes.”129 Writing for the Progressive Policy Institute, Nelson Smith analyzed findings from three in-depth studies on student achievement in California charter schools. The results show charter schools do a superior job of educating at-risk students than non-charter schools.130 Furthermore, the average Academic Performance Index (API) gains over the past five years for charter high schools are twice as high as other public high schools, and while only 38 percent of California charter schools have been in existence long enough to test improvement over time, 70 percent of them showed improvement over the previous year’s scores. There is much debate surrounding the potential savings or costs of the charter district model. Smith and members of the ECS charter district working group acknowledge potential sources of additional savings from the charter model: “With just a handful of employees, the new central office itself will cost far less than its predecessor, and competition may well drive down the cost of services.” In addition, charters can compete for grants on their own. However, facilities costs were shown to drive up operational costs in Massachusetts charter schools. Members of the working group therefore concluded that the charter district model is a revenue-neutral reform.131 By employing the charter district model rather than consolidation, each district school would be able to tailor its educational programs to the particular needs of prospective students. Parents, in turn, would be genuinely free to choose any school in the state. This would provide a wide variety of educational options to all families. Schools would be free to budget independently and find cost savings without needing the approval of a central office or unelected board. And, because charter schools receive only 80 percent of traditional public school funding, there is a potential per- pupil fiscal savings that far surpasses that of statewide school district consolidation. According to data from
  • 29. January 12, 2004 29 the Joint Legislative Budget Committee (JLBC), per-pupil funding for regular school districts in Arizona is $7,816, compared to $6,286 for charter schools.132 Per-pupil savings from competition is therefore over 90 times greater than the projected per-pupil savings from consolidation, or $1,530 compared to an estimated $17.34. The limited amount of choice provided by charter schools nationwide has already encouraged traditional public schools to compete for students, resulting in greater parental satisfaction133 and improved academic achievement.134 The success of the public charter model underscores that the educational goals of policymakers and the general public can be reconciled. In contrast to the goals of consolidation efforts, the public wants more schools with diverse curricula. And by virtually eliminating an entire layer of extra school-site administration, charter schools achieve the primary goal of consolidation measures: significant administrative savings that go directly into the classroom. RReeccoommmmeennddaattiioonnss Based on data presented in this report, to achieve optimal productivity in classrooms and administrative programs, policymakers should consider the following reforms. PPrroommoottee CCoommppeettiittiioonn,, nnoott CCoonnssoolliiddaattiioonn Enhancing educational competition through the promotion of inter-district choice and charter schools has a potential savings of $1,530 per pupil compared to only $17.34 to $35 per pupil from statewide consolidation under the best-case scenario. Research indicates that if Arizona’s system of inter-district choice were fully exercised, school productivity could rise by 10 percent, achievement could be three to six percentile points higher, and spending could be almost eight percent lower. Strictly enforcing the state’s open enrollment policy and improving educational freedom in Arizona by as little as one point on the Education Freedom Index, would produce the same improvement in NAEP math results as increasing per-pupil spending by $2,490 or raising the median household income by more than $6,000. EEmmuullaattee BBeesstt PPrraaccttiicceess ooff EEffffiicciieenntt SScchhoooollss ooff AAllll SSiizzeess While statewide consolidation will likely not result in anticipated administrative savings, the OAG’s reports show schools of all sizes are cutting costs and achieving sustained administrative efficiencies. A linear size- cost analysis should be replaced with a more in-depth analysis of those schools, so that schools of all sizes could adopt administrative best practices. Because 52 percent of all administrative costs arise at individual schools, reform at the school level, not the district level, could address the major source of inefficiency. Moreover, such a ground-up cooperative effort within districts would make them Per-pupil savings from competition is therefore over 90 times greater than the projected per- pupil savings from consolidation, or $1,530 compared to an estimated $17.34.
  • 30. Closer examination of 209 Arizona school districts reveals that medium districts averaging roughly 2,400 students perform as well as or better than the state’s 10 largest districts, which average nearly 34,000 students. These findings suggest that administrative savings are not simply a matter of size. GOLDWATER INSTITUTE I policy report 30 progressively more efficient without stifling innovation and competition. EExxaammiinnee tthhee PPeerrffoorrmmaannccee ooff MMeeddiiuumm-- ssiizzee DDiissttrriiccttss Medium-size school districts may provide an indispensable “mean- between-the-extreme” approach to school district efficiency. Unfortunately, the linear size-cost analysis considers only small or large school districts. Closer examination of 209 Arizona school districts reveals that medium districts averaging roughly 2,400 students perform as well as or better than the state’s 10 largest districts, which average nearly 34,000 students. These findings suggest that administrative savings are not simply a matter of size. While current consolidation proposals focus on creating districts ranging from 6,000 to 30,000 students, medium districts avoid many of the disadvantages associated with large districts. CCoonncclluussiioonn Superintendent Tom Horne aptly sums up the rationale of current school district consolidation proposals: “People expect the money to be spent in the classroom on teacher compensation and on smaller class size, rather than wasteful administration.” Upon closer examination, however, consolidation appears to be at best a marginal reform yielding negligible fiscal savings. Economists find little evidence that economies of scale improve school district efficiency, and empirical consolidation research indicates smaller, decentralized school districts are significantly more efficient than larger, centralized districts. Likewise, in Arizona, data show that small and medium districts consistently spend as much as or less on administration than the state’s largest districts. In fact, empirical research shows that in consolidated school districts, the result is worse education and higher, not lower, per-pupil costs. Consolidation and its accompanying centralization would likely increase administration at the expense of classroom instruction, leading to larger classes, more administrators, and fewer teachers. Partly as a result of decades of consolidation, administrators nation- wide now equal, and in some states exceed, teachers and instructional staff as a proportion of school staff. This imbalance is especially pronounced in Arizona, which has the 10th worst teacher-as-a-percentage-of-staff ranking in the country. Of paramount concern is student achievement, and evidence suggests smaller districts contribute to higher SAT, ACT, and NAEP scores. For example, comparing the 10 best and 10 worst states in terms of SAT achievement gains from 1981 to 2001, average SAT scores declined three percent in states with larger school districts, while average SAT scores increased nearly eight percent in states with smaller school districts.
  • 31. January 12, 2004 31 Competition, rather than consolidation, improves school efficiency. By fully exercising Arizona’s existing inter-district choice policy, school efficiency could rise by 10 percent, student achievement could be roughly three to six percentile points higher, and spending could be almost eight percent lower. Research also shows that expanding Arizona’s charter schools would improve test scores of charter students and students attending nearby traditional public schools by one to three percentile points, while yielding a per- pupil savings over 90 times greater than that promised by consolidation proposals, $1,530 per pupil compared to an estimated $17.34. It is possible that consolidation could achieve limited administrative savings if carefully implemented on a case-by-case basis. Yet targeted consolidation measures cannot approach the potential fiscal savings from expanding existing school choice policies in Arizona. School district consolidation also poses significant risks to educational quality. Expanding options for parents and students by encouraging growth in the number of charter schools and fully exercising Arizona’s existing open- enrollment law are far more promising ways to direct more education dollars into the classroom.
  • 32. GOLDWATER INSTITUTE I policy report 32 1. Thomas D. Synder and Charles M. Hoffman, Digest of Education Statistics 2002, National Center for Education Statistics (NCES), June 2003, p. 6; cf. Tables 29-35 and Table 167. 2. Deborah K. Davenport, Auditor General, Arizona Public School Dollars Spent in the Classroom, March 2002, p. ii. 3. Ibid., p. 1. The Office of the Auditor General’s definition of “dollars spent in the classroom” is based on NCES categories: classroom personnel; instructional aids; general instructional supplies, tuition, and activities, which includes field trips, athletics; and co- curricular activities such as band and choir. See p. 4. 4. Data from fiscal year 1999 was the subject for the OAG’s previous report to the legislature, also called Factors Affecting School Districts’ Administrative Costs, November 2000. Unlike its 2000 report, the 2002 OAG report, based on fiscal year 2001 data, included additional analysis using NCES expenditure categories for administrative costs in programs other than regular and special education programs. 5. Factors Affecting, 2002, p. 16. 6. Senate Bill 1180, May 29, 2002. 7. Consolidation proponents cite school board membership and governance as important issues to consider, but their primary focus is with increasing local school district size to achieve administrative cost savings. Goldwater Institute education analyst Vicki Murray met with Superintendent Horne to discuss his consolidation proposal on July 17, 2003. For Horne, consolidation encompasses four core issues: 1) reducing administrative costs; 2) fortifying student curriculum; 3) ensuring professional school leadership; and 4) capital finance. Martin L. Shultz, “A Case for Unification and Where Appropriate Consolidation of Districts in Arizona” (unpublished paper; copy in authors’ files), advocates increasing the number of school governing board members from five to nine; increasing the governing board’s role; and developing a Superintendent’s Institute to “re-educate” administrators in management and technology-assisted instruction. See Shultz, “A Case for Unification,” p. 3. 8. The OAG’s 2002 Factors Affecting report is based largely on Joint Legislative Budget Committee (JLBC) data. Superintendent Horne explained the need for consolidation to host Michael Grant during the PBS KAET public affairs show Horizon on January 22, 2003 (elipses indicate statement quoted in text above): Grant: You are a strong supporter of school district consolidation. Horne: Yes, I am . . . . Grant: What about the local control issue? That’s the one that is always brought up and in fact was mentioned in the package. NOTES
  • 33. January 12, 2004 33 Horne: Well, there is an ideal size for a school district, sufficiently large for economies of scale but small enough so that people have a say in the school district and that’s probably around 30,000 students or so. But we have districts with just a few hundred students. So we can still have local control and still have the district be large enough so that they have the economies of scale. 9. Tom Horne, “Finances, quality and politics point to consolidation,” Arizona Republic, December 29, 2002. Though Horne does not specify the precise size of the small, large, and very large districts to which he refers, according to the OAG, small districts have between 200 and 599 average daily membership (ADM); medium districts have between 600 and 4,999 ADM; and large districts have 5,000 or more ADM. See n. 13 below. The NCES adds a category for extra-large districts, which have an ADM of 15,000 or more. See Digest of Education Statistics 2002, Table 90. The OAG also refers to “super-large schools,” which have more than 40,000 students. See Dollars Spent in the Classroom, Table 2, p. 9; cf. n. 30 below. Arizona has only two “super-large” districts (Mesa USD and Tucson USD). 10. John T. Wenders, “School District Consolidation is a Bad Idea: Large Districts Don’t Serve Students.” Internet Education Exchange, http://www.iedx. org/printer_friendly_1.asp?SectionGrou pID=NEWS&ContentID=EN578, reprinted with permission of The Thomas B. Fordham Foundation from Education Gadfly, vol. 3, no. 12, April 10, 2003. 11. Ibid. For more detailed information on Los Angeles Unified School District and Clark County School District, see http://www.lausd.k12.ca.us/lausd/office s/Office_of_Communications/ and http://ccsd.net/admin/images/update02 .pdf. 12. Marvin E. Dodson III and Thomas A. Garrett, Inefficient Education Spending in Public School Districts: A Case for Consolidation, The Federal Reserve Bank of St. Louis, Working Paper Series, 2002-010C, rev. April 2003, pp. 37-38, http://research. stlouisfed.org/wp/2002/2002-010.pdf; see also Wenders, “School District Consolidation is a Bad Idea;” Mary F. Hughes and James E. Metzger, Restructuring: Cost Savings and Benefits, Arkansas Public School Districts, February 2003, http://rsdweb.k12.ar.us/pdf/ Legislation/efficiency%20study.pdf; Graham Garner, “Legislature considers school district mergers,” Idaho State Journal, August 22, 2003, http://www. journalnet.com/articles/2003/03/22/ne ws/local/news07.txt; Testimony on School District Consolidation Before House Committee on Education, by Mark Thallam, Kansas Association of School Boards, February 18, 2003, http://www.kasb.org/districtconsolidati ontesth.pdf; and Firstline Midwest, The Midwestern Office of The Council of State Governments, vol. 8, no. 3, March 2001, http://www.csgmidwest.org/mem ber_services/flmw/2001/0301.pdf.
  • 34. GOLDWATER INSTITUTE I policy report 34 13. Factors Affecting, 2002, Table 5, p. 17. Very small districts have less than 200 ADM, small districts have between 200 and 599 ADM, medium-sized districts have between 600 and 4,999 ADM; and large districts have 5,000 ADM or more. According to the OAG’s March 2002 report, there are 233 regular school districts in Arizona. See Davenport, Dollars Spent in the Classroom, p. 3. For definitions of other kinds of school districts not examined by the OAG, see Factors Affecting, 2002, Appendix B, p. b-i. According to the NCES, as of the 2000-01 school year, there are 14,859 regular school districts in the United States. See Digest for Education Statistics 2002, Table 87. Arizona’s 233 regular school districts constitute a mere 1.6 percent of the nationwide total, even though the state was second only to Nevada in terms of population growth from 1990 to 2000 (Arizona’s population growth was 40 percent and Nevada’s, 66.3 percent), according to the U.S. Census Bureau, Census 2000. On Arizona’s enrollment growth, see p. 17 above and n. 104 below. 14. Factors Affecting, 2002, pp. 5 and 9. 15. Shultz, “A Case for Unification,” p. 4; Tom Horne, “Finances, quality and politics point to consolidation,” Arizona Republic, December 29, 2002. 16. When Goldwater Institute education analyst Murray cited this estimate to Superintendent Horne during her July 17, 2003, interview, he stated that around 40 districts or fewer would be optimal. 17. Ibid. See also Factors Affecting, 2002, p. 3. It is interesting to note that according to the OAG’s 2002 findings, Arizona’s administrative spending is on par with the national average, which has been roughly 11 percent of education expenditures since 1994, and administrative costs as a part of total educational expenditures in Arizona have actually decreased slightly from 11.3 percent as reported by the OAG in 2000 to 10.8 percent as it reported in 2002; cf. Factors Affecting, 2000, p. 3. 18. Factors Affecting, 2002, Figure 1, p. 2. 19. Factors Affecting, 2002, p. 1 (“What are administrative costs”). 20. The OAG reached this conclusion even after exempting 50 of the smallest school districts with fewer than 200 students from its analysis. See Factors Affecting, 2002, p. 15, n. 2. 21. Factors Affecting, 2002, Figure 1, pp. 1 and 2. 22. Ibid. 23. Ibid., p. 5. 24. Ibid., p. 3, Figure 3. Salaries constitute nearly three-quarters of all types of administrative costs (71 percent). Benefits are a distant second at 13 percent, followed closely by purchased services at 11 percent, supplies at 3 percent, and other administrative costs at 2 percent.
  • 35. January 12, 2004 35 25. Davenport, Dollars Spent in the Classroom, p. 11. 26. See Factors Affecting, 2002, p. 3 and Table 6. The 2001 ADMs were calculated by taking the total cost column amounts in Table 6 and dividing them by the per-pupil cost amounts. 27. In a current cost-benefit analysis of consolidation in Arkansas public school districts, for example, school district size is one of four separate efficiency categories (fiscal, academic achievement, and administrative), and was assigned five separate efficiency indicators: ADM per school, ADM per grade, pupil- teacher ratio, student-administrator ratio, and average daily attendance (ADA). See Hughes and Metzger, Cost Savings and Benefits, Arkansas Public School Districts, pp. 11-13, http://rsdweb.k12.ar.us/pdf/Legislation/ efficiency%20study.pdf. 28. On consolidation decreasing the number of individual schools, see pp. 16. 29. Factors Affecting, 2002, Tables 1 and 2, pp. 6 and 10. 30. School district size is categorized by ADM. See n. 13. The NCES adds a further category for extra-large districts, which have an ADM of 15,000 or more. See Digest of Education Statistics 2002, Table 90. Elsewhere, the OAG refers to “super-large schools,” which have more than 40,000 students. See Davenport, Dollars Spent in the Classroom, Table 2, p. 9. 31. Factors Affecting, 2002, Table 1, p. 6. The number of students for each district listed in Table 1 and subsequent tables is not provided in the OAG’s 2002 report. The 2001 ADMs were calculated by taking the total cost column amounts in Table 6 and dividing them by the per- pupil cost amounts. 32. Mobile ESD, 15 students; and Phoenix UHSD, 21,115 students. 33. Roosevelt ESD, 10,856 students; and Phoenix UHSD, 21,115 students. 34. While nine districts were originally selected by the OAG as having particularly low administrative costs, one had a data error that artificially deflated its costs. It was therefore removed. See Factors Affecting, 2002, p. 9. 35. Factors Affecting, 2002, Table 2, p. 10. 36. The 2001 ADM was calculated by taking the total cost column amount in Table 6 and dividing it by the per-pupil cost amount. 37. Data errors were responsible for decreasing costs in two of the five low- cost districts, and a third district, Blue Elementary, is unique. Since that district has only two pupils, the county superintendent performs the district’s administrative duties at no charge. See Factors Affecting, 2002, p. 11. 38. Unlike its previous analyses, the OAG did not include supply costs when