
Recommended
More Related Content
What's hot
What's hot (9)
Similar to Luxembourg Market Assessment 2019
Similar to Luxembourg Market Assessment 2019 (20)
Recently uploaded
Recently uploaded (20)
Luxembourg Market Assessment 2019
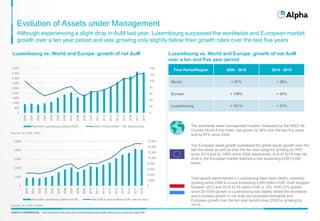
- 1. STRICTLY CONFIDENTIAL The content of this document may not be disclosed to third parties without prior consent from Alpha FMCSTRICTLY CONFIDENTIAL The content of this document may not be disclosed to third parties without prior consent from Alpha FMC 1 Evolution of Assets under Management Luxembourg vs. World and Europe: growth of net AuM The worldwide asset management market, measured by the MSCI All Country World Price index, has grown by 36% over the last five years and by 97% since 2008. Although experiencing a slight drop in AuM last year, Luxembourg surpassed the worldwide and European market growth over a ten year period and was growing only slightly below their growth rates over the last five years Sources: Alfi, CSSF, MSCI. 0 20 40 60 80 100 120 140 0 500 1,000 1,500 2,000 2,500 3,000 3,500 4,000 4,500 2000 2001 2002 2003 2004 2005 2006 2007 2008 2009 2010 2011 2012 2013 2014 2015 2016 2017 2018 Net AuM Luxembourg (billions EUR) MSCI World (2000 = 100; second axis) Sources: Alfi, CSSF, EFAMA Total assets administered in Luxembourg have been nearly constanty growing since 2008 to a size exceeding 4,000 billion EUR. AuM dropped between 2017 and 2018 by 95 billion EUR or -2%. With 31% growth since 2014 the growth in Luxembourg was slightly below the worldwide and European growth in net AuM but exceeded worldwide and European growth over the ten year period since 2008 by growing by 161%. The European asset growth surpassed the global equity growth over the last five years as well as over the ten year range by growing by 39% since 2014 and by 148% since 2008 respectively. End of 2018 total net AuM in the European market reached a size exceeding EUR15,000 billion. 0 2,000 4,000 6,000 8,000 10,000 12,000 14,000 16,000 2000 2001 2002 2003 2004 2005 2006 2007 2008 2009 2010 2011 2012 2013 2014 2015 2016 2017 2018 0 1,000 2,000 3,000 4,000 5,000 Net AuM Luxembourg (billions EUR) Net AuM Europe (billions EUR; second axis) Time Period/Region 2008 - 2018 2014 - 2018 World + 97% + 36% Europe + 148% + 34% Luxembourg + 161% + 31% Luxembourg vs. World and Europe: growth of net AuM over a ten and five year period