1. Tung Anh Nguyen
Investment Analysis Report
1
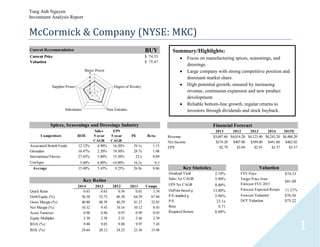
McCormick & Company (NYSE: MKC)
2011 2012 2013 2014 2015E
Revenue $3,697.60 $4,014.20 $4,123.40 $4,243.20 $4,400.20
Net Income $374.20 $407.80 $389.00 $441.60 $462.02
EPS $2.79 $3.04 $2.91 $3.37 $3.57
Financial Forecast
2014 2013 2012 2011 Comps
Quick Ratio 0.63 0.65 0.56 0.61 1.34
Debt/Equity (%) 56.58 52.73 46.30 64.29 67.84
Gross Margin (%) 40.80 40.39 40.29 41.27 32.85
Net Margin (%) 10.32 9.43 10.16 10.12 8.43
Asset Turnover 0.96 0.96 0.97 0.99 0.93
Equity Multiplier 2.38 2.38 2.51 2.46 2.39
ROA (%) 9.88 9.03 9.88 9.97 7.45
ROE (%) 24.64 20.12 24.23 23.36 15.48
Key Ratios
Competitors ROE
Sales
5-year
CAGR
EPS
5-year
CAGR
PE Beta
Associated British Foods 12.12% 6.90% 16.20% 39.1x 1.15
Givaudan 16.47% 2.20% 19.30% 28.7x 1.08
International Flavors 27.65% 5.80% 15.50% 23.x 0.89
ConAgra 5.68% 6.80% -14.00% 16.2x 0.3
Average 15.48% 5.43% 9.25% 26.8x 0.86
Spices, Seasonings and Dressings Industry
Current Recommendation BUY
Current Price 74.33$
Valuation 75.47$
0
1
2
3
4
5
Buyer Power
Degree of Rivalry
New EntrantsSubstitutes
Supplier Power
Dividend Yield 2.10%
Sales 5yr CAGR 5.90%
EPS 5yr CAGR 8.00%
DuPont-based g 13.80%
P/E-implied g 5.96%
P/E 23.1x
Beta 0.71
Required Return 8.00%
Key Statistics
FYE Price 74.33$
Target Price from
Forecast FYE 2015
81.08$
Forecast Expected Return 11.21%
Forecast Valuation 76.56$
DCF Valuation 75.22$
Valuation
Summary/Highlights:
Focus on manufacturing spices, seasonings, and
dressings.
Large company with strong competitive position and
dominant market share.
High potential growth, ensured by increasing
revenue, continuous expansion and new product
development.
Reliable bottom-line growth, regular returns to
investors through dividends and stock buyback.
2. Tung Anh Nguyen
Investment Analysis Report
2
Introduction
Based in Sparks, MD, McCormick & Company is a Fortune 100 company that manufactures spices, seasonings, extracts, marinades, specialty
foods, and flavors for retail, commercial, and industrial markets. The company operates through two main segments: consumer and industrial. The
consumer segment channels the company’s products to consumers via the retail markets, including grocery stores, warehouse clubs, mass
merchandise stores, and drug stores. The industrial segment targets food manufacturers and food service customers. The products are sold directly
and indirectly through various distributors.
Economic Environment and Industry Dynamics
Like everything else in the business world, the performance of McCormick & Company
is largely affected by the state of the economy. By examining the ten-year percentage
change data of some of the most influential economic indicators on the company, we
can conclude that the outlook for the US economy is generally positive. The first
indicator is Disposable Income Level. This indicator not only captures the current status
of the entire economy but also provide background information on consumers’ level of
financial confidence. The fluctuation of the average disposable income level in the past
10 years is
demonstrated in
Figure 1*
. As can be
observed, disposable
income is a high-
growth indicator and is minimally affected by the financial crisis (a mere
0.47% drop). Following the event, disposable income has been growing at
decent positive rates, which is a definitive sign of healthy recovery and good
news for industries that heavily rely on consumers’ disposable income such as
entertainment, luxury goods, specialty items, etc. McCormick state in their
annual reports that the most important ingredient for their products is rice;
therefore, the fluctuation in the price of rice would have major impacts on the
*
Figures 1-6 are to be found in Appendix I.
3. Tung Anh Nguyen
Investment Analysis Report
3
company’s operations. As can be seen in Figure 2, following the financial crisis, rice has made minimal gains and lost a significant amount of
value in 2014. This commodity tells the same story that oil does: abundant
supply and weak demand. An article from Bloomberg published in October
2014 shows that output from Thailand and India had doubled the month before
while Myanmar’s was expected to increase by 15% toward the end of the year;
US’ production was also anticipated by the Department of Agriculture to rise
to a four-month high. These optimistic figures not only imply the increasing
efficiency of the industry but also indicate the rebounding and favorable
economic landscape that fuels the industry’s production. In addition, the falling
price of rice is an ideal opportunity for McCormick to cut costs and
significantly increase their margins since rice plays such a crucial role in their
production. The final indicator that is essential for the McCormick is
consumers’ demand for their product. FactSet provides a comprehensive data
set of personal consumption in the US, and spices and seasonings would fall under its “Other Foods” category, the 10-year fluctuation of which is
presented in Figure 3. It can be inferred from the graph that, similar to the average disposable income level, consumption of foods in this category
is minimally affected by the financial crisis, with only a mere drop of 0.07% in 2009. Even though the percentage increases thereafter are less than
the years before 2009, they represent a steady upward trend; this is extremely favorable news for McCormick because this trend suggests that
consumers are willing to incur the cost of spices and seasonings regardless of the states of the economy. Overall, it has been seven years since the
Great Recession and the US has made reliable progress with proven data. Therefore, there are good reasons why economists and forecasters are
positive about the US economy in 2015.
The output of the manufacturing industry depends heavily on the following indicators:
Consumer Price Index, Producer Price Index, and Consumer Sentiments. The
Consumer Price Index, or CPI, measures the weighted average of prices of a basket of
consumer goods and services, such as transportation, food and medical care. Therefore,
changes in CPI are interpreted as changes in the cost of living: a higher index indicates
higher prices of consumer products, which may cause food processors like McCormick
to adjust its price upward, thus reducing sales. Figure 4 illustrates the fluctuations of
CPI for the last 10 years. The Producer Price Index, or PPI, tracks the price level of raw
materials that are used by the manufacturing sector. A rise in PPI signals increasing
cost of goods sold, thus reducing producers’ margins and vice versa. As can be seen
from Figure 5, prices of raw materials took an tremendous hit in the year following the
bull market of 2008 (decreased by 2.26%) but rebounded strongly and steadily in the
following three years. These positive numbers might mean rising costs for manufacturers, but for the last three years, PPI has been growing at a
4. Tung Anh Nguyen
Investment Analysis Report
4
much slower rate than CPI, which means revenue inflow is more than enough to compensate for the higher costs (given stable sales of course).
The Consumer Sentiment Index, or CSI, measures the health of the overall economy as determined by consumer opinion, which takes into account
an individual’s feeling toward his or her own financial health and the long-term
outlook for the economy. The data presented in Figure 6 is provided by University
of Michigan’s Survey of Consumers. The index plummeted a significant 25.47% in
2008 due to the financial crisis but has been increasing ever since despite a 6.13%
drop in 2011. Increased consumer sentiment is always a good sign for manufacturers
of consumer products because, more than anything, it means that consumers are
optimistic about their own financial status and would thus be willing to spend more
on non-essential items.
In short, our examination of the Consumer Price Index, the Producer Price Index and
the Consumer Sentiment Index reveals an opportune future for the manufacturing
sector. Indeed, it is quite fair to be optimistic about a sector that accounts for almost
13% of total GDP in the scenario of a strong economic recovery. An integral part of this sector is the seasoning and dressing manufacturing
industry, which we examine next.
McCormick & Company is characterized as a seasoning and dressing
manufacturer, an industry that includes companies that make spices, dry gravy
mixes, seasoning mixes, salad dressings, sauces, and natural extracts. Within
the US, there are about 600 such companies that generate combined annual
revenue of $18 billion. Major companies include US-based Kraft Heinz and
McCormick, along with Ajinomoto and Kikkoman (both headquartered in
Japan), Givaudan (Switzerland), Kerry Group (Ireland), and Unilever (the
Netherlands). The industry within the US had total revenue of $3.1 billion in
2010, representing a CAGR of 2.5% from 2006 to 2010. In comparison, the
industry within the European and Asia-Pacific areas grew with CAGRs of
8.2% to $13.6 billion and 7.6% to $34.3 billion respectively over the same
period. The spice, seasoning and dressing manufacturing industry is mature
and highly competitively due to the wide variability of its products. The US market is greatly concentrated as the top 50 largest companies account
for 70% of total industry revenue. Due to this level of concentration, major producers possess substantial purchasing, distributing and marketing
advantages over smaller producers, whose only competitive edge include exotic sauces, rare herbs, and compelling customized spice blends and
extracts. According to an industry analysis report by MarketLine, the industry is expected to growth with an anticipated CAGR of 3.3% between
2010 and 2015, driving the industry to a value of $3.6 billion by the end of 2015.
5. Tung Anh Nguyen
Investment Analysis Report
5
Porter’s Five Forces Analysis
Buyer Power
Buyers in the spices, seasoning and dressing industry consist of wholesale dealers and individual consumers. There are an extremely small number
of wholesale dealers that retail spices, seasoning and dressing exclusively, which makes service differentiation for buyers less of a pressing
problem. This is offset somewhat by the limited power of individual consumers who—while having many options for one certain spice—are not
willing and able to substitute essential spices such as salt and pepper. Products in this industry are largely undifferentiated and offered by a lot of
competition, which increases buyer power. However, restricted possibilities of differentiation exist in certain cases, for products such as teas and
coffees which are fair-trade, organic or sourced domestically for example. Some buyers may prefer products that are grown domestically due to
consumers’ trend to support local businesses. Overall, buy power in the spices, seasoning and dressing industry appears moderate.
Supplier Power
Suppliers in the spices, seasoning and dressing industry include fertilizer providers, manufacturers of cultivating and farming equipment and labor,
land and crop suppliers, amongst others. The prevention of pests, fungal diseases and weed as well as growth stimulation is crucial to the yield and
thus to the quantity and quality of spices. This job is done through chemical control, i.e. using pesticides, fungicides and fertilizer, to allow spice
crops to be grown more efficiently. Fertilizer products are typically manufactured and supplied by large chemical companies, whose products are
highly demanded, which gives them a boost in pricing power. However, fertilizer products are often comprised of fairly elementary and
straightforward chemicals, which means, like spices, differentiation is difficult. This reduces chemical companies’ pricing power. In addition,
some spice manufacturers prefer products of organic farming practices (for example, using animal waste instead of artificial fertilizer), which
further diminishes the pricing power of chemical companies. Manufacturers of grinding and milling machines are also integral to the making of
spice and seasoning powders. These tend to be large sized, globally present companies who possess highly unique service offerings, which in turns
give them substantial pricing power. In short, supplier power in the spices, seasoning, and dressing industry seems moderate thanks to all these
factors.
New Entrants
In order to enter the business of spice, seasoning and dressing manufacturing, new players have to incur the following costs: purchase of arable
land, processing plants, and sufficient working capital to sustain initial operations. Because of the large-scale and complex nature of agricultural
practices, it is often impracticable for entry-level businesses to build up from small scale holdings. Geographical diversification also plays a
fundamental part in this industry as different crops require different climate settings to grow. Therefore, major export and import deals for
necessary crop are crucial, of which new businesses might not be largely capable. On the other hand, due to the outrageous number of brands
available for the same types of spice, brand loyalty is essentially non-existent in this industry, which means new entrants can compete by
introducing exceptionally exclusive products. In general, the threat of new entrants in the spice, seasoning, and dressing industry appears low.
6. Tung Anh Nguyen
Investment Analysis Report
6
Threat of substitutes
As mentioned several time throughout this report, consumers face an abundant amount of brands for the same product in the spices section of their
favorite grocery stores. Therefore, it is fair to expect an extremely low level of brand loyalty for spices, seasoning, and dressing. The threat of
substitutes is, hence, enormous in this industry.
Degree of rivalry
The total sales of the spices, seasoning and dressing industry comes primarily from large corporations who has their own plantations yet the
majority of the industry comprises of small to medium sized farmers. This actually reduces rivalry since bigger players compete for common
products (salt, pepper, common herbs, etc.) market share on a higher platform, giving smaller players a chance to differentiate and compete for
more unique products (steak seasoning blends, flavored salt, etc.). Therefore, rivalry seems moderate for the spices, seasoning and dressing
industry.
McCormick & Company faces the following major competitors: Associated British Foods (Ach Food Companies, Inc.), Givaudan, International
Flavors, and ConAgra Foods, Inc, the information of which is presented in Figure 7 below:
Shares Enterprise Enterprise
Company Shares Market O/S Enterprise Value/ Value/
Name Price Outstanding Value Diluted Value Sales EBIT EBITDA EBIT EBITDA
McCormick 75.84 115.8 9,698.6 129.3 10,959.8 4,260.2 606.4 707.2 18.07x 15.50x
Average 58.08 327.2 18,997.8 327.4 21,731.4 11,309.2 1,177.5 1,633.7 18.68x 13.82x
Median 39.77 253.9 16,684.5 254.2 21,196.0 10,486.9 1,204.9 1,662.5 18.35x 13.97x
Associated British Foods 42.02 791.7 33,267.9 791.7 34,711.3 21,174.6 1,694.3 2,514.5 20.49x 13.80x
Givaudan 36.93 9.2 17,346.0 9.3 18,050.5 4,810.9 782.2 1,099.0 23.08x 16.43x
International Flavors 115.85 80.7 9,354.4 81.3 9,822.3 3,088.5 605.7 695.0 16.22x 14.13x
ConAgra 37.52 427.1 16,023.0 427.1 24,341.6 16,162.9 1,627.7 2,226.1 14.95x 10.93x
Figure 7
7. Tung Anh Nguyen
Investment Analysis Report
7
Financial Analysis
Ratios obtained from FactSet
Liquidity Ratios
Current Ratio
For the past 5 years, McCormick has been fairly liquid (5-year average is 1.22). From 2009 to 2011, current ratio increased consistently (2.6% and
1.17%). There is a sharp drop of 12.09% in 2012, which was followed by a sharp rise of 19.08% in 2013. In 2014, current ratio is at 1.26 while
2014 comp average is 2.20.
Quick Ratio
Past 5-year average is 0.62. Year-to-year figures have been stable, except for the sharp drop of 7.96% in 2012 to 0.56, which, predictably, was
followed by a sharp increase of 15.53% to 0.65 in 2013. 2014 figure is 0.63 while comp average is 1.34.
Cash Ratio
Past 5-year average is 0.06. Year-to-year figures have been stable. Unlike the other two ratios, cash ratio in 2012, 0.7, is the highest among the last
5 years. 2014 cash ratio is also 0.7 and comp average is 0.44.
Analysis & Conclusion
McCormick’s current and quick ratios took a hit in 2012 due to a smaller increase in current assets (5.11%) than in current liabilities (19.56%).
These two ratios rebounded strongly in 2013, however, thanks to a decrease in current liabilities (-10.48%) and an increase in current assets
(6.60%). Its cash account has been able to keep up with the changes in its current liabilities, which explains the consistency of the cash ratio. These
ratios are still smaller than its competitors, however. Therefore, overall, McCormick seems to be fairly less liquid than its competitors.
Activity Ratios
Asset Turnover
Past 5-year average is 0.97. The ratio fluctuates very little around the average in the last 5 years. 2014 asset turnover is 0.96, which is higher than
comp average of 0.93.
Inventory Turnover
8. Tung Anh Nguyen
Investment Analysis Report
8
Past 5-year average is 3.89. The ratio has been declining persistently ever since 2009 by 2% to 3% per year. The sharpest decline, -5.06%, is in
2014. 2014 figure is 3.61 while comp average is 4.58.
Analysis & Conclusion
McCormick’s asset turnover has been stable for the last 5 years because changes in assets have been offset fairly by corresponding changes in
sales, both of which have been positive from 2009 to 2013. Ever since 2009, McCormick’s inventories have been increasing year after year,
especially during 2011 when there was a 28.50% inventory increase, which was the result of McCormick’s acquisition of Kamis, a Polish spices
and seasonings manufacturer. Growth in inventories has been higher than that of sales, which explains the declining inventory turnover ratio.
Overall, compared to comps, McCormick is slightly more efficient in utilizing assets but considerably slower to sell their increasing inventories.
Leverage Ratios
Long-Term Debt/Equity
Past 5-year average is 0.55. This ratio fluctuates widely over the last 5 years: -18.17% in 2010, +19.83% in 2011 and -28% in 2012. 2014 figure is
0.57 while comp average is 0.68.
EBIT/Interest Expense
Paste 5-year average is 10.28x. McCormick’s time interest earned has been increasing consistently for the last 5 years. 2014 figure is 11.18x while
comp average is 11.40x.
Analysis & Conclusion
McCormick displays unstable debt/equity ratio over the last 5 years. Looking at long-term debt and shareholders’ equity separately, we can see
that equity has been increasing uniformly but long-term debt fluctuates s. Time interest earned ratio provides a much more stable and favorable
outlook. McCormick’s EBIT growth has been positive for the last 10 years while interest expense has generally been reduced, which explains the
consistent gain in time interest earned.
Profitability Ratios
Gross Margin
Past 5-year average is 41.05%. There are very slight fluctuations in gross margin since 2009. 2014 figure is 40.80% while comp average is
32.85%.
EBIT Margin
9. Tung Anh Nguyen
Investment Analysis Report
9
Past 5-year average is 14.70%. EBIT margin declines every year since 2009, but very slightly. 2014 figure is 14.36% while comp average is
13.40%.
Net Margin
Past 5-year average is 10.32%. Net margin dropped from 11.09% in 2010 to 9.43% in 2013, a 15% loss in value. However, it rose to 10.32% in
2014, which is a 9.40% value increase. 2014 comp average is 8.43%.
Analysis & Conclusion
Sales, gross profit and EBIT growth of McCormick have been positive for the last 5 years. Net income, however, dropped 2.4% in 2013, but
increased 12.57% the following year. All three margins are significantly higher than comps. Therefore, outlook for McCormick’s profitability is
positive.
DuPont Analysis
Return on Assets
McCormick’s ROA has been fairly stable thanks to steady asset turnover and net margin.
Return on Equity
McCormick’s ROE has been fairly stable thanks to steady ROA and leverage.
Analysis & Conclusion
Outlook for McCormick & Company based on ROA and ROE is neutral because its ROA and ROE have been staying around their 5-year average.
The stability of these ratios is derived from the stability of their components. Indeed, there have been very little fluctuations in the company’s asset
turnover, net margin and equity multiplier. On the other hand, McCormick’s 2014 asset turnover and net margin are much higher than its comps
while it is only slightly more leveraged, which is hardly an issue because as discussed above, the company’s increasing time interest earned ratio is
fairly reassuring. This boosts confidence in the company’s outlook.
10. Tung Anh Nguyen
Investment Analysis Report
10
Financial Forecast
Figure 8 provides our forecasts for McCormick & Company in the fiscal years 2015, 2016 and 2017:
Sales & Net Income Forecast
FY '09 FY '10 FY '11 FY '12 FY '13 FY '14 FY '15E FY '16E FY '17E
NOV '09 NOV '10 NOV '11 NOV '12 NOV '13 NOV '14 NOV '15 NOV '16 NOV '17
Sales 3,192.10 3,336.80 3,697.60 4,014.20 4,123.40 4,243.20 4,400.20 4,567.41 4,754.67
Sales Growth (YoY%) 4.50% 10.80% 8.60% 2.70% 2.90% 3.70% 3.80% 4.10%
Net Income 299.80 370.20 374.20 407.80 389.00 441.60 462.02 475.01 494.49
Net Income Growth (YoY%) 23.48% 1.08% 8.98% -4.61% 13.52% 4.62% 2.81% 4.10%
Net Income Margin 9.39% 11.09% 10.12% 10.16% 9.43% 10.41% 10.50% 10.40% 10.40%
EPS Forecast
FY '09 FY '10 FY '11 FY '12 FY '13 FY '14 FY '15E FY '16E FY '17E
NOV '09 NOV '10 NOV '11 NOV '12 NOV '13 NOV '14 NOV '15 NOV '16 NOV '17
Shares Outstanding (Diluted) 132.30 134.70 134.30 134.30 133.60 131.00 129.30 128.01 126.73
EPS 2.27 2.75 2.79 3.04 2.91 3.37 3.57 3.71 3.90
EPS Growth (YoY%) 21.10% 1.50% 8.80% -4.10% 15.80% 6.00% 3.85% 5.15%
DPS Forecast
FY '09 FY '10 FY '11 FY '12 FY '13 FY '14 FY '15E FY '16E FY '17E
NOV '09 NOV '10 NOV '11 NOV '12 NOV '13 NOV '14 NOV '15 NOV '16 NOV '17
DPS 0.98 1.04 1.12 1.24 1.35 1.47 1.59 1.68 1.85
DPS Growth (YoY%) 6.12% 7.69% 10.71% 8.87% 8.86% 7.87% 6.18% 9.91%
Payout Ratio 43% 38% 40% 41% 46% 44% 44% 45% 47%
Retention Ratio 57% 62% 60% 59% 54% 56% 56% 55% 53%
PE & Price Forecast
FY '09 FY '10 FY '11 FY '12 FY '13 FY '14 FY '15E FY '16E FY '17E
NOV '09 NOV '10 NOV '11 NOV '12 NOV '13 NOV '14 NOV '15 NOV '16 NOV '17
PE Ratio 15.7x 16.x 17.5x 21.3x 23.7x 22.x 22.69x 22.69x 22.69x
Stock Price FYE 35.68 44.01 48.70 64.56 69.00 74.33 81.08 84.20 88.54
Expected Return
(Based on Previous Year Price)
26% 13% 35% 9% 10% 11% 6% 7%
Figure 8
11. Tung Anh Nguyen
Investment Analysis Report
11
Sales & Net Income
In a recent earning call, McCormick’s chief financial officer, Mr. Gordon M. Stetz voiced his expectation that the company is projected to increase
its sales by 4% to 6% in fiscal year 2015. However, forecasts of analysts from Credit Suisse, Deutsch Bank Research, Bernstein Research, Athlos
Research, and Keybanc Capital Market are in the range of positive 0.5% to 1.5%. Based on historical sales growth, McCormick’s two newest
acquisitions, and its overall growth strategy, we’ve decided to be more optimistic and project a growth rate of 3.70% for fiscal year 2015. We stay
just 0.3% below Mr. Stetz’s low estimate because despite the company’s strong outlook, the current strength of US dollar might pose a problem to
sales figures as McCormick is heavily exposed to foreign markets, which account for 39% of its revenue.
We project a net margin of 10.5% for fiscal year 2015 for two reasons. First, we believe strongly in the company’s ongoing Comprehensive
Continuous Improvement (CCI) program that started back in 2009. According to a Zacks Investment Research report on McCormick, the
program generated up to $65 million cost savings in 2014, which beat general expectation of $50 million. The company aims to increase this
amount by $85 million in 2015. In addition, McCormick is working toward improving its manufacturing productivity with reorganization activities
in the EMEA region and cutting selling, general and administrative costs in America. According to Zacks, these initiatives will generate an
additional cost saving of $10 million in 2015. Second, the conservative net margin of 10.5%, which is only 0.1% higher than 2014 figure, reflects
our concerns for fluctuating commodity prices, particularly dairy products and wheat, which are two of the main raw materials of McCormick’s
production. The prices of these commodities are expected to rise strongly in 2015, which could ultimately reduce the company’s bottom line.
EPS and DPS
McCormick’s chief executive officer, Mr. Alan D. Wilson, expressed his confidence over the company’s strong cash flow in a recent earning call.
This enables the company to improve shareholders’ return by increasing its dividends and share buyback activity. In fact, Mr. Wilson claimed that
McCormick’s is able to lower average shares outstanding by 2% per year. Indeed, historical data of diluted shares outstanding verifies this trend,
which is why we project a 1% decrease for each of the next 3 years, leaving us with EPS’s of $3.57, $3.71 and $3.90 for fiscal year 2015, 2016
and 2017 respectively. DPS is also projected to increase 6% to 10% in this period thanks to reliable historical growth.
PE, Valuations Using PE Method and Expected Return
Figure 9 provides information on our stock valuations using three different PE ratios:
(Next page)
12. Tung Anh Nguyen
Investment Analysis Report
12
Using a 52-week beta of 0.71, a risk-free rate of 3% and a market return of 10%, we arrive at a required rate of return of 8% for McCormick and
thus come up with three different valuations using three PE ratios. We’ve decided to use a weighted average of the three sources to come up with a
PE ratio for FY 2015. We put 10% more emphasis on comp average PE since we believe the performance of McCormick’s competitors have a
more direct impact on the company’s current performance while the other two PE’s are slightly less relevant. As can be seen in Figure 8, the
expected return for next year based on our projection of stock price and dividend is 11%.
Based on our forecast, McCormick & Company is undervalued by 3% of its current price.
Weights
PE Ratios
FY 2015
Target Price
FY 2015
Valuation
FYE 2014
Closing Price
FYE 2014
OV or UV
By ___ % of
Closing Price
McCormick's Last Year 30% 22.x 78.61 74.28 74.33 Overvalued -0.07%
Analysts' Estimates (Source: FactSet) 30% 21.7x 77.54 73.28 74.33 Overvalued -1.41%
Comp Average 40% 23.95x 85.58 80.73 74.33 Undervalued 8.61%
Beta 0.71
Required Return 8%
Weighted Average & Outcomes 22.69x 81.08 76.56 74.33 Undervalued 3.00%
Figure 9
13. Tung Anh Nguyen
Investment Analysis Report
13
Valuation
Figure 10 provides information on our long-term growth rate forecast:
Figure 11 illustrates our DPS and exit price forecast as well as our valuation:
Simple ROE Forecast
FY '09 FY '10 FY '11 FY '12 FY '13 FY '14 FY '15E FY '16E FY '17E
NOV '09 NOV '10 NOV '11 NOV '12 NOV '13 NOV '14 NOV '15 NOV '16 NOV '17
Net Income 299.80 370.20 374.20 407.80 389.00 441.60 462.02 475.01 494.49
Total Shareholders' Equity 1,335 1,454 1,602 1,683 1,933 1,792 1,913 1,944 1,941
Simple ROE 22.46% 25.46% 23.36% 24.23% 20.12% 24.64% 24.15% 24.43% 25.48%
Growth Forecast
FY '09 FY '10 FY '11 FY '12 FY '13 FY '14 FY '15E FY '16E FY '17E
NOV '09 NOV '10 NOV '11 NOV '12 NOV '13 NOV '14 NOV '15 NOV '16 NOV '17
Retention Rate 57% 62% 60% 59% 54% 56% 56% 55% 53%
Implied Long-Term Growth Rate
(g = Retention Rate × ROE)
12.80% 15.79% 14.01% 14.30% 10.87% 13.80% 13.53% 13.44% 13.50%
Figure 10
DPS, Exit Price Forecast & Valuation
FY '14 FY '15E FY '16E FY '17E
NOV '14 NOV '15 NOV '16 NOV '17
DPS Forecast Based on g 1.47 1.67 1.89 2.15
Exit Price Based on PE Method 88.54
Beta 0.71
Required Return 8%
Valuation 75.22
Closing Price FYE 2014 74.33
OV or UV UV
By ___ % of Closing Price 1.19%
Figure 11
14. Tung Anh Nguyen
Investment Analysis Report
14
In this valuation, we assume that we will sell the stock at the end of 2017. We use the growth rates computed using ROE and retention rate to
forecast DPS instead of using DPS in our financial forecast, the previous section of the report. We’ve decide to use the PE method to project the
exit price, which we have also done in the previous section, instead of the constant-growth model. The reason for this is that the implied long-term
growth rate of McCormick is higher than our required return, which is unfit for a constant-growth dividend discount model.
Based on our valuation, McCormick & Company is undervalued by 1.19% of its current price.
P/E Analysis
Figure 12 provides growth rate comparison between McCormick and its competitors. The growth rates computed here are based on each
company’s current PE ratios and its ROE.
We can see that McCormick’s current PE ratio is well below comp average and slightly below comp median. In addition, our calculation of growth
rate implied by PE indicates that McCormick’s is growing slightly faster than its comps (by 0.5%). These facts are reassuring since it tells us that
investors are not head over heels with the company, and that the company is being valued correctly. However, the long-term growth rate
(computed using ROE and retention rate) tells us a completely different story. Compared to comps, McCormick’s long-term growth rate is
Company P/E
Required
Return
Beta
Payout
Ratio
Growth
rate
implied by
P/E
Actual EPS
growth past
5 yrs
Growth
rate based
on DuPont
ROE
McCormick 23.2x 7.97% 0.71 44.00% 5.96% 8.00% 14.92% 26.64%
Average 26.9x 8.99% 0.86 73.45% 5.46% 9.25% 6.67% 15.48%
Median 25.9x 9.90% 0.99 58.48% 7.57% 15.85% 5.43% 14.30%
Associated British Foods 39.3x 11.05% 1.15 35.23% 10.06% 16.20% 7.85% 12.12%
Givaudan 28.8x 10.56% 1.08 81.73% 7.51% 19.30% 3.01% 16.47%
International Flavors 23.x 9.23% 0.89 33.99% 7.64% 15.50% 18.25% 27.65%
ConAgra 16.3x 5.10% 0.30 142.86% -3.37% -14.00% -2.43% 5.68%
Figure 12
15. Tung Anh Nguyen
Investment Analysis Report
15
aggressively higher, mostly thanks to its greater-than-average ROE. This ROE figure makes sense because we have concluded, based on our
Financial Analysis, that McCormick is more efficient in utilizing its assets to generate sales and has significantly higher net margin than its comps.
Overall, investors’ outlook for McCormick’s growth is fair despite its much higher growth potential. We think this kind of investors’ sentiment is
desirable because we believe in a long-term investing strategy, which does not tolerate stocks with highly inflated growths and values.
Figure 13 shows our valuation of McCormick’s stock based on the growth rate implied by its current PE ratio:
Based on this valuation, McCormick & Company is undervalued by 0.42% of its current price.
DPS, Exit Price Forecast & Valuation
FY '14 FY '15E FY '16E FY '17E
NOV '14 NOV '15 NOV '16 NOV '17
DPS Forecast Based on g Implied by PE 1.47 1.56 1.65 1.90
Exit Price Based on PE Method 88.54
Beta 0.71
Required Return 8%
Valuation 74.64
Closing Price FYE 2014 74.33
OV or UV UV
By ___ % of Closing Price 0.42%
Figure 13
16. Tung Anh Nguyen
Investment Analysis Report
16
Conclusion
Figure 14 summarizes our three valuations for McCormick:
Each of these valuation methods has their own strengths and weaknesses. Our financial forecast takes into account outlooks of McCormick’s
executives, whose assertions certainly carry much weight since they are insiders. However, for the same reason, they might be incentivized to
project overly optimistic figures in order to appear profitable in investors’ eyes. Indeed, the valuation produced by our financial forecast is the
highest despite our careful measure to be extremely conservative with our assumptions. We believe the other two methods, discounted cash flow
and PE-implied growth, are more reliable because the former employs a growth rate calculated by meaningful and important indicators (ROE and
retention rate) while the latter uses one that the market agrees on.
Taking the average of these three methods, we end up with a valuation that is 1.54% higher than its current price, which is not terribly satisfying.
However, based on the nature of the company’s products and industry, its dominant market share, strong financial position, high growth potential,
and continuous effort to improve bottom line and return to investors, we believe there are more than enough reasons McCormick & Company is a
good buy.
Valuation
FYE 2014
OV or UV
By ___ % of
Closing Price
Financial Forecast $76.56 Undervalued 3.00%
Discounted Cash Flow $75.22 Undervalued 1.19%
Growth Implied by PE $74.64 Undervalued 0.42%
Average $75.47 Undervalued 1.54%
Figure 14
17. Tung Anh Nguyen
Investment Analysis Report
17
Source Citation
McCormick & Co. (2015). Retrieved from http://www.zacks.com/
Seasoning & Dressing Manufacturing (2015). Retrieved from http://www.mergentonline.com/
Spices & Stimulants in the United States (2011). Retrieved from http://www.marketline.com/
Wilson, A. (2015, March 24). 2015 Q1 Earnings Conference Call [Telephone interview].
Wilson, J., & Suwannakij, S. (2014, October 28). Rice Extends Losses After Drop to Four-Year Low on Ample
Supply. Bloomberg. Retrieved from http://www.bloomberg.com/news/articles/2014-10-28/rice-plunges-to-lowest-
in-four-years-on-outlook-for-ample-supply
18. Tung Anh Nguyen (Chris)
Investment Analysis Report
1
Appendix I: Macroeconomic Data Graphs
21. Tung Anh Nguyen (Chris)
Investment Analysis Report
4
Appendix II: 5-Year Income Statement
Data obtained from FactSet
All figures in millions of U.S. Dollar, except per share items
Year/Year growth
Nov '14 Nov '13 Nov '12 Nov '11 Nov '10
365 Days 365 Days 366 Days 365 Days 365 Days
Income Statement
Sales 4,243.20 4,123.40 4,014.20 3,697.60 3,336.80
Cost of Goods Sold (COGS) incl. D&A 2,511.90 2,457.90 2,397.00 2,171.70 1,919.00
Gross Income 1,731.30 1,665.50 1,617.20 1,525.90 1,417.80
SG&A Expense 1,122.00 1,070.70 1,037.80 971.30 907.90
EBIT (Operating Income) 609.30 594.80 579.40 554.60 509.90
Nonoperating Income - Net -0.20 1.20 1.60 -2.50 0.70
Interest Expense 54.50 57.00 57.90 54.70 52.80
Unusual Expense - Net 0.20 39.60 -3.00 6.00 -4.90
Pretax Income 554.40 499.40 526.10 491.40 462.70
Income Taxes 145.90 133.60 139.80 142.60 118.00
Equity in Earnings of Affiliates 29.40 23.20 21.50 25.40 25.50
Consolidated Net Income 437.90 389.00 407.80 374.20 370.20
Net Income 437.90 389.00 407.80 374.20 370.20
Net Income available to Common 437.90 389.00 407.80 374.20 370.20
EPS (recurring) 3.34 3.12 3.02 2.82 2.72
EPS (diluted) 3.34 2.91 3.04 2.79 2.75
Earnings Persistence 91.76 85.65 93.83 76.88 91.96
Dividends per Share 1.48 1.36 1.24 1.12 1.04
22. Tung Anh Nguyen (Chris)
Investment Analysis Report
5
Appendix III: 5-Year Balance Sheet
Data obtained from FactSet
All figures in millions of U.S. Dollar, except per share items
Year/Year growth
Nov '14 Nov '13 Nov '12 Nov '11 Nov '10
365 Days 365 Days 366 Days 365 Days 365 Days
Cash & Short-Term Investments 77.30 63.00 79.00 53.90 50.80
Short-Term Receivables 493.60 495.50 465.90 427.00 386.70
Inventories 713.80 676.90 615.00 613.70 477.60
Other Current Assets 131.50 134.80 125.50 128.30 100.80
Total Current Assets 1,416.20 1,370.20 1,285.40 1,222.90 1,015.90
Net Property, Plant & Equipment 602.70 576.60 547.30 523.10 488.00
Total Investments and Advances 269.30 264.00 227.80 201.90 187.00
Intangible Assets 2,053.00 2,131.90 2,018.80 2,044.20 1,649.90
Other Assets 73.10 107.00 86.10 95.70 78.90
Total Assets 4,414.30 4,449.70 4,165.40 4,087.80 3,419.70
ST Debt & Curr. Portion LT Debt 270.80 214.10 392.60 222.40 100.40
Accounts Payable 372.10 387.30 375.80 366.60 302.70
Income Tax Payable -- -- -- -- --
Other Current Liabilities 479.10 461.70 419.20 404.30 431.70
Total Current Liabilities 1,122.00 1,063.10 1,187.60 993.30 834.80
Long-Term Debt 1,014.10 1,019.00 779.20 1,029.70 779.90
Provision for Risks & Charges 319.10 189.20 368.90 314.80 247.60
Deferred Tax Liabilities 108.20 139.30 56.80 71.50 48.50
Other Liabilities 41.50 91.40 72.70 60.00 46.20
Total Liabilities 2,604.90 2,502.00 2,465.20 2,469.30 1,957.00
Common Equity 1,792.20 1,932.50 1,682.90 1,601.70 1,453.70
Total Shareholders' Equity 1,792.20 1,932.50 1,682.90 1,601.70 1,453.70
Accumulated Minority Interest 17.20 15.20 17.30 16.80 9.00
Total Equity 1,809.40 1,947.70 1,700.20 1,618.50 1,462.70
Total Liabilities & Shareholders' Equity 4,414.30 4,449.70 4,165.40 4,087.80 3,419.70
Balance Sheet
Assets
Liabilities & Shareholders' Equity