Auto Parts Manufacturing Industry Report - HF_L. Tamakloe
mmm_sp15
1. Krause Fund Research
Spring 2015
Hawkeye Pride
Recommendation: HOLD
Analysts
Greg Kordesh
Gregory-kordesh@uiowa.edu
Steven Hensley
Steven-hensley@uiowa.edu
Mitch Ross
Mitch-ross@uiowa.edu
Michael Lewiston
Michael-lewiston@uiowa.edu
Company Overview
3M Co. is a Minnesota-based industrial conglomerate; their
operating segments are Health Care, Safety & Graphics,
Industrials, Consumer, and Electronics and Energy. They
primarily serve office, automobile, chemicals and materials,
construction and aerospace and defense end-markets. 3M
serves most geographic regions, including developing
countries in Africa, the Middle East, and Latin America.
These developing markets account for 55% of foreign
earnings. Their most recent year was marked by an earnings
beat, with sales of $31.8 billion and net income of $4.95
billion.
Stock Performance Highlights
52 week High $170.50
52 week Low $130.60
Beta Value 1.18
Average Daily Volume 2.24 m
Share Highlights
Market Capitalization $105.50 b
Shares Outstanding 635 m
Book Value per share $7.75
EPS (FY’14) $7.52
P/E Ratio 22.10
Dividend Yield 2.01%
Dividend Payout Ratio 45.66%
Company Performance Highlights
ROA 15.85%
ROE 37.71%
Sales $32.82 b
Financial Ratios
Current Ratio 1.96
Debt to Equity 1.38
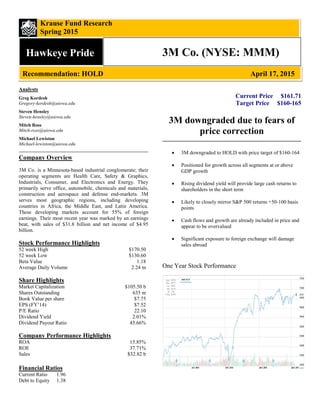
3M Co. (NYSE: MMM)
April 17, 2015
Current Price $161.71
Target Price $160-165
3M downgraded due to fears of
price correction
• 3M downgraded to HOLD with price target of $160-164
• Positioned for growth across all segments at or above
GDP growth
• Rising dividend yield will provide large cash returns to
shareholders in the short term
• Likely to closely mirror S&P 500 returns +50-100 basis
points
• Cash flows and growth are already included in price and
appear to be overvalued
• Significant exposure to foreign exchange will damage
sales abroad
One Year Stock Performance
2. Economic Analysis
Consumer Confidence
Consumer confidence is important for 3M as many of their
products are sold through retail channels; their Consumer
segment serves both office and home markets, while the
Industrial segment sells home appliances, paper and printing
products, and food and beverage products. These two segments
accounted for 14.4% and 34.3% of 2014 sales, respectively. The
higher the Consumer Confidence Index (CCI), the more
consumers should be willing to spend on these products. Based
on historical data from 1995 until now, the change in CCI has
closely resembled the change in the value of the S&P 500 as
well. This graph demonstrates that correlation, indicating that
CCI changes have a significant impact on S&P 500 stock
performance, including 3M.20
21
The most recent CCI report was released on March 31st
; the
results were generally positive, with the Index rebounding from
98.8 in February to 101.3 in March. The responses indicate that
most positivity rests in the job market. 18.4% of consumers
expect their incomes to grow, up from 16.4% in February, and
those expecting a drop in income fell from 10.8% to 9.9%.
However, 25.4% of responses said jobs are “hard to get,” up
from 25.1% previously. An increasing number of consumers
also believe business conditions are “bad,” with the percentage
increasing from 16.7% to 19.4%21
.
Our team believes that these mixed results will continue in the
next 4-6 months, with the CCI ranging from 95-100 on a
monthly basis. We predict soft GDP growth, resulting from low
quarterly inflation indicated by low PPI numbers. This will
cause consumers to see the economic recovery as soft. However,
current trends in wages will continue upwards, and oil prices
will stay stable, saving consumers money on gas. On a long-term
basis of 2-3 years, the CCI will stay stable at first as the
economic recovery strengthens but wage growth slows, and then
will drop to a range of 85-90 as economic conditions normalize.
CCI changes in the short term will cause increased volatility in
3M’s stock price, as mixed consumer sentiment makes
Consumer and parts of Industrial revenues more difficult to
forecast. This makes 3M a less attractive short-term investment.
Producer Price Index
The Producer Price Index, a measure of the price change from
the perspective of the seller, directly affects 3M by changing
their potential for volume and profit margins. If the PPI surges,
companies face either decreases in volume as they are forced to
increase prices, or reduced margins as they maintain price levels.
The most recent PPI report showed only a .2% increase in prices,
which was in line with consensus. Continued low oil prices
have significantly contributed to low inflation, as the year-on-
year change still remains a 4.3% decrease, while PPI excluding
food and energy shows a .9% gain.26
While declining oil prices
have created headwinds for 3M’s competitors due to their
investment in exploration, 3M has been positively affected due
to their low investment in exploration and extraction.
In the short-term, we believe the PPI change will remain low due
to relatively low gas prices, continued consumer uncertainty, and
a propensity to save. We forecast a .5% increase in PPI in six
months due to these factors. However, in 2-3 years, the PPI will
increase more significantly at a 2% clip as oil prices and the
economy recover.
3M will receive tailwinds in the short-term as a result of low
producer prices, particularly in regard to oil. Their low exposure
to oil exploration and extraction has been a boon to earnings
relative to their competitors, and low oil prices have contributed
to falling raw material costs. However, over a 2-3 year period,
their competitors will benefit from an oil recovery, while the
recovery will damage 3M as they pay higher material prices that
are not offset by gains in oil exploration earnings.
Unemployment
The U.S. unemployment rate is a concern for all sectors of the
economy for many reasons that have significant impact on
performance.
A high unemployment rate suggests that many citizens won’t
have the sufficient funds to purchase products made by firms.
This affect trickles down through all sectors of the economy.
Retailer’s sales will decline, and will lack the capital to purchase
more inventory along with the lack of demand from consumers.
This affect transfers to producers of these goods and then
through to the industrial firms that help support the upkeep and
development of the producers of consumer goods. In regards to
3M, a high unemployment rate will result in a lower demand for
the goods that they provide and decrease firm value.
As of March 2015, the unemployment rate came in at 5.5%,
meeting consensus estimates. Overall for 2015, this was
unchanged from the February unemployment rate which was
down from 5.7% in January. 23
As shown in the graph below,
unemployment has been on a relatively stable decline since
2010.
1 | P a g e
3. 22
Because of this trend and the continued improvement in the
economy, we forecast the unemployment rate to take a slight
drop in the next 4-6 months to 5.3%. Moving forward, in the
next 2-3 years we predict the trend to continue and for the
unemployment rate to drop under 5% for the first time since
February 2008 and come in at 4.8%. This trend will show to
have a positive effect on 3M’s performance in the coming years.
Health Care Changes
The recent improvements in the amount of U.S. health care
coverage – mostly due to the Affordable Care Act supports the
notion that demand for health care products will increase sharply
in the near future. With more Americans being covered by health
insurance policies, the amount of patients being able to be cared
for in hospitals has increased as well as the need for more
efficient health care products.
The level of uninsured American’s has been decreasing since the
middle of 2013, and as of third quarter of 2014 is at an all-time
low of 13.1%. This data is shown in the graph below which
tracks the uninsured rate from 2008 to Q2 2014.
9
Moving forward, we project this trend to continue, but stabilize
around 13% over the course of the next two years due to the
combination of the ease of obtaining health care and the
declining unemployment rate projection. As a producer of health
care products, this factor will increase demand and will result in
positive growth for 3M.
Gross Domestic Product
Over the next three to five years, we are expecting the US
economy to regain its strength from the past recession with
growth projected to reach 3% by 2016 and to continue on a
slow growth rate. With no forerunners in the economy
forecasted to have substantial growth that will carry the US
economy forward, we look to international trade and
consumer and government spending as our indicators.
1
When looking at international trade, we are expecting
strong increases in import and exports despite continued
trouble in Europe and the Middle East. With a strong surge
in consumer spending outlook, fueled by anticipated
31
increases in employment gains and an increasing national
minimal wage, we expect imports to respond positively.
While exports will increase in responses to President
Obamas proposed goal of doubling US exports within the
next five years. Government spending is forecasted to
remain subdued in the short term as a result of budget cuts
implemented to pass an increase in the debt ceiling.
Additionally, defense spending is projected to wane.
However, these savings will be offset by a rise in domestic
spending in the later years of the outlook period as greater
tax revenues from a healthier economy allow for heightened
expenditures, particularly on social security and healthcare.
This will be a strong indicator for positive or negative
change for industrials that are dealing in the consumer
products and for companies with expansive dealings with
countries over seas like 3M.
31
Foreign Exchange Market
The foreign exchange market is a critical component to
industrials that own and operate manufacturing operations
multiple countries all over the globe. Slight changes in
foreign currency price ratios can cause major changes in
revenue forecasts and earnings estimates.
2 | P a g e
4. Form a short-term perspective for the EUR/USD we observe a
continuing decreasing trend in the price, falling to lows of 1.02
to even parity in some forecasts for the six to 8 month outlook.
This can be contributed to declining confidence in US Federal
interest rate policy set for September and monetary easing in
effect with Greece still uncertain. The infusion of monetary
funds from the ECB correlate with falling trends and adhere to
our analysis of a short term downtick.34
With seemingly
increasing growth for the US, there are still concerns of unlikely
Federal Reserve policy change and possible new taxes on
corporate funds held overseas, which provoke a negative effect
on the EUR.
With the governmental and economic reform policies that the
Eurozone and especially Greece have enacted and plan to initiate
in the coming future, we believe that we will see stronger growth
than this year’s .08% to the US 2.4%. We can expect with the
ECB bonds program to sustain Greece to an elevated economic
plateau where they can start relieving debt, increasing exports
and invite a slow increase in inflation solidifying Greece
participation in the Euro and well needed correction for Greece’s
economy. That being said, our long term outlook for the
EUR/USD will see strong rebounds to levels of 1.12.
1
Oil Market
The energy market, specifically looking at oil, is a
significant component of the economic outlook for
industrials. This due to the heavy utilization of the
commodity to fuel their manufacturing and production
facilities across the globe.
Looking at our short-term for the oil futures market, we see
prices increasing from their current levels of around
46.00/bbl. to 58.00/bbl. within four to six months. Over the
past months, we have been observing a strengthening
decline in oil prices due to the increasing production and
increasing amount of oil reserves, though, we expect that
trend to change.
We are confident that the oil futures market has bottomed
out and we can expect oil prices to steadily climb. Current
producers of oil have been operating at deficits for months
and they are starting to feel the pressure on their revenues.
Many countries including the United States and the
Eurozone’s breakeven point on oil is around 65.00/bbl.
where as other countries like Russia are even higher at
73.00/bbl.32
37
Looking at our long-term analysis of oil futures, we are
predicting that oil prices rise to 76.00/bbl. over that two to
three year period. As we observe events in the Middle East
subside and new relationships form, we will see
compromises develop in the realm of oil which will lead to
the decrease in the production therefore the supply of oil,
effectively having prices rise to normal levels at perpetuity.1
This will effect industrials when securing future oil
contracts and in their hedging efforts for the long term.
Companies are going to purchase abnormally high amounts
of Oil Futures while prices are low. As we see oil prices rise
in the next five years, they will use those futures to observe
long term constant low oil costs, curbing manufacturing
costs for the long term.
Industry/Competitive Analysis
The Industrials economic sector consists of companies engaged
in providing industrial and commercial supplies and services,
diversified trading, distribution operations and transportation
services.27
According to GICS classifications, 3M belongs to the
Industrial Conglomerates sector. We analyze 3M relative to the
following peers: GE, Honeywell, Danaher, United Technology
Corporation, and Johnson & Johnson. Because the companies in
this space operate in a variety of product markets, we compare
3M’s product performance only to their peers’ competing
product lines. However, we take in to account the full breadth of
competitive advantages each company possesses.
3 | P a g e
5. Industry Trends and Drivers
Global auto sales will drive the industrial sector, specifically in
regard to 3M, Danaher, and Honeywell. As global auto sales
increase, so does the demand for OEM parts and after-market
products and services.7
We believe that auto sales, particularly in
the US, will grow substantially over the next year. Due to
personal income growth, strength in the job market, and low
interest rates, consumers are in a less risky position to make
durable goods purchases.
Although some economic indicators point towards growth, the
housing market continues to be sluggish. The most recent
housing report’s consensus estimate was for 1.04 million new
builds; the actual number was .926 million new builds. This will
adversely impact GE, Honeywell, and 3M, who all operate in the
construction.
Healthcare
From 2015 to 2020, the number of adults aged 65 and older
is anticipated to increase at an annualized rate of 3.2%. As
the baby boomer generation ages, more people will need
medical coverage; the retirement of baby boomers will
particularly increase Medicare expenditure.8
1
The retiring generation transitioning into Medicare and Medicaid
will drive increased utilization of the healthcare industry. The
level of the US population that are not covered by healthcare has
dropped dramatically due to The Affordable Care Act from
17.1% in January of 2014 to 12.90% in Q4 2014. This shift in
the percentage of covered Americans will additionally drive
increased demand and utilization within this industry.
The increasing shift in demand being created by these drivers
will increase the demand for healthcare products produced by
companies within this industry and drive short term revenue
growth. The industry will observe a sharp increase due to the
increased utilization and then have growth stagnate as The
Affordable Care Act becomes fully integrated.
Consumer Staples
The consumer staples segment carries products with a fairly
inelastic demand curve leading to limited volatility from short-
term economic events.4
The growing US economy will drive a
gradual increase in the demand for consumer products however
at a slower rate than other revenue segments. This segment will
provide a stable revenue base for companies participating in this
space, however it will not participate in driving high earnings
growth.
Safety and Graphics
The safety and graphics segment of the industry is focused
around new construction materials and worker safety equipment
in regards to new home starts.4
The end markets for these
products are driven primarily by consumer confidence, personal
income, and new housing starts numbers.
While personal income and consumer confidence outlooks are
becoming more positive, new housing starts have remained
sluggish creating a drag on revenue from this segment for
companies operating in the space. While current levels have
remained low, the forecasted industry growth rate is strong in the
next two years at 11.3% from current averages at 6.3% with new
home starts following the same trend forecasted to grow 17.6%.
With US interest rates remaining at historically low levels,
increasing consumer confidence, and declining unemployment,
the housing industry looks like a strong revenue generator for
companies who compete in this industry.
Electronics & Energy
This revenue segment provides displays and components to
the consumer electronics industry.4 When evaluating the
potential growth for this segment we focus on the changes in
consumer spending. In the recent years, the industry has
been riddled with economic distress due to the 2008
economic crisis though outlook is strong. Consumer
spending is forecasted to grow at a compounded 2.62% for
the long term driving increased consumer electronics sales.
This growth is driven by increased job creation coupled with
stronger economic outlook which will strengthen
consumer’s financial positon allowing for increased luxury
spending. 3M and other industrials in this space will benefit
from single digit growth in the space over the next three to
five years.
4 | P a g e
6. Company Analysis
Porter’s Five Forces
Threat of New Entrants
Due to the large size of the companies in this industry, the
threat of a new company emerging as a dominant force is
unlikely. The largest threat however is the current big names
in this sector expanding their product offerings into
additional revenue segments that will lead to an increased
level of competition between existing companies.
Threat of Substitute Products
Companies in this industry cover wide product offerings
ranging from commodity type items such as post it notes or
safety goggles to specialized items such as medical devices.
The threat of substitution faced by the industry is strongly
weighted to the commodity sides of the revenue segments.
Companies with a strong presence in consumer, safety, or
industrials face the largest risk while those focused more
strongly on healthcare, electronics, and energy are relatively
sheltered from the risk.
Bargaining Power of Customers
Companies in this space tend to sell primarily to
intermediaries rather than direct to client sales. The
bargaining power of the customer is driven primarily by the
brand power, and level of substitution available for a given
product. Companies with stronger brand recognition in a
given product segment face a diminished level of price
bargaining risk than companies with less recognized brand
names. Most pricing in this space is contract based reducing
pricing risk on a yearly level however at contract renewal
times all companies face some level of risk in this area.
Bargaining Power of Suppliers
Companies in this industry focus on specialized products
produced primarily using commodity raw materials. Based
on the nature of the raw materials used in production the
suppliers have limited pricing power because no value
added operations have been performed at their point in the
production process. In segments where more specialized
products are utilized as inputs industry players will face
slightly elevated pricing risk from suppliers however at the
volume they utilize they will continue to benefit from
volume pricing discounts.
Intensity of Competitor Rivalry
Due to the nature of industrial companies, they all have
multiple revenue segments that make up their company as a
whole. As shown in the sector comparison table, the larger
players do not compete in all revenue segments, however
may face more direct competition from smaller more
specialized companies in individual segments. The most
intense competition in this industry will appear where the
larger company’s revenue segments overlap, however
smaller companies operating in specialized markets will
create higher levels of competition in those areas.
3MCompetitive Sectors GE HON DHR UTX JNJ
Industrials x x x x
Health Care x x x
Consumer x
Safety and Graphics x
Electronics and Energy x x
3M 10k, GE 10k, Honeywell 10k, Danaher 10k, United Tech 10k, J&J 10k
Overview
3M is a global diversified technology company that creates value
by making existing processes more convenient, safe, and
efficient. Their products range from office organization solutions
to advanced materials that increase the durability of paint and
adhesives. They add value for investors through innovation,
either creating new patented products that increase the
effectiveness of existing goods, or improving upon current
products. This reliance on innovation requires a large emphasis
on research and development expenses. [3M’s five business
segments bring together common or related 3M technologies,
enhancing the development of innovative products and services
and providing for efficient sharing of business resources].4
Product Lines and Markets
3M organizes their offerings into five product segments:
Industrials, Safety and Graphics, Electronics and Energy, Health
Care, and Consumer.4
3
5 | P a g e
7. Industrials serves automotive OEMs and aftermarket sellers,
construction, electronics, appliances, paper and printing, food
and beverage and packaging.4
To serve these markets, they sell
adhesives, specialty materials and ceramics, and components and
materials for the repair, manufacture, and maintenance of a
variety of vehicles. The Industrial segment is their primary line
of business, providing 34.5% of sales in 2014. Operating margin
in this segment was boosted in 2014 partially by falling raw
material prices.4
Given our 6-month forecast for WTI reaching
$56/bbl., we believe that the operating margin will increase by
1-1.5% in that timeframe. Although, according to our forecasts,
the price will reach $76/bbl. in 2-3 years, 3M’s hedging
activities should stave off the negative effects of rising oil prices,
and the raw material effect will be neutral in that timeframe.
Safety and Graphics creates goods for a wide variety of markets
to increase safety, security, and productivity.4
These goods
include personal protection and traffic safety products;
commercial graphics, architectural surfacing and lighting, and
cleaning and protection products; and roofing products. The
segment’s primary customers are civil markets, commercial
markets, and construction.
The Electronics and Energy segment serves customers to
improve the dependability, cost-effectiveness, and performance
of electronic devices through telecommunication network
development, infrastructure protection, and power generation
and distribution. It also provides display films for LCD
computer monitors, LCD televisions, handheld devices,
notebook PCs, and automotive displays.4
They hold a number of
patents in this sector which boosts their competitive advantage,
although some of these expired in 2013.
Health Care distributes to medical clinics and hospitals,
pharmaceuticals, dental and orthodontic practitioners, health
information systems, and food manufacturing and testing. Their
products include medical and surgical supplies, drug delivery
systems, oral care products, health information systems, and
food safety products. Health Care, although only 17.5% percent
of consolidated sales in 2014, provided 30.9% of operating
income.4
The relatively high segment margin means that further
investment in to health care innovation is key to continued
growth. 3M recently began clinical trials for the patented Hollow
Microstructured Transdermal System, a microneedle that is both
more efficient for drug delivery and less uncomfortable for
patients. The successful market implementation of this
alternative delivery system will be a boon to revenue growth; if
it goes to market in the next two years, we forecast an additional
2-3% increase in healthcare sales from this product as hospitals
and clinics buy the needle.
The Consumer segment serves markets including consumer and
office retail, home improvement, and drug and pharmacy retail.
Most of 3M’s well-known brands are in the Consumer segment,
including Post-It, Scotch tapes, Command home improvement
and office organization goods, Scotchgard, and Thinsulate.`
Brands are a powerful source of value generation as their
familiarity to consumers provides customer lock-in. This
segment also has a strong margin, with 2014 financials showing
the segment as 14.2% of consolidated sales and 22% of
operating income. Due to the presence of their brands, we
believe that this segment will continue to be a source of value
and that the margin will remain in the 21-23% range for the next
3-4 years.
Recent Earnings Analysis
2012 2013 2014 E2015
Q1 $1.59 $1.61 $1.79 $1.94
Q2 $1.66 $1.71 $1.91 $2.10
Q3 $1.65 $1.78 $1.98 $2.18
Q4 $1.41 $1.62 $1.81 $1.97
FY $6.32 $6.72 $7.49 $8.19
This chart highlights the positive trends present in 3M’s
business, paying particular attention to 2013-2014 results. Their
$31.8 billion in sales is a company record, and their EPS
increased by a healthy 11.45%. Several other metrics are
promising, such as their increase in operating income, margin,
and cash flow, metrics which are harder to use accounting
techniques to alter upwards.
3M acquired the remaining 25% of their subsidiary company
Sumitomo 3M for $865 million, the plan for which was
announced during the second quarter earnings call. Similar
percentage growth in sales and EPS were present in the second
and first quarter earnings calls as well. In 2014, the only
business segment to report a negative year over year change in
sales was consumer products in the first quarter of -0.2%. In
regards to changes in operating income decreases were only
found three times: -2.9% in Q4 for the industrials segment, -
4.2% in Q1 for the safety & graphics segment, and -3.5% in Q1
for the consumer segment as well. This positive trend was also
present in the 2013 fourth quarter earnings call, showing a yearly
increase in sales of 2.4% and an increase in earnings per share of
14.9% - both records at the time for the company.
Management for 3M projects 2015 to trend in the same
direction. For 2015, management believes annual EPS to be
between $8.00 and $8.30 and organic sales growth to finish
between three and six percent. They also discount the effect that
the strengthening U.S. dollar will have on total earnings as they
believe they proved last year that they understand how to
perform well in these conditions. The only change from previous
estimates was an increase in the headwind on total sales from
currency conversion, from 2-3% to 4-5%. Overall, management
foresees 2015 to continue the positive trend shown in the past
two years for 3M. 4
An important point to consider is who management is speaking
to in these earnings calls. Management is expected to provide a
6 | P a g e
8. Investment SWOT Analysis
positive outlook otherwise people would not believe in 3M as a
potential investment opportunity or a reliable business partner.
As we analyzed the recent trends, we believe management’s
outlook to be overly optimistic. The statement made that “they
proved last year that they can handle these conditions” only
takes into consideration the second half of the year when the
U.S. Dollar began it’s strengthening trend. While third and
fourth quarter 2014 were still strong for 3M, the negative impact
that currency translation had on sales were 1.2% (Q3) and 4.4%
(Q4). As the U.S. Dollar continues to strengthen with the
uncertainty in the Eurozone, the negative impact on sales in the
short term we believe will continue to become an issue for 3M.
We project that for 2015, EPS and organic sales growth will be
towards the bottom of the range presented by management,
hovering around $7.85-$8.15 EPS, and organic sales growth
between two and four percent.
Competitive Environment
2
3M differentiates itself from its peers through expenditures on
long-term growth including capital expenditures and R&D, as
shown in the graphs above. R&D spending will allow 3M to
continue to create new patented products and improve current
offerings, management forecasts R&D/sales of 6% by 2017.4
Capital expenditures, where MMM is a strong industry leader,
will improve manufacturing capacity, efficiency, IT systems,
and infrastructure, all of which cut long-term costs or improve
long-term ROIC, both drivers of value.
Company Market Cap 2014 EPS 2015E EPS
14-15 Est
Rev Growth
5 yr EPS
CAGR
3M* 102.64B $7.49 $8.45 3.0% 6.39%
General Electric 276.76B $1.50 $1.62 1.4% 9.1%
Honeywell 81.77B $5.33 $6.09 0.6% 9.8%
Danaher 59.55B $3.63 $3.85 3.8% 11.0%
United Tech 104.87B $6.82 $6.98 0.5% 5.2%
Johnson&Johnson 276.46B $5.70 $5.71 -4.9% 9.1%
FactSet Data, Yahoo! Finance Data
*All forward-looking 3M data is from our valuation model.
The table above compares 3M and their closest competitors
across a number of growth and scale metrics. Of the
companies above, 3M and Honeywell lead expected EPS
growth YoY for 2015. However, 3M lags by the 5-year
CAGR in EPS growth. This lower long term growth rate
will have a negative impact on the long term valuation of
3M. Despite lower five year growth rates, 3M maintains a
leading position in YoY revenue growth estimates, second
to Danaher, and exceeding Honeywell by 240 basis points. 2
Strengths
Relative Security with Similar Returns
3M is a global industrial company that manufactures for a wide
variety of industries including healthcare, technologies, and
industrials. On account of the global presence as well as broad
product platforms, 3M is a relatively safe investment by
comparison to other companies with exposure to fewer
industries and more vulnerable to negative industry moves.
With footholds in the Americas, Europe, and Asia across
numerous industries it is unlikely that a single event in any of
these areas alone could cause catastrophic damage. Using data
collected from yahoo finance our regression model showed that
the S&P 500 and 3M are .96 correlated over a 5 year span from
January of 2010 to February of 2015. These data show that 3M
is likely going to closely mirror S&P 500 returns. As a percent
of February 13 adjusted close the 5 year standard deviation for
the S&P 500 and 3M are 14.4% and 16.4% respectively. This
shows that through times of rapid expansion and relative market
stability that 3M has maintained similar volatility by comparison
to the market. During this same time period 3M has produced a
128% return while the S&P yielded 85%. Using these data it is
clear that 3M can yield superior returns to the S&P while
offering similar levels of price volatility. In a growing economy
this places 3M in a strong long term growth position in the
market.
Patents and Size
According to 3M’s 10-K, 3M possesses over 671 domestic and
3,330 patents worldwide. This represents a large ownership of
intellectual property that serves as a shield between 3M and their
competitors in their core markets both global and domestic.
These patents have been the direct result of strong R&D growth
over their life and have allowed 3M to stay ahead of their key
competitors in the markets in which they compete.
Intellectual property protects 3M from current competitors
infringing on their markets however scale precludes new
entrants from posing future threats. As a globally competitive
supplier to a variety of sectors it is very challenging for new
entrants to achieve a scale that poses a realistic threat.
ERP Implementation
The implementation of Enterprise Research Planning business
management software in the past year created a .2% drag on all
business segments. Once the ERP implementation is complete,
the decrease in sales will disappear, and the complete and
7 | P a g e
9. Valuation Analysis
unified system will presumably increase organizational
efficiency across all sectors.
Weaknesses:
Wide Exposure to Macro Headwinds
The breadth of product offerings from 3M across a variety of
sectors leaves them exposed to a higher level of macro-economic
factors than its competitors in individual industries. Although
this may appear to be a strength, macro factors that affect
multiple industries could create issues in all sectors
simultaneously. In particular the industrials product lines make
up approximately one third of 3M revenues. The large exposure
to industrials creates a vulnerable point if the sector were to
struggle Q/Q or Y/Y significantly reducing earnings power over
the same time period.
Input Cost Variability
An inherent weakness for 3M is based on ability to manage input
costs to protect margins. A major input cost with wide
variability is the cost of oil, not only as an input to many
products but additionally as a power supply. Looking forward
we believe oil prices are likely to rebuild toward $76/barrel in
18-24 months which despite derivative hedging will create a
margin weakness. Due to a larger reliance on oil than other
sectors that do not utilize it as a raw material as well as energy
3M’s business model is by design more susceptible to
fluctuations in the cost of oil. Currently 3M is benefitting from a
lower input cost however higher costs would degrade margins.
Opportunities:
Interest Rates and Capital Restructuring
Consistently low interest rates have allowed 3M to borrow at
low debt cost; they increased their long-term debt by roughly
$2.4 billion in the past year. While higher leverage can appear
detrimental to company performance, we believe 3M’s corporate
strategy will lead them to use the additional capital to fund long-
term projects and R&D. These two facets of their business create
long-term value and make 3M a more attractive investment. In
addition, because 3M has changed leveraged their capital
structure, thereby including more low-cost capital, their WACC
has fallen. Using 2013 data, we calculated that a $2 billion
increase in long-term debt, at current interest rates, would
decrease WACC by roughly 2%.
Threats:
Foreign Exchange
As a global company 3M has significant exposure to a
strengthening U.S. dollar against foreign currencies, with 63.9%
of their sales coming from outside the U.S. We predict that as
quantitative easing continues in the Eurozone that the Euro will
approach parity with the dollar in the next 12-18 months creating
a significant drag on sales in that geography. Weakening
currencies in other areas where 3M has a significant footprint
will create or worsen sales reductions in those areas as well. 3M
predicts weakening currencies to create a 4.4% drag on their
revenues in the coming year; we agree with their analysis,
although given the uncertainty with Greece’s bailout package,
increased instability could create a headwind as strong as 5-6%
in 2015.
Inflated Valuation
3M is currently trading at a 22.15 multiple of next year’s
forecasted earnings. This valuation is at the top of its peer
group. The nearest competitor by that metric is Danaher
Corporation valued at 19X ‘15 earnings while General Electric
and Honeywell trade at 14x and 16x ‘15 earnings respectively.
The inflated valuation poses the threat of a possible downward
market correction which would bring 3M valuation in line with
their peer group. EV/Sales valuation follows a similar pattern
with 3M boasting an inflated 3.4x ratio, Danaher following
behind at 3x, while UTX and GE build up the bottom of the
valuations with 1.8x and 1.9x, respectively.
Revenue Outlook
Industrials
The industrials segment for 3M generated 34.5% of their total
sales for 2014. The segment also accounted for a 21.7%
operating margin. We forecast a 3.49%, 4.35%, and 4.85%
growth rate in 2015, 2016, and 2017 respectively. This
accelerating growth rate will result from a strong automotive
market in the US, increased construction due to the economic
recovery, and recovery in the EU during 2017.
Safety and Graphics
The safety and graphics segment for 3M generated 18% of their
total sales for 2014. The segment also accounted for a 22.6%
operating margin. We expect this segment to grow at 1.21%,
1.99%, and 2.45% in 2015, 2016, and 2017 respectively. These
rates will track economic recovery, but since safety equipment is
a reactionary product segment, it will lag slightly behind
economic growth rates.
Electronics and Energy
The electronics and energy segment for 3M generated 17.6% of
their total sales for 2014. The segment also accounted for a
19.9% operating margin. We forecast 4.11%, 4.92%, and 4.83%
growth rates in 2015, 2016, and 2017 respectively. As the
domestic economy continues to strengthen, telecommunications
companies will expand and renovate existing infrastructure. As
consumer incomes continue to rise, consumers will spend more
on the luxury screens that 3M produces in this segment.
Health Care
The health care segment for 3M generated 17.5% of their total
sales for 2014.The segment also accounted for a 30.9%
operating margin. Our team sees this segment growing at 4.11%,
8 | P a g e
10. 4.92%, and 5.41% rates in 2015, 2016, and 2017 respectively.
We expect this segment to grow the most due to an increasing
number of retirees from the baby boomer generation, and more
individuals with insurance under the Affordable Care Act.
Finally, we expect 3M’s management to make concerted efforts
to grow this segment because it has the highest margin of any
segment.
Consumer
The consumer segment for 3M generated 14.2% of their total
sales for 2014.The segment also accounted for a 22% operating
margin. We forecast .73%, 1.51%, and 2.72% growth in this
segment over the next three years. Although consumer incomes
are expected to grow, the kinds of products sold by this segment
are low-margin and have an inelastic demand. Therefore, growth
in the economy will not drive this segment as strongly as in
others.
Critical Assumptions
WACC
We calculated 3M’s WACC at 9.36%. Their cost of equity is
9.96% according to the CAPM, and their after-tax cost of debt is
2.41%. 3M’s cost of equity is consistent with their annual
returns slightly outpacing the average S&P 500 return. Their
relatively low cost of debt is a result of their AA- debt rating by
Morningstar. We forecast 3M’s WACC to remain constant given
that they recently added considerable debt to their balance sheet,
and we do not expect them to change their capital structure
further in the near future.
CV Growth
We forecast a terminal growth rate of 3.5% in 2021. This does
not differ significantly from their average growth rate over the
next seven years, as we believe they have reached maturity.
They will generate returns at a slight premium to the S&P
moving forward. We believe they will continue to make strategic
acquisitions, however these actions are not an integral part of our
model.
DCF/EP Valuation
Our DCF and EP valuation returned a stock price of $127.87.
While this valuation method focuses on cash flows, we believe
that the market values 3M as an annuity based on their ability to
return cash directly to shareholders rather than capital gains
expectations. 3M has paid dividends every quarter since 2004
and recently raised their payout ratio from 37.8% to 45.66%2
. In
addition, they have consistently repurchased stock and we
forecast that they will continue to do so based on their cash
position. These facts lead us to believe that this model is not a
relevant valuation technique for 3M.
Dividend Discount Model
The DDM valuation generated a stock price of $166.49. This
valuation model works because we believe that they should be
valued based on their ability to return cash to shareholders. In
addition their revenue and cash flow to the firm cannot
realistically grow at a high enough rate that would warrant their
current share price.
Relative P/E Model
The relative P/E valuation generated a stock price of $146.55.
This indicates that 3M trades at a premium to their industry
average P/E, and we believe that to be accurate given their high
level of dividends and share repurchases. However, we expect
their P/E to fall closer to industry average as their stock price
stagnates and earnings increase.
Sensitivity Analysis
WACC vs. CV Growth
Although our group does not use the DCF for our target price,
we believe the sensitivity analysis may be telling of how the
market is valuing 3M. If analysts and marginal investors believe
3M’s terminal growth will be somewhere between 5% and 6%,
then current market prices accurately reflect that. However, our
team does not believe this kind of growth to be sustainable, and
therefore a slightly lower price, based on DCF valuation, is
reasonable.
Cost of Equity vs. Cost of Debt
This sensitivity table shows that 3M’s stock price may not be
sensitive to future changes in cost of debt, which we forecast to
occur due to the Fed hiking interest rates. However, their price is
incredibly sensitive to changes in their cost of equity. If for some
reason investors value their stock as riskier, their stock price
could take a significant hit in the future.
9 | P a g e
11. Cost of Equity vs. Retention Ratio
This table tests the sensitivity of our DDM price. 3M could
potentially boost their stock price by increasing dividend
payouts; however, this may not be wise as it would limit the
amount of capital they have available for large expenditures and
long-term growth. In contrast with the DCF model, the DDM
price is far less sensitive to changes in 3M’s cost of equity. If
this model is a more accurate representation of how the market
values 3M, then their stock’s volatility increasing may not
cause as large a fluctuation in price.
10 | P a g e
12. Important Disclaimer
This report was created by students enrolled in the Security
Analysis (6F:112) class at the University of Iowa. The report
was originally created to offer an internal investment
recommendation for the University of Iowa Krause Fund and
its advisory board. The report also provides potential
employers and other interested parties an example of the
students’ skills, knowledge and abilities. Members of the
Krause Fund are not registered investment advisors, brokers
or officially licensed financial professionals. The investment
advice contained in this report does not represent an offer or
solicitation to buy or sell any of the securities mentioned.
Unless otherwise noted, facts and figures included in this
report are from publicly available sources. This report is not
a complete compilation of data, and its accuracy is not
guaranteed. From time to time, the University of Iowa, its
faculty, staff, students, or the Krause Fund may hold a
financial interest in the companies mentioned in this report.
11 | P a g e
13. References
1
"Industry Reports." Market Research Reports.
IBISworld, n.d. Web. 21 Apr. 2015.
2
Factset.com
3
"Thomson One." Thomson One. N.p., n.d. Web. 21
Apr. 2015.
4
3M 2014 10K, 3M.com
5
"3M Worldwide - Investor Relations - Investor
Relations." 3M Worldwide - Investor Relations -
Investor Relations. 3m.com, n.d. Web. 21 Apr. 2015.
6
http://quotes.morningstar.com/chart/stock/chart.action?t
=GE®ion=usa&culture=en-US
7
Industrials Sector Snapshot - NYTimes.com."
Industrials Sector Snapshot - NYTimes.com. New York
Times, n.d. Web. 10 Feb. 2015.
8
IBISWorld Business Environment Profiles. "Number of
Adults Aged 65 and Older." Industry, Company and
Business Research Reports and Information. IBISWorld
US, May 2014. Web. 10 Feb. 2015.
9
Levy, J. (2014, September 30). In U.S., Uninsured Rate
Holds at 13.4%. Retrieved from Gallop:
http://www.gallup.com/poll/178100/uninsured-rate-
holds.aspx
10
http://www.census.gov/construction/nrs/pdf/newressal
es.pdf
11
“3M Co Industry Peers." MMM: Top Competitors and
Peers. Morningstar, 10 Feb. 2015. Web. 10 Feb. 2015.
12
“3M Company." Company Profile. ZoomInfo, n.d.
Web. 5 Feb. 2015.
13
"GICS Structure." GICS. MSCI, 28 Feb. 2014. Web. 7
Feb. 2015.
14
"Gross Domestic Product." FRED. Federal Reserve
Bank of St. Louis, 30 Jan. 2015. Web. 10 Feb. 2015.
15
Hagerty, James R. "3M Profit Rises Despite Economic
Turbulence." WSJ. Wall Street Journal, 27 Jan. 2015.
Web. 10 Feb. 2015.
16
"Industrial Production: Manufacturing (NAICS)."
FRED. Federal Reserve Bank of St. Louis, 30 Jan. 2015.
Web. 10 Feb. 2015.
17
Wei, Lingling. "China Cuts Reserve Requirement
Ratio." WSJ. Wall Street Journal, 4 Feb. 2015. Web.15
18
"Real Trade Weighted U.S. Dollar Index: Major
Currencies." FRED. Federal Reserve Bank of St. Louis,
2 Feb. 2015. Web. 10 Feb. 2015.
19
“Factset Estimates, www.factset.com”
20
The Conference Board. "Consumer Confidence
Survey." Consumer Confidence Index®. The
Conference Board, 27 Jan. 2015. Web. 02 Feb. 2015.
21
Short, Doug. "Consumer Confidence: What Does It
Say About the Economy?" Consumer Confidence: What
Does It Say About the Economy? Advisor Perspectives,
30 July 2013. Web. 02 Feb. 2015.
22
U.S. Bureau of Labor Statistics. "Employment
Situation Summary." U.S. Bureau of Labor Statistics.
U.S. Bureau of Labor Statistics, 9 Jan. 2015. Web. 01
Feb. 2015.
23
U.S. Bureau of Labor Statistics. "Labor Force
Statistics." Bureau of Labor Statistics Data. U.S. Bureau
of Labor Statistics, 2 Feb. 2015. Web. 2 Feb. 2015.
24
Hagerty, James R. "3M Profit Rises Despite Economic
Turbulence." WSJ. Wall Street Journal, 27 Jan. 2015.
Web. 29 Jan. 2015.
25
Hagerty, James R. "3M Earnings: What to Watch."
WSJ. Wall Street Journal, 26 Jan. 2015. Web. 27 Jan.
2015.
26
Bloomberg L.P. “Commodities PPI Data for US 2009-
2014.” (2014) Bloomberg database. University of Iowa
Pomerantz Library Services, Iowa City, IA. 2 February,
2015.
27
Bloomberg L.P. “PPI Graph - Industrial Commodities
for US 2009-2015.” (2015) Bloomberg database.
University of Iowa Pomerantz Library Services, Iowa
City, IA. 3 February, 2015.
28
Patton, Mike. "Strong Dollar and Weak Global
Economy Could Cause U.S. Recession." Forbes. Forbes
Magazine, 27 Jan. 2015. Web. 03 Feb. 2015.
29
Ziobro, Paul, Josh Mitchell, and Theo Francis. "Strong
Dollar Squeezes U.S. Firms." WSJ. Wall Street Journal,
27 Jan. 2015. Web. 03 Feb. 2015.
30
Zumbrun, Josh, and Brian Baskin. "Oil Price Q&A:
What the Plunge Means for Gas Prices, the Economy
and Markets." Real Time Economics RSS. Wall Street
Journal, 6 Jan. 2015. Web. 03 Feb. 2015.
12 | P a g e
14. 31
Factset. “GDP Graph for 2009-2014.” (2014) Factset
database, Iowa City, IA. 3 February, 2015.
32
Hayes, Adam. "Saudi Arabia: King Abdullah's Death
and Oil's Fall." Investopedia. N.p., 31 Jan. 2015. Web.
04 Feb. 2015.
33
Rubin, Richard. "Barclays Sees Euro Sliding to $1 by
Year-End as Policies Diverge." Bloomberg.com.
Bloomberg, n.d. Web. 04 Feb. 2015.
34
ECB to Pump Money into Economy." - Castanet.net.
The Canadian Press, n.d. Web. 04 Feb. 2015.
35
Rubin, Richard. "Obama Wants a New Tax on U.S.
Companies' Overseas Profits." Bloomberg.com.
Bloomberg, n.d. Web. 03 Feb. 2015.
36
"Danske Bank Cuts Its 6 and 12 Month EUR/USD
Estimates." - Real-time Analysis & News Ltd.
Ransquak, 19 Jan. 2015. Web. 04 Feb. 2015.
37
Daily Commodity Futures Price Chart: March 2015."
Light Crude Oil (Pit) : NYMEX. Bollinger Bands, 3
Feb. 2015. Web. 04 Feb. 2015.
38
FOREX-Dollar Slips vs Euro on Short-covering
Bounce, Greek Relief." Yahoo Finance. Yahoo Finance,
3 Feb. 2015. Web. 04 Feb. 2015.
13 | P a g e
21. 3M Company
Value Driver Estimation
Fiscal Years Ending Dec. 31 2012 2013 2014 2015E 2016E 2017E 2018E 2019E 2020E 2021E
Assumptions
WACC 9.36%
Cost of Debt 3.45%
NOPLAT
Revenue 29,904 30,871 31,821 32,855 34,169 35,707 37,135 38,565 40,050 41,552
COGS 14,404 14,741 15,053 15,674 16,301 17,034 17,716 18,398 19,106 19,822
SG&A 6,102 6,384 6,468 6,571 6,834 7,141 7,427 7,713 8,010 8,310
Depreciation 1,055 1,135 1,180 1,222 1,302 1,382 1,462 1,542 1,622 1,702
Research and Development 1,634 1,715 1,770 1,807 1,879 1,964 2,042 2,121 2,203 2,285
Operating Leases 16 23 26 26 27 28 28 29 29 29
EBITA 6,725 6,919 7,376 7,607 7,880 8,213 8,516 8,820 9,138 9,460
Adjusted Taxes
Provision for Income Taxes 1,840 1,841 2,028 2,030 2,125 2,209 2,297 2,384 2,473 2,564
Plus Tax Shield on Op Lease Interest 5 7 8 8 8 8 9 9 9 9
Plus Tax Shield on Interest Expense 70 - 30 32 21 28 27 25 27 26
Plus Tax Shield on Amortization 70 69 69 70 71 71 72 73 74
Plus Tax Shield on Unusual Expenses (18) 39 10 25 17 21 19 20 20 20
Less Tax on Non Op Income 12 10 11 11 11 11 11 11 11 11
Total Adjusted Taxes 1,885 1,947 2,133 2,153 2,231 2,326 2,412 2,499 2,590 2,682
Change in Deferred Taxes 356 589 (926) 215 (21) (25) (23) (23) (24) (24)
NOPLAT 5,196 5,561 4,317 5,668 5,628 5,862 6,081 6,298 6,524 6,754
Invested Capital
Normal Cash 1,514 617 636 657 683 714 743 771 801 831
Plus A/R 4,061 4,253 4,238 4,412 4,588 4,795 4,986 5,178 5,378 5,579
Plus Inventories 3,837 3,864 3,706 3,929 4,086 4,270 4,440 4,611 4,789 4,968
Plus Other Current Assets 1,027 1,104 1,039 1,151 1,191 1,240 1,301 1,351 1,403 1,456
Less A/P 1,762 1,799 1,807 1,840 1,903 1,978 2,046 2,113 2,183 2,252
Less Income Taxes Payable 416 454 469 467 489 508 528 548 569 590
Less Other Current Liabilities 2,937 3,562 3,616 3,286 3,417 3,571 3,714 3,857 4,005 4,155
Add Net PP&E 8,378 8,652 8,489 8,867 9,165 9,383 9,521 9,579 9,557 9,455
Add PV of Operating Leases 663 757 742 775 801 820 832 837 835 826
Add Other Intangibles 1,925 1,688 1,435 1,310 1,182 1,052 920 785 648 509
Add Other Assets 655 1,197 622 781 812 848 882 916 952 987
Less Other Liabilities 942 1,388 1,355 1,287 1,338 1,398 1,454 1,510 1,568 1,627
Total Invested Capital 16,004 14,930 13,660 15,002 15,361 15,667 15,883 16,001 16,038 15,988
NOPLAT 5,196 5,561 4,317 5,668 5,628 5,862 6,081 6,298 6,524 6,754
IC 16,004 14,930 13,660 15,002 15,361 15,667 15,883 16,001 16,038 15,988
ROIC 35% 35% 29% 41% 38% 38% 39% 40% 41% 42%
FCF 3,894 6,635 5,586 4,327 5,269 5,556 5,864 6,180 6,488 6,805
EP 3,819 4,063 2,919 4,389 4,223 4,424 4,614 4,810 5,026 5,253
22. 3M Company
Weighted Average Cost of Capital (WACC) Estimation
Cost of Equity
Risk Free Rate 2.51%
Risk Premium 4.26%
Beta 1.1
Cost of Equity 9.96%
Cost of Debt
29-yr Bond Yield 3.45%
Tax Rate 30.10%
After tax Cost 2.41%
Weights
Total Equity 102,645,422,500.00
# shares 634,750,000.00
$/share 161.71
Total Debt 7,750,498,122.78
Value of Leases 742,012,981.06
Total Value 111,137,933,603.84
Weight of Equity 92.36%
Weight of Debt 6.97%
WACC
9.36%
23. 3M Company
Discounted Cash Flow (DCF) and Economic Profit (EP) Valuation Models
Key Inputs:
CV Growth 3.75%
CV ROIC 42.12%
WACC 9.36%
Cost of Equity 9.96%
Cost of Debt 2.41%
Weight of Debt 6.97%
Weight of Equity 92.36%
Operating cash % sales 2.00%
Annual Dividend Yield 2.08%
Fiscal Years Ending Dec. 31 2015E 2016E 2017E 2018E 2019E 2020E 2021E
DCF Model
FCF 4327 5269 5556 5864 6180 6488 6805
CV 109595
Periods to discount 1.00 2.00 3.00 4.00 5.00 6.00 6.00
WACC 9.36% 9.36% 9.36% 9.36% 9.36% 9.36% 9.36%
1.09 1.20 1.31 1.43 1.56 1.71 1.71
PV of CF 3957 4405 4248 4099 3950 3792 64053
Sum of PV 88504
non-operating Assets
Excess Cash 1220
Short term investments 849
Long term investments 930
ESOP (2899)
Investment in Affiliate 99
Less PV of Op Leases (742)
Less Short term debt (106)
Long Term Debt (6790)
Underfunded Pension Plan (1809)
Note Receivable 89
Minority Interest 33
non-operating Assets (9126)
DCF 79377
Shares Outstanding 635
Intrinsic Value per Share 124.98
With Partial Year Adjustment 127.89
EP Model 2015 2016 2017 2018 2019 2020 2021
EP 4389 4223 4424 4614 4810 5026 5253
Periods to Discount 1.00 2.00 3.00 4.00 5.00 6.00 6.00
continuing Value 93557
PV of EP 4013 3531 3382 3225 3075 2937 54679
Sum of PV 74843
+Beg. IC 13660
Value of Operating Assets 88504
non-operating Assets
Excess Cash 1220
Short term investments 849
Long term investments 930
ESOP (2899)
Investment in Affiliate 99
Less PV of Op Leases (742)
Less Short term debt (106)
Long Term Debt (6790)
Underfunded Pension Plan (1809)
Note Receivable 89
Minority Interest 33
non-operating Assets (9126)
DCF 79377
Shares Outstanding 635
Intrinsic Value per Share 124.98
With Partial Year Adjustment 127.89
For Discounting:
Number of Periods 1.000 2.000 3.000 4.000 5.000 6.000 6.000
Today 4/21/2015
Next FYE 12/31/2015
Last FYE 12/31/2014
Days in FY 365
Days to FYE 254
Elapsed Fraction 0.696
% of year elapsed 0.304
24. 3M Company
Dividend Discount Model (DDM) or Fundamental P/E Valuation Model
Fiscal Years Ending Dec. 31 2015E 2016E 2017E 2018E 2019E 2020E 2021E
EPS 8.15 8.75 9.23 9.72 10.20 10.76 11.38
Key Assumptions
Retention Ratio 54.34%
CV EPS growth 5.80%
CV ROE 41.43%
Cost of Equity 9.96%
Future Cash Flows
P/E Multiple (CV Year) 26
EPS (CV Year) 11.38
Future Stock Price 166 183 201 221 243 267 294
Dividends Per Share 3.72 4.00 4.21 4.44 4.66 4.91 5.20
Future Cash Flows
Discount Period 1 2 3 4 5 6 6
Discounted Cash Flows 3.38 3.31 3.17 3.04 2.90 2.78 151
Intrinsic Value 166.49
25. 3M Company
Relative Valuation Models
EPS EPS Est. 5yr
Ticker Company Price 2015E 2016E P/E 15 P/E 16 EPS gr. PEG 15 PEG 16
GE General Electric 28.51 1.60 1.70 17.82 16.77 9.10 1.60 1.50
HON Honeywell 103.24 6.10 6.70 16.92 15.41 9.80 1.73 1.57
DHR Danaher Corp 83.90 3.90 4.30 21.51 19.51 11.00 1.96 1.77
JNJ Johnson & Johnson 99.15 5.80 6.10 17.09 16.25 5.20 3.29 3.13
UTX United Technology Corp 115.92 7.00 7.70 16.56 15.05 9.10 1.82 1.65
Average 17.98 16.60 2.08 1.93
MMM 3M Company 161.71 8.15 8.75 19.84 18.48 4.59 4.32 4.02
Implied Value:
Relative P/E (EPS15) 146.55
Relative P/E (EPS16) 145.27
PEG Ratio (EPS15) 77.79
PEG Ratio (EPS16) 77.40
27. Present Value of Operating Lease Obligations (2014) Present Value of Operating Lease Obligations (2013) Present Value of Operating Lease Obligations (2012) Present Value of Operating Lease Obligations (2011) Present Value of Operating Lease Obligations (2010) Present Value of Operating Lease Obligations (2009) Present Value of Operating Lease Obligations (2008) Present Value of Operating Lease Obligations (2007) Present Value of Operating Lease Obligations (2006) Present Value of Operating Lease Obligations (2005) Present Value of Operating Lease Obligations (2005)
Operating Operating Operating Operating Operating Operating Operating Operating Operating Operating Operating
Fiscal Years Ending Dec. 31 Leases Fiscal Years Ending Leases Fiscal Years Ending Leases Fiscal Years Ending Leases Fiscal Years Ending Leases Fiscal Years Ending Leases Fiscal Years Ending Leases Fiscal Years Ending Leases Fiscal Years Ending Leases Fiscal Years Ending Leases Fiscal Years Ending Leases
2015 225 2014 216 2013 194 2012 155 2011 139 2010 125 2009 111 2008 98 2007 85 2006 79 2005 93
2016 164 2015 170 2014 158 2013 113 2012 104 2011 95 2010 73 2009 79 2008 65 2007 61 2006 56
2017 126 2016 128 2015 119 2014 87 2013 69 2012 76 2011 57 2010 58 2009 50 2008 46 2007 19
2018 75 2017 98 2016 77 2015 55 2014 41 2013 38 2012 32 2011 35 2010 26 2009 27 2008 19
2019 54 2018 54 2017 68 2016 40 2015 25 2014 23 2013 22 2012 30 2011 19 2010 21 2009 15
Thereafter 187 Thereafter 182 Thereafter 119 Thereafter 52 Thereafter 64 Thereafter 91 Thereafter 100 Thereafter 141 Thereafter 114 Thereafter 128 Thereafter 118
Total Minimum Payments 831 Total Minimum Payments 848 Total Minimum Payments 735 Total Minimum Payments 502 Total Minimum Payments 442 Total Minimum Payments 448 Total Minimum Payments 395 Total Minimum Payments 441 Total Minimum Payments 359 Total Minimum Payments 362 Total Minimum Payments 320
Less: Interest 89 Less: Interest 91 Less: Interest 72 Less: Interest 44 Less: Interest 40 Less: Interest 46 Less: Interest 45 Less: Interest 56 Less: Interest 47 Less: Interest 50 Less: Interest 45
PV of Minimum Payments 742 PV of Minimum Payments 757 PV of Minimum Payments 663 PV of Minimum Payments 458 PV of Minimum Payments 402 PV of Minimum Payments 402 PV of Minimum Payments 350 PV of Minimum Payments 385 PV of Minimum Payments 312 PV of Minimum Payments 312 PV of Minimum Payments 275
Capitalization of Operating Leases Capitalization of Operating Leases Capitalization of Operating Leases Capitalization of Operating Leases Capitalization of Operating Leases Capitalization of Operating Leases Capitalization of Operating Leases Capitalization of Operating Leases Capitalization of Operating Leases Capitalization of Operating Leases Capitalization of Operating Leases
Pre-Tax Cost of Debt 3.45% Pre-Tax Cost of Debt 3.45% Pre-Tax Cost of Debt 3.45% Pre-Tax Cost of Debt 3.45% Pre-Tax Cost of Debt 3.45% Pre-Tax Cost of Debt 3.45% Pre-Tax Cost of Debt 3.45% Pre-Tax Cost of Debt 3.45% Pre-Tax Cost of Debt 3.45% Pre-Tax Cost of Debt 3.45% Pre-Tax Cost of Debt 3.45%
Number Years Implied by Year 6 Payment 3.5 Number Years Implied by Year 6 Payment 3.4 Number Years Implied by Year 6 Payment 1.8 Number Years Implied by Year 6 Payment 1.3 Number Years Implied by Year 6 Payment 2.6 Number Years Implied by Year 6 Payment 4.0 Number Years Implied by Year 6 Payment 4.5 Number Years Implied by Year 6 Payment 4.7 Number Years Implied by Year 6 Payment 6.0 Number Years Implied by Year 6 Payment 6.1 Number Years Implied by Year 6 Payment7.9
Lease PV Lease Lease PV Lease Lease PV Lease Lease PV Lease Lease PV Lease Lease PV Lease Lease PV Lease Lease PV Lease Lease PV Lease Lease PV Lease Lease PV Lease
Year Commitment Payment Year Commitment Payment Year Commitment Payment Year Commitment Payment Year Commitment Payment Year Commitment Payment Year Commitment Payment Year Commitment Payment Year Commitment Payment Year Commitment Payment Year Commitment Payment
1 225 217.5 1 216 208.8 1 194 187.5 1 155 149.8 1 139 134.4 1 125 120.8 1 111 107.3 1 98 94.7 1 85 82.2 1 79 76.4 1 93 89.9
2 164 153.2 2 170 158.9 2 158 147.6 2 113 105.6 2 104 97.2 2 95 88.8 2 73 68.2 2 79 73.8 2 65 60.7 2 61 57.0 2 56 52.3
3 126 113.8 3 128 115.6 3 119 107.5 3 87 78.6 3 69 62.3 3 76 68.6 3 57 51.5 3 58 52.4 3 50 45.2 3 46 41.5 3 19 17.2
4 75 65.5 4 98 85.6 4 77 67.2 4 55 48.0 4 41 35.8 4 38 33.2 4 32 27.9 4 35 30.6 4 26 22.7 4 27 23.6 4 19 16.6
5 54 45.6 5 54 45.6 5 68 57.4 5 40 33.8 5 25 21.1 5 23 19.4 5 22 18.6 5 30 25.3 5 19 16.0 5 21 17.7 5 15 12.7
6 & beyond 54 146.4 6 & beyond 54 142.7 6 & beyond 68 95.9 6 & beyond 40 42.2 6 & beyond 25 50.9 6 & beyond 23 70.7 6 & beyond 22 76.9 6 & beyond 30 108.1 6 & beyond 19 85.6 6 & beyond 21 96.0 6 & beyond 15 85.9
PV of Minimum Payments 742.0 PV of Minimum Payments 757.1 PV of Minimum Payments 663.1 PV of Minimum Payments 458.0 PV of Minimum Payments 401.6 PV of Minimum Payments 401.5 PV of Minimum Payments 350.4 PV of Minimum Payments 385.0 PV of Minimum Payments 312.4 PV of Minimum Payments 312.2 PV of Minimum Payments 274.6
Present Value of Operating Lease Obligations
2004 2005 2006 2007 2008 2009 2010 2011 2012 2013 2014 2015 2016 2017 2018 2019 2020 2021
275 312 312 385 350 402 402 458 663 757 742 775 801 820 832 837 835 826
28. Effects of ESOP Exercise and Share Repurchases on Common Stock Balance Sheet Account and Number of Shares Outstanding
Number of Options Outstanding (shares): 39,235,557.00
Average Time to Maturity (years): 5.42
Expected Annual Number of Options Exercised: 7,243,487.45
Current Average Strike Price: 90.38
Cost of Equity: 9.96%
Current Stock Price: 166.37
2015E 2016E 2017E 2018E 2019E 2020E 2021E
Increase in Shares Outstanding: 7,243,487.45 7,243,487.45 7,243,487.45 7,243,487.45 7,243,487.45 3,042,264.73
Average Strike Price: 90.38 90.38 90.38 90.38 90.38 90.38 90.38
Increase in Common Stock Account: 654,666,395.38 654,666,395.38 654,666,395.38 654,666,395.38 654,666,395.38 274,959,886.06 0.00 (Assumes common stock and additional paid in capital are combined into one account).
Change in Treasury Stock 4,000,000,000.00 4,000,000,000.00 3,200,000,000.00 3,200,000,000.00 3,200,000,000.00 3,200,000,000.00 3,200,000,000.00
Expected Price of Repurchased Shares: 166.37 182.94 201.15 221.18 243.20 267.42 294.04
Number of Shares Repurchased: 24,042,796.18 21,865,634.91 15,908,498.71 14,467,927.20 13,157,804.60 11,966,318.28 10,882,725.32
Shares Outstanding (beginning of the year) 635,134,594.00 618,335,285.27 603,713,137.81 595,048,126.54 587,823,686.79 581,909,369.64 572,985,316.08
Plus: Shares Issued Through ESOP 7,243,487.45 7,243,487.45 7,243,487.45 7,243,487.45 7,243,487.45 3,042,264.73 0.00
Less: Shares Repurchased in Treasury 24,042,796.18 21,865,634.91 15,908,498.71 14,467,927.20 13,157,804.60 11,966,318.28 10,882,725.32
Shares Outstanding (end of the year) 618,335,285.27 603,713,137.81 595,048,126.54 587,823,686.79 581,909,369.64 572,985,316.08 562,102,590.76
29. VALUATION OF OPTIONS GRANTED IN ESOP
Ticker Symbol MMM
Current Stock Price 166.37
Risk Free Rate 3.45%
Current Dividend Yield 2.08%
Annualized St. Dev. of Stock Returns 13.91%
Average Average B-S Value
Range of Number Exercise Remaining Option of Options
Outstanding Options of Shares Price Life (yrs) Price Granted
Range 1 39,235,557.00 90.38 5.42 73.88 2,898,681,143.41
Total 39,235,557.00 90.38 5.42 91.40 2,898,681,143.41