SlideShare a Scribd company logo
1 of 16
Download to read offline
Powered by
UNICORN INC
BUSINESS PLAN SCANNER + COMPANY PROFILE
Contacts
Company full name: Unicorn Inc
Contact email: info@equidam.com
Valuation set on: 01.01.2018
Report date: 11.01.2019
The idea
Demand validated
Active globally
IP protection secured at global level
Scalable business
The Team
Founders committed full time
Work experience
Previously founded other companies
Most technical skills are outsourced
The Company
Legal entity
Advisory board in place
Expansion stage
Marketing
Informal agreements with key strategic partners
Finance
Not breakeven yet
Funded by business angels
Parties interested in buying the company
Scan business plan in a glance
The Business Plan Scanner displays the main features of the company project in the form of icons. The color at the top of the icon indicates the impact of
that specific feature on the overall quality of the company. Green stands for positive impact while red for negative. The purpose of this page is to give the
reader an immediate overview of the company quality and to make different projects comparable with each other based upon the same criteria. The
parameters analyzed are those identified as of the highest importance to angel investors according to the researches over historical company investing
activity.
Page 1
Copyright Equidam 2019
Powered by
COMPANY PROFILE
Unicorn Inc
Started in: 2017
Incorporated: Yes
Year of incorporation: 2017
Country: The Netherlands
Scalability: Yes
Industry: Online Services
Business Activity: Other Online Services
Committed resources
Capital: € 20,000
Founders time commitment: Full time
Stage of development:
Stage of development: Expansion stage
Product roll-out: Already to Market
Profitability: Not breakeven yet
Investment proposal
Capital needed: € 470,000
Equity offered: 15.0%
Core Business
Unicorn Inc produces the best quality single horn for horses. Our mission is to transform the world and
make it a better place.
Team
Founders: 3
Employees (excluding founders, interns and freelancers): 5
Founders time commitment: Full time
Skills and Experience
Years of experience in the industry: 5
Founded other companies before: Yes
Business and managerial: Business background and/or experience
Technical: Most technical skills are outsourced
Competition
Level of competition: Some small players
Competitive products are: On the same level and not comparable solutions
Page 2
Copyright Equidam 2019
Powered by
COMPANY PROFILE
Shareholders
Key figures
Latest operating performance Ratios
Revenues € 150,000 Net profit as % of revenues -161.3%
Cost of Goods Sold (COGS) € 160,000 . COGS as % of revenues 106.7%
Salaries € 210,000 . EBITDA as % of revenues -14.7%
Operating expenses (SGA) € 12,000
EBITDA € -232,000
EBIT € -242,000
Net profit € -242,000
Assets Liabilities
Cash and Equivalents € 100,000 Accounts Payables € 0
Accounts Receivables € 0 Other current liabilities € 0
Inventory € 0 Long term liabilities (Debt) € 100,000
Tangible assets € 0 Equity € 102,000
Intangible assets € 0
Financial assets € 77,000
Elevator pitch
As the world moved to cars, nobody thought about improving the horse. At Unicorn Inc we sell the best single horn for horses and we are headed to the
stratosphere.
Page 3
Copyright Equidam 2019
Powered by
VALUATION
The 5 Methods Used
€ 2,608,728 € 2,780,972
€ 8,127,248
€ 792,213
€ 8,359,672
Scorecard Method Check-List Method Venture Capital Method DCF with LTG DCF with Multiples
Valuation Average Weights
Weights
Valuation weights
The weights displayed in the chart are those used to
average the outcomes of the 5 valuation methodologies
implemented in this analysis. The weights are set according
to the stage of development of the start-up: the later the
stage and the higher the influence of analytical models given
the higher reliability of the financial projections. Users may
however prefer one method over another in determining their
valuation estimate.
of the 5 methods
6% 6% 16% 36% 36%
Page 4
Copyright Equidam 2019
Powered by
VALUATION
The Average Pre-Money valuation is: € 4,918,421
Lower Bound € 4,088,000
Higher Bound € 5,749,000
This determines a percentage of
for an investment of
8.7%
€ 470,000
7.6% 10.3%
Page 5
Copyright Equidam 2019
Powered by
QUALITATIVE METHODS
SCORECARD METHOD € 2,608,728
45.83%
50%
40%
50%
83.33%
50%
83.33%
50%
75%
50% 50% 50%
Strength of the
team
Size of the
Opportunity
Strength and
protection of the
product/service
Competitive
Environment
Strategic
relationships with
partners
Funding
required
Unicorn Inc Average valuation (The Netherlands). .
CRITERIA
Strength of the team 45.83%
Size of the Opportunity 40%
Strength and protection of the product/service 83.33%
Competitive Environment 83.33%
Strategic relationships with partners 75%
Funding required 50%
ASSUMPTIONS
Starting value of this method (Average Company Valuation) € 2,293,388
Comparable transactions are relevant in pricing a company
The main tenet of this method is that comparable transactions are relevant in pricing a company. It considers the average pre-money valuation of
companies from the same region as starting point. Then, for each of the 6 criteria, the company is assigned a score that indicates whether it performs better
or worse than comparable companies for those criteria. Based on these scores and their weights, the starting valuation will be adjusted upward or
downward. Originally developed in 2001 by American business angels, this method was published in 2007 by the Kauffman Foundation and revised in 2011
by Bill Payne from Ohio TechAngels. Equidam reviewed the score system and the information on which the scores are attributed.
Page 6
Copyright Equidam 2019
Powered by
QUALITATIVE METHODS
CHECK-LIST METHOD € 2,780,972
a
31%
100%
a
85.6%
100%
a
55.6%
100%
a
45.8%
100%
a
70%
100%
a
Quality of
the core
team
Quality of the
Idea
Product
roll-out and IP
protection
Strategic
Relationships
Operating
Stage
Unicorn Inc Maximum valuation (The Netherlands). .
CRITERIA
Quality of the core team 31%
Quality of the Idea 86%
Product roll-out and IP protection 56%
Strategic Relationships 46%
Operating Stage 70%
ASSUMPTIONS
Maximum value for this method € 5,000,000
Valuing intangible assets
The main tenet of this method is that intangible assets of early stage companies are the foundation of their future success, thus valuable - just as tangible
assets are for established businesses. It assumes a fixed maximum valuation based on the region and assigns the company a score for each of the 5
criteria. The weighted sum of the score of each criteria determines the pre-money valuation. Business Angel Investor Dave Berkus, who has participated in
more than 140 early-stage deals, proposed this method in 1996, and later extended it in 2016. Equidam reviewed the weights system and the information
on which the scores are attributed.
Page 7
Copyright Equidam 2019
Powered by
FINANCIAL FORECASTS
Revenues
01/2018 - 12/2018 01/2019 - 12/2019 01/2020 - 12/2020
€ 350,000
€ 125,000
€ 2,650,000
Average estimate
The stage of development of the company
allows for the estimation of expected
performance. The risk involved is however
very high since there is no track_record.
EBIT
€ -470,245 € -1,047,516
€ 855,856
The uncertainty featuring financial projections
The projections about the expected performance of the company are provided by the users and are not, by any means, subject to the previous check by
Equidam. The users are required to indicate the projected values regarding revenues and costs (fixed and variables), while other items as Working Capital,
Depreciation and Amortization and the interest expenses are estimated by Equidam according to industry-specific databases. The Cash Flows are also
estimated by the Equidam algorithm combining users’ inputs and the Equidam data. Equidam provides an indication of the level of reliability of the users’
projections based upon the stage of development of the business. Another way to check the reliability of the projections is offered by the revenues from
contracts in place, displayed in the second page of the Company Profile.
Page 8
Copyright Equidam 2019
Powered by
VC METHOD DCF WITH LTG DCF WITH MULTIPLES
Free Cash Flow to Equity for the next three years
€ -580,552 € -1,248,223
€ 438,214
€ 1,100,000
EBITDA Year 3
X
24.2
Industry multiple
€ 8,127,248
Pre-money valuation
49%
discount rate per year
5.5%
Equity
percentage
€ 470,000
Investment
CRITERIA
Exit value in year 3 € 26,668,276
ASSUMPTIONS
Annual discount rate applied 48.6%
The quick approach used by Venture Capital Funds
The venture capital method is a quick approach to the valuation of companies. It comprises in estimating the exit value of the company at the end of the forecast horizon
and ignoring the intermediate cash flows. The exit value is calculated by taking the final financial result of the company and applying the EBITDA multiple. This value is then
discounted at a high rate to get the present value. The discount rate is determined according to the stage of development and is reported in the table above. Given its
simplistic approach, this model does not apply illiquidity or survival discount as the following to methods do. The annual discount rate applied already accounts for these
issues.
Page 9
Copyright Equidam 2019
Powered by
VC METHOD DCF WITH LTG DCF WITH MULTIPLES
Cash flow table
Failure rate
Survival rate
€ -580,552
15.86%
84.14%
€ -1,248,223
25.81%
74.19%
€ 438,214
32.37%
67.63%
€ 1,100,347
12.8% 2.5 %
Discount rate Long-Term Growth
28%
Illiquidity discount € 792,213
Pre money valuation
37.2%
Equity percentage
CRITERIA
EBITDA Year 3 € 1,100,000
Long Term Growth Winsorized* 2.5%
Value of the company in the last Year (Terminal Value) € 2,949,071
*Winsorization is a statistic approach that eliminates the outliers from a dataset by applying a lower and higher bound. In this case is necessary since some of the industries
in the Equidam database have a negative historical growth.
ASSUMPTIONS
Beta 2.39
Market Risk Premium 5.1%
Weighted Average Cost of Capital 12.8%
The innovative approach to Discounted Cash Flows (DCF)
The DCF with terminal growth model is one of the most used models to value public companies. This method assumes that the company is going to survive at a steady and
constant growth rate. The growth rate applied is based on the industry of belonging. The Equidam methodology however applies two important additional features: 1. The
annual cash flows are estimated by the Equidam algorithm and are weighted according to the country-specific survival rate for companies. 2. The calculated present value
is further discounted by applying an illiquidity discount to account for the fact that the sale of the equity stake is likely to happen on the private market. As a consequence,
investors need a higher return. The illiquidity discount is estimated according to the work of academic researches.
Page 10
Copyright Equidam 2019
Powered by
VC METHOD DCF WITH LTG DCF WITH MULTIPLES
Cash flow table
Failure rate
Survival rate
€ -580,552
15.86%
84.14%
€ -1,248,223
25.81%
74.19%
€ 438,214
32.37%
67.63%
€ 1,100,000
EBITDA Year 3
X
24.2
Industry multiple
€ 11,611,194
12.8%
Discount rate
28%
Illiquidity
discount*
€ 8,359,672
Pre-money valuation
5.3%
Equity percentage
CRITERIA
EBITDA Year 3 € 1,100,000
EBITDA multiple Year 3 24.24
Value of the company in the last Year (Terminal Value) € 18,034,791
Implied Annual Return if sale value realized (ROI) 26.88%
ASSUMPTIONS
Beta 2.39
Market Risk Premium 5.1%
Weighted Average Cost of Capital 12.8%
Industry peers' comparison
The DCF with exit multiple is the other most used valuation approach. It is based on the assumption that the exit value of the company is determined by the average of
industry peers. The most commonly used multiple is the EBITDA multiple since the generated estimate is less susceptible to differences in the operating margin among
industry peers. The Equidam methodology also applies: 1. The annual cash flows are estimated by the Equidam algorithm and are weighted according to the
country-specific survival rate for companies. 2. The calculated present value is further discounted by applying an illiquidity discount to account for the fact that the sale of
the equity stake is likely to happen on the private market. As a consequence, investors need a higher return. The illiquidity discount is estimated according to the work of
academic researches
Page 11
Copyright Equidam 2019
Powered by
PROFIT AND LOSS CASH FLOW
01/2018 - 12/2018 01/2019 - 12/2019 01/2020 - 12/2020
Revenues € 350,000 € 125,000 € 2,650,000
Cost of goods sold € 200,000 € 250,000 € 325,000
Gross margin 42.9% -100% 87.7%
Salaries € 450,000 € 700,000 € 980,000
Selling, General and Administrative € 138,000 € 211,000 € 245,000
EBITDA € -438,000 € -1,036,000 € 1,100,000
Depreciation and Amortization € 32,245 € 11,516 € 244,144
as % of revenues 9.2% 9.2% 9.2%
EBIT € -470,245 € -1,047,516 € 855,856
Financial Gain-Loss € -15,180 € -19,819 € -124,316
Debt interest payment € 15,180 € 19,819 € 124,316
Interest rate on debt 12.65% 12.65% 12.65%
Cash interest gain € 0 € 0 € 0
Taxes € 0 € 0 € 0
Nominal tax rate 25% 25% 25%
Effective tax payable € -121,356 € -266,834 € 182,885
Deferred tax assets € 121,356 € 388,190 € 205,305
Net profit € -485,425 € -1,067,335 € 731,540
Good understanding of numbers is good understanding of business
Revenues, Cost of Goods Sold and Selling, General and Administrative are provided by the user, while the D&A and Financial expenses are estimated by Equidam. The
former is based upon the average D&A as % of Revenues of the industry peers and the latter upon the COVERAGE RATIO (EBIT/INTEREST PAID) and then adding the
related risk premium to the country-specific risk free rate. The risk premia related to the COVERAGE RATIO are fixed as determined by academic researches. The tax
outlays are determined by applying the country-specific tax rate for companies, as reported in the Equidam databases.
Page 12
Copyright Equidam 2019
Powered by
PROFIT AND LOSS CASH FLOW
01/2018 - 12/2018 01/2019 - 12/2019 01/2020 - 12/2020
Net profit € -485,425 € -1,067,335 € 731,540
Change in Working Capital € 27,372 € -17,596 € 197,470
Account payables € 23,095 € 8,248 € 174,859
Account receivables € 47,505 € 16,966 € 359,680
Inventory € 2,962 € 1,058 € 22,425
Depreciation and Amortization € 32,245 € 11,516 € 244,144
Capital Expenditures € 120,000 € 240,000 € 370,000
Change in outstanding debt € 20,000 € 30,000 € 30,000
Debt at the end of the year € 120,000 € 150,000 € 180,000
FREE CASH FLOW TO EQUITY € -580,552 € -1,248,223 € 438,214
Raise or repayment of equity € 0 € 0 € 0
Free cash flow € -580,552 € -1,248,223 € 438,214
Beginning of the year cash € 570,000 € -10,552 € -1,258,775
End of the year cash € -10,552 € -1,258,775 € -820,561
Cash is the king
The cash flows are estimated by Equidam starting from the user's data. This is to provide the reader with a more reliable estimation based upon industry peers benchmarks
rather than leaving the user the freedom to guess the estimates.
Both Depreciation and Amortization and Working Capital are based on the Equidam industry databases, while the change in Debt and in Equity and the investment outlays
are based upon the user's projections.
Page 13
Copyright Equidam 2019
Powered by
APPENDIX
SCORECARD METHOD CRITERIA DESCRIPTION
Time commitment of the founders
Number of employees
Team spirit and comradeship
Years of industry experience of the core team
Business and managerial background of the core team
Technical skills of the core team
Estimated revenues in the third year according to the stage of the development
Estimated size of the market in three years
Geographical scope of the business
Stage of the product/service roll-out
Degree of loyalty of customers
Type of IP protection applicable
IP protection in place (if any)
Level of competition in the market
Quality of competitive products/services
Competitive advantage over other products/services
Barriers to entry to the market
Threat of international competition
Strength of the relationships with key strategic partners
Capital required according to the stage of development
Page 14
Copyright Equidam 2019
Strength of the team analyzes:
Size the opportunity analyzes:
Strength and protection of the product/service analyzes:
Competitive environment analyzes:
Strategic relationships with partners analyzes:
Funding required includes:
Powered by
APPENDIX
CHECK-LIST METHOD CRITERIA DESCRIPTION
Average age of the founders
Presence in the team of serial, successful entrepreneurs
Time commitment of the founders
Team spirit and comradeship
Years of industry experience of the core team
Business and managerial background of the core team
Technical skills of the core team
Validation of the demand for the product/service
Feedback received by early adopters/industry experts
Level of competition in the market
Competitive advantage over other products/services
Geographical scope of the business
Threat of international competition
Degree of loyalty of customers
Stage of the product/service roll-out
Type of IP protection applicable
IP protection in place (if any)
Presence of an advisory board and number of advisors
Presence and type of current shareholders
Relationship with legal counselors
Strength of the relationships with key strategic partners
Stage of development
Current profitability
Page 15
Copyright Equidam 2019
Quality of the core team analyzes:
Quality of the idea analyzes:
Product roll-out and IP protection analyzes:
Strategic relationships analyzes:
Operating stage
About this report
This report was generated automatically using the Equidam Valuation
Platform.
Equidam is the easy way to compute and generate valuation reports.
To get a similar report for your company or other companies please visit
.www.equidam.com
Important legal notes
Equidam BV does not represent or endorse the accuracy or reliability of any advice, opinion, statement or any other information
displayed or distributed through this report or its website. The estimates and the data contained herein are made using the
information provided by the user, publicly available information and data for different industries. Equidam BV has not audited or
attempted to confirm this information for accuracy or completeness. Under no circumstances the present report is to be used or
considered as an offer, solicitation, or recommendation to sell, or a solicitation of any offer to buy any security. Equidam BV
excludes any warranties and responsibilities concerning the results to be obtained from the present report nor their use and
shall not be liable for any claims, losses or damages arising from or occasioned by any inaccuracy, error, delay, or omission, or
from use of the report or actions taken in reliance on the information contained in it. The use of this report and the information
provided herein is subject to Equidam BV online Terms of Use and Privacy Policy.

More Related Content

What's hot

Chapter 11 power point
Chapter 11 power pointChapter 11 power point
Chapter 11 power pointdphil002
 
Transformation update DHS newsletter-July2017
Transformation update DHS newsletter-July2017Transformation update DHS newsletter-July2017
Transformation update DHS newsletter-July2017Donovan Hornsby
 
Infographic Aegon Q1 2016 Results
Infographic Aegon Q1 2016 ResultsInfographic Aegon Q1 2016 Results
Infographic Aegon Q1 2016 ResultsAegon
 
Barclays European Financial Capital Summit
Barclays European Financial Capital SummitBarclays European Financial Capital Summit
Barclays European Financial Capital SummitAegon
 
Analyst & Investor Conference 2016 - Aegon Strategy Update
Analyst & Investor Conference 2016 - Aegon Strategy UpdateAnalyst & Investor Conference 2016 - Aegon Strategy Update
Analyst & Investor Conference 2016 - Aegon Strategy UpdateAegon
 
Responsible Investment Report 2015 - Aegon Asset Management
Responsible Investment Report 2015 - Aegon Asset ManagementResponsible Investment Report 2015 - Aegon Asset Management
Responsible Investment Report 2015 - Aegon Asset ManagementAegon
 
Morgan Stanley European Financials conference 2013
Morgan Stanley European Financials conference 2013Morgan Stanley European Financials conference 2013
Morgan Stanley European Financials conference 2013Ageas
 
FY2013 Results Investor Presentation as at 21 May 2013
FY2013 Results Investor Presentation as at 21 May 2013FY2013 Results Investor Presentation as at 21 May 2013
FY2013 Results Investor Presentation as at 21 May 2013Alliance Bank Malaysia Berhad
 
IAS 27 Consolidated Financial Statements
IAS 27 Consolidated Financial StatementsIAS 27 Consolidated Financial Statements
IAS 27 Consolidated Financial StatementsMaliha Jahan
 
Dutch Residential Mortgage Market Update & the SAECURE program
Dutch Residential Mortgage Market Update & the SAECURE programDutch Residential Mortgage Market Update & the SAECURE program
Dutch Residential Mortgage Market Update & the SAECURE programAegon
 
OperationsMarketUpdate2016
OperationsMarketUpdate2016OperationsMarketUpdate2016
OperationsMarketUpdate2016Emily Nunes
 
Capital structure
Capital structureCapital structure
Capital structureshagun jain
 
Acct 346 week 8 final exam
Acct 346 week 8 final examAcct 346 week 8 final exam
Acct 346 week 8 final exambrooktonformore4
 
Aegon Q4 2014 Results Presentation
Aegon Q4 2014 Results PresentationAegon Q4 2014 Results Presentation
Aegon Q4 2014 Results PresentationAegon
 
Citi European Insurance Conference
Citi European Insurance ConferenceCiti European Insurance Conference
Citi European Insurance ConferenceAegon
 
Singapore Productivity and Innovation Credit Scheme Guide
Singapore Productivity and Innovation Credit Scheme GuideSingapore Productivity and Innovation Credit Scheme Guide
Singapore Productivity and Innovation Credit Scheme GuideRikvin Pte Ltd
 
Aegon Q4 2015 Results Presentation
Aegon Q4 2015 Results PresentationAegon Q4 2015 Results Presentation
Aegon Q4 2015 Results PresentationAegon
 
MBH Corporation Investment Review
MBH Corporation Investment ReviewMBH Corporation Investment Review
MBH Corporation Investment ReviewDannyK9
 
Uop str 581 week 4 individual capstone final exam part 2 new
Uop str 581 week 4 individual capstone final exam part 2 newUop str 581 week 4 individual capstone final exam part 2 new
Uop str 581 week 4 individual capstone final exam part 2 newshyaminfo00
 

What's hot (20)

Chapter 11 power point
Chapter 11 power pointChapter 11 power point
Chapter 11 power point
 
Transformation update DHS newsletter-July2017
Transformation update DHS newsletter-July2017Transformation update DHS newsletter-July2017
Transformation update DHS newsletter-July2017
 
Infographic Aegon Q1 2016 Results
Infographic Aegon Q1 2016 ResultsInfographic Aegon Q1 2016 Results
Infographic Aegon Q1 2016 Results
 
Barclays European Financial Capital Summit
Barclays European Financial Capital SummitBarclays European Financial Capital Summit
Barclays European Financial Capital Summit
 
Analyst & Investor Conference 2016 - Aegon Strategy Update
Analyst & Investor Conference 2016 - Aegon Strategy UpdateAnalyst & Investor Conference 2016 - Aegon Strategy Update
Analyst & Investor Conference 2016 - Aegon Strategy Update
 
Responsible Investment Report 2015 - Aegon Asset Management
Responsible Investment Report 2015 - Aegon Asset ManagementResponsible Investment Report 2015 - Aegon Asset Management
Responsible Investment Report 2015 - Aegon Asset Management
 
Law Debenture Corp
Law Debenture CorpLaw Debenture Corp
Law Debenture Corp
 
Morgan Stanley European Financials conference 2013
Morgan Stanley European Financials conference 2013Morgan Stanley European Financials conference 2013
Morgan Stanley European Financials conference 2013
 
FY2013 Results Investor Presentation as at 21 May 2013
FY2013 Results Investor Presentation as at 21 May 2013FY2013 Results Investor Presentation as at 21 May 2013
FY2013 Results Investor Presentation as at 21 May 2013
 
IAS 27 Consolidated Financial Statements
IAS 27 Consolidated Financial StatementsIAS 27 Consolidated Financial Statements
IAS 27 Consolidated Financial Statements
 
Dutch Residential Mortgage Market Update & the SAECURE program
Dutch Residential Mortgage Market Update & the SAECURE programDutch Residential Mortgage Market Update & the SAECURE program
Dutch Residential Mortgage Market Update & the SAECURE program
 
OperationsMarketUpdate2016
OperationsMarketUpdate2016OperationsMarketUpdate2016
OperationsMarketUpdate2016
 
Capital structure
Capital structureCapital structure
Capital structure
 
Acct 346 week 8 final exam
Acct 346 week 8 final examAcct 346 week 8 final exam
Acct 346 week 8 final exam
 
Aegon Q4 2014 Results Presentation
Aegon Q4 2014 Results PresentationAegon Q4 2014 Results Presentation
Aegon Q4 2014 Results Presentation
 
Citi European Insurance Conference
Citi European Insurance ConferenceCiti European Insurance Conference
Citi European Insurance Conference
 
Singapore Productivity and Innovation Credit Scheme Guide
Singapore Productivity and Innovation Credit Scheme GuideSingapore Productivity and Innovation Credit Scheme Guide
Singapore Productivity and Innovation Credit Scheme Guide
 
Aegon Q4 2015 Results Presentation
Aegon Q4 2015 Results PresentationAegon Q4 2015 Results Presentation
Aegon Q4 2015 Results Presentation
 
MBH Corporation Investment Review
MBH Corporation Investment ReviewMBH Corporation Investment Review
MBH Corporation Investment Review
 
Uop str 581 week 4 individual capstone final exam part 2 new
Uop str 581 week 4 individual capstone final exam part 2 newUop str 581 week 4 individual capstone final exam part 2 new
Uop str 581 week 4 individual capstone final exam part 2 new
 

Similar to Company valuation-report-equidam-sample

Company valuation report sample
Company valuation report sampleCompany valuation report sample
Company valuation report sampleEquidam
 
Moelis Company April Investor Presentation
Moelis Company April Investor PresentationMoelis Company April Investor Presentation
Moelis Company April Investor PresentationMoelis_Company
 
Moelis company april investor pres_vfinal2
Moelis  company april investor pres_vfinal2Moelis  company april investor pres_vfinal2
Moelis company april investor pres_vfinal2Moelis_Company
 
Moelis company april investor pres_vfinal3
Moelis  company april investor pres_vfinal3Moelis  company april investor pres_vfinal3
Moelis company april investor pres_vfinal3Moelis_Company
 
Moelis Company - Q3 Investor Presentation
Moelis Company - Q3 Investor PresentationMoelis Company - Q3 Investor Presentation
Moelis Company - Q3 Investor PresentationMoelis_Company
 
Strategic Management Ch02
Strategic Management Ch02Strategic Management Ch02
Strategic Management Ch02Chuong Nguyen
 
Moelis Company July Investor Presentation
Moelis Company July Investor PresentationMoelis Company July Investor Presentation
Moelis Company July Investor PresentationMoelis_Company
 
Strategic assignment v1
Strategic assignment v1Strategic assignment v1
Strategic assignment v1Tabish Ahmad
 
Company Valuation PowerPoint Presentation Slides
Company Valuation PowerPoint Presentation Slides Company Valuation PowerPoint Presentation Slides
Company Valuation PowerPoint Presentation Slides SlideTeam
 
Company Valuation Powerpoint Presentation Slides
Company Valuation Powerpoint Presentation SlidesCompany Valuation Powerpoint Presentation Slides
Company Valuation Powerpoint Presentation SlidesSlideTeam
 
CLUB DEAL - UK - 0124 - DECK INVESTOR .pdf
CLUB DEAL - UK - 0124 - DECK INVESTOR .pdfCLUB DEAL - UK - 0124 - DECK INVESTOR .pdf
CLUB DEAL - UK - 0124 - DECK INVESTOR .pdfClarisse35
 
CLUB DEAL - UK - 0124
CLUB DEAL - UK - 0124CLUB DEAL - UK - 0124
CLUB DEAL - UK - 0124Clarisse35
 
Evaluation andControlChapter 11Learning ObjectivesUn.docx
Evaluation andControlChapter 11Learning ObjectivesUn.docxEvaluation andControlChapter 11Learning ObjectivesUn.docx
Evaluation andControlChapter 11Learning ObjectivesUn.docxelbanglis
 
Safeguard Scientifics Corporate Presentation - January 2015
Safeguard Scientifics Corporate Presentation - January 2015Safeguard Scientifics Corporate Presentation - January 2015
Safeguard Scientifics Corporate Presentation - January 2015Safeguard Scientifics
 

Similar to Company valuation-report-equidam-sample (20)

Company valuation report sample
Company valuation report sampleCompany valuation report sample
Company valuation report sample
 
APExampleAnalysis
APExampleAnalysisAPExampleAnalysis
APExampleAnalysis
 
Moelis Company April Investor Presentation
Moelis Company April Investor PresentationMoelis Company April Investor Presentation
Moelis Company April Investor Presentation
 
Moelis company april investor pres_vfinal2
Moelis  company april investor pres_vfinal2Moelis  company april investor pres_vfinal2
Moelis company april investor pres_vfinal2
 
Moelis company april investor pres_vfinal3
Moelis  company april investor pres_vfinal3Moelis  company april investor pres_vfinal3
Moelis company april investor pres_vfinal3
 
Moelis Company - Q3 Investor Presentation
Moelis Company - Q3 Investor PresentationMoelis Company - Q3 Investor Presentation
Moelis Company - Q3 Investor Presentation
 
Building Business Value
Building Business ValueBuilding Business Value
Building Business Value
 
Strategic Management Ch02
Strategic Management Ch02Strategic Management Ch02
Strategic Management Ch02
 
Moelis Company July Investor Presentation
Moelis Company July Investor PresentationMoelis Company July Investor Presentation
Moelis Company July Investor Presentation
 
First Investment Inc.
First Investment Inc.First Investment Inc.
First Investment Inc.
 
Strategic assignment v1
Strategic assignment v1Strategic assignment v1
Strategic assignment v1
 
Company Valuation PowerPoint Presentation Slides
Company Valuation PowerPoint Presentation Slides Company Valuation PowerPoint Presentation Slides
Company Valuation PowerPoint Presentation Slides
 
Company Valuation Powerpoint Presentation Slides
Company Valuation Powerpoint Presentation SlidesCompany Valuation Powerpoint Presentation Slides
Company Valuation Powerpoint Presentation Slides
 
CLUB DEAL - UK - 0124 - DECK INVESTOR .pdf
CLUB DEAL - UK - 0124 - DECK INVESTOR .pdfCLUB DEAL - UK - 0124 - DECK INVESTOR .pdf
CLUB DEAL - UK - 0124 - DECK INVESTOR .pdf
 
CLUB DEAL - UK - 0124
CLUB DEAL - UK - 0124CLUB DEAL - UK - 0124
CLUB DEAL - UK - 0124
 
Evaluation andControlChapter 11Learning ObjectivesUn.docx
Evaluation andControlChapter 11Learning ObjectivesUn.docxEvaluation andControlChapter 11Learning ObjectivesUn.docx
Evaluation andControlChapter 11Learning ObjectivesUn.docx
 
SIIA & OPEXEngine: Let the Data Set You Free!
SIIA & OPEXEngine: Let the Data Set You Free!SIIA & OPEXEngine: Let the Data Set You Free!
SIIA & OPEXEngine: Let the Data Set You Free!
 
Safeguard Scientifics Corporate Presentation - January 2015
Safeguard Scientifics Corporate Presentation - January 2015Safeguard Scientifics Corporate Presentation - January 2015
Safeguard Scientifics Corporate Presentation - January 2015
 
Investment Appraisal
Investment AppraisalInvestment Appraisal
Investment Appraisal
 
Hdbfm assignment group 06(2)
Hdbfm assignment   group 06(2)Hdbfm assignment   group 06(2)
Hdbfm assignment group 06(2)
 

More from Marina Benaguacil

Guia definitiva compressed (1)
Guia definitiva compressed (1)Guia definitiva compressed (1)
Guia definitiva compressed (1)Marina Benaguacil
 
Guía Ministerio Trabajo sobre la adaptación del Registro Horario
Guía Ministerio Trabajo sobre la adaptación del Registro Horario Guía Ministerio Trabajo sobre la adaptación del Registro Horario
Guía Ministerio Trabajo sobre la adaptación del Registro Horario Marina Benaguacil
 
Periodo de prueba del contrato de trabajo
Periodo de prueba del contrato de trabajoPeriodo de prueba del contrato de trabajo
Periodo de prueba del contrato de trabajoMarina Benaguacil
 
El Calendario Fiscal 2018 definitivo
El Calendario Fiscal 2018 definitivoEl Calendario Fiscal 2018 definitivo
El Calendario Fiscal 2018 definitivoMarina Benaguacil
 
Nuevas ayudas para autónomos en 2018 (2)
Nuevas ayudas para autónomos en 2018 (2)Nuevas ayudas para autónomos en 2018 (2)
Nuevas ayudas para autónomos en 2018 (2)Marina Benaguacil
 
Subrogación de Trabajadores
Subrogación de TrabajadoresSubrogación de Trabajadores
Subrogación de TrabajadoresMarina Benaguacil
 
REDEME. Régimen De Devolución Mensual
REDEME. Régimen De Devolución Mensual REDEME. Régimen De Devolución Mensual
REDEME. Régimen De Devolución Mensual Marina Benaguacil
 
Contrato con ETT, las condiciones del contrato temporal
Contrato con ETT, las condiciones del contrato temporalContrato con ETT, las condiciones del contrato temporal
Contrato con ETT, las condiciones del contrato temporalMarina Benaguacil
 
El número de serie de la factura
El número de serie de la facturaEl número de serie de la factura
El número de serie de la facturaMarina Benaguacil
 
Calendario fiscal-2017-tugesto
Calendario fiscal-2017-tugestoCalendario fiscal-2017-tugesto
Calendario fiscal-2017-tugestoMarina Benaguacil
 

More from Marina Benaguacil (15)

Guia definitiva compressed (1)
Guia definitiva compressed (1)Guia definitiva compressed (1)
Guia definitiva compressed (1)
 
Alta autonomo paso a paso
Alta autonomo paso a pasoAlta autonomo paso a paso
Alta autonomo paso a paso
 
Alta autonomo paso a paso
Alta autonomo paso a pasoAlta autonomo paso a paso
Alta autonomo paso a paso
 
Guía Ministerio Trabajo sobre la adaptación del Registro Horario
Guía Ministerio Trabajo sobre la adaptación del Registro Horario Guía Ministerio Trabajo sobre la adaptación del Registro Horario
Guía Ministerio Trabajo sobre la adaptación del Registro Horario
 
Creacion empresa
Creacion empresaCreacion empresa
Creacion empresa
 
Alta autonomo
Alta autonomoAlta autonomo
Alta autonomo
 
Periodo de prueba del contrato de trabajo
Periodo de prueba del contrato de trabajoPeriodo de prueba del contrato de trabajo
Periodo de prueba del contrato de trabajo
 
El Calendario Fiscal 2018 definitivo
El Calendario Fiscal 2018 definitivoEl Calendario Fiscal 2018 definitivo
El Calendario Fiscal 2018 definitivo
 
Nuevas ayudas para autónomos en 2018 (2)
Nuevas ayudas para autónomos en 2018 (2)Nuevas ayudas para autónomos en 2018 (2)
Nuevas ayudas para autónomos en 2018 (2)
 
Subrogación de Trabajadores
Subrogación de TrabajadoresSubrogación de Trabajadores
Subrogación de Trabajadores
 
REDEME. Régimen De Devolución Mensual
REDEME. Régimen De Devolución Mensual REDEME. Régimen De Devolución Mensual
REDEME. Régimen De Devolución Mensual
 
Contrato con ETT, las condiciones del contrato temporal
Contrato con ETT, las condiciones del contrato temporalContrato con ETT, las condiciones del contrato temporal
Contrato con ETT, las condiciones del contrato temporal
 
El número de serie de la factura
El número de serie de la facturaEl número de serie de la factura
El número de serie de la factura
 
¿Cómo son los autónomos?
¿Cómo son los autónomos?¿Cómo son los autónomos?
¿Cómo son los autónomos?
 
Calendario fiscal-2017-tugesto
Calendario fiscal-2017-tugestoCalendario fiscal-2017-tugesto
Calendario fiscal-2017-tugesto
 

Recently uploaded

办昆士兰大学UQ毕业证书/成绩单GPA修改 - 留学买假毕业证
办昆士兰大学UQ毕业证书/成绩单GPA修改 - 留学买假毕业证办昆士兰大学UQ毕业证书/成绩单GPA修改 - 留学买假毕业证
办昆士兰大学UQ毕业证书/成绩单GPA修改 - 留学买假毕业证0622mpom
 
(8264348440) 🔝 Call Girls In Khanpur 🔝 Delhi NCR
(8264348440) 🔝 Call Girls In Khanpur 🔝 Delhi NCR(8264348440) 🔝 Call Girls In Khanpur 🔝 Delhi NCR
(8264348440) 🔝 Call Girls In Khanpur 🔝 Delhi NCRsoniya singh
 
Call Girls At-( Nearby )-Bhikaji Cama Place, Delhi | ⑧③77⓿⑧76⓿7
Call Girls At-( Nearby )-Bhikaji Cama Place, Delhi | ⑧③77⓿⑧76⓿7Call Girls At-( Nearby )-Bhikaji Cama Place, Delhi | ⑧③77⓿⑧76⓿7
Call Girls At-( Nearby )-Bhikaji Cama Place, Delhi | ⑧③77⓿⑧76⓿7dollysharma2066
 
Call Girls in Tilak Nagar (DELHI-) 8377877756 Call Girls Service
Call Girls in Tilak Nagar (DELHI-) 8377877756 Call Girls ServiceCall Girls in Tilak Nagar (DELHI-) 8377877756 Call Girls Service
Call Girls in Tilak Nagar (DELHI-) 8377877756 Call Girls Servicedollysharma2066
 
Authentic No 1 Amil Baba In Pakistan Amil Baba In Faisalabad Amil Baba In Kar...
Authentic No 1 Amil Baba In Pakistan Amil Baba In Faisalabad Amil Baba In Kar...Authentic No 1 Amil Baba In Pakistan Amil Baba In Faisalabad Amil Baba In Kar...
Authentic No 1 Amil Baba In Pakistan Amil Baba In Faisalabad Amil Baba In Kar...Authentic No 1 Amil Baba In Pakistan
 
(8264348440) 🔝 Call Girls In Green Park 🔝 Delhi NCR
(8264348440) 🔝 Call Girls In Green Park 🔝 Delhi NCR(8264348440) 🔝 Call Girls In Green Park 🔝 Delhi NCR
(8264348440) 🔝 Call Girls In Green Park 🔝 Delhi NCRsoniya singh
 
(8264348440) 🔝 Call Girls In Sriniwaspuri 🔝 Delhi NCR
(8264348440) 🔝 Call Girls In Sriniwaspuri 🔝 Delhi NCR(8264348440) 🔝 Call Girls In Sriniwaspuri 🔝 Delhi NCR
(8264348440) 🔝 Call Girls In Sriniwaspuri 🔝 Delhi NCRsoniya singh
 
Guwahati Call Girls 7001305949 WhatsApp Number 24x7 Best Services
Guwahati Call Girls 7001305949 WhatsApp Number 24x7 Best ServicesGuwahati Call Girls 7001305949 WhatsApp Number 24x7 Best Services
Guwahati Call Girls 7001305949 WhatsApp Number 24x7 Best Servicesnajka9823
 
Report about the AHIABGA-UnityNet UNDRIPDay / Earth-Day 2024 Gathering in Mar...
Report about the AHIABGA-UnityNet UNDRIPDay / Earth-Day 2024 Gathering in Mar...Report about the AHIABGA-UnityNet UNDRIPDay / Earth-Day 2024 Gathering in Mar...
Report about the AHIABGA-UnityNet UNDRIPDay / Earth-Day 2024 Gathering in Mar...LHelferty
 
Viet Nam Inclusive Business Accreditation System
Viet Nam Inclusive Business Accreditation SystemViet Nam Inclusive Business Accreditation System
Viet Nam Inclusive Business Accreditation SystemTri Dung, Tran
 
Model Call Girl in Bawana Delhi reach out to us at 🔝8264348440🔝
Model Call Girl in Bawana Delhi reach out to us at 🔝8264348440🔝Model Call Girl in Bawana Delhi reach out to us at 🔝8264348440🔝
Model Call Girl in Bawana Delhi reach out to us at 🔝8264348440🔝soniya singh
 
Delhi Munirka 🔝 Call Girls Service 🔝 ( 8264348440 ) unlimited hard sex call girl
Delhi Munirka 🔝 Call Girls Service 🔝 ( 8264348440 ) unlimited hard sex call girlDelhi Munirka 🔝 Call Girls Service 🔝 ( 8264348440 ) unlimited hard sex call girl
Delhi Munirka 🔝 Call Girls Service 🔝 ( 8264348440 ) unlimited hard sex call girlsoniya singh
 
TDC Health Limited Nigeria Business Plan Opportunity Presentation 2024
TDC Health Limited Nigeria Business Plan Opportunity Presentation 2024TDC Health Limited Nigeria Business Plan Opportunity Presentation 2024
TDC Health Limited Nigeria Business Plan Opportunity Presentation 2024Fikrie Omar
 
(8264348440) 🔝 Call Girls In Babarpur 🔝 Delhi NCR
(8264348440) 🔝 Call Girls In Babarpur 🔝 Delhi NCR(8264348440) 🔝 Call Girls In Babarpur 🔝 Delhi NCR
(8264348440) 🔝 Call Girls In Babarpur 🔝 Delhi NCRsoniya singh
 
Gurgaon Rajiv Chowk 🔝 Call Girls Service 🔝 ( 8264348440 ) unlimited hard sex ...
Gurgaon Rajiv Chowk 🔝 Call Girls Service 🔝 ( 8264348440 ) unlimited hard sex ...Gurgaon Rajiv Chowk 🔝 Call Girls Service 🔝 ( 8264348440 ) unlimited hard sex ...
Gurgaon Rajiv Chowk 🔝 Call Girls Service 🔝 ( 8264348440 ) unlimited hard sex ...soniya singh
 

Recently uploaded (20)

办昆士兰大学UQ毕业证书/成绩单GPA修改 - 留学买假毕业证
办昆士兰大学UQ毕业证书/成绩单GPA修改 - 留学买假毕业证办昆士兰大学UQ毕业证书/成绩单GPA修改 - 留学买假毕业证
办昆士兰大学UQ毕业证书/成绩单GPA修改 - 留学买假毕业证
 
(8264348440) 🔝 Call Girls In Khanpur 🔝 Delhi NCR
(8264348440) 🔝 Call Girls In Khanpur 🔝 Delhi NCR(8264348440) 🔝 Call Girls In Khanpur 🔝 Delhi NCR
(8264348440) 🔝 Call Girls In Khanpur 🔝 Delhi NCR
 
Call Girls At-( Nearby )-Bhikaji Cama Place, Delhi | ⑧③77⓿⑧76⓿7
Call Girls At-( Nearby )-Bhikaji Cama Place, Delhi | ⑧③77⓿⑧76⓿7Call Girls At-( Nearby )-Bhikaji Cama Place, Delhi | ⑧③77⓿⑧76⓿7
Call Girls At-( Nearby )-Bhikaji Cama Place, Delhi | ⑧③77⓿⑧76⓿7
 
Cheap Rate ➥8448380779 ▻Call Girls In Sector 54 Gurgaon
Cheap Rate ➥8448380779 ▻Call Girls In Sector 54 GurgaonCheap Rate ➥8448380779 ▻Call Girls In Sector 54 Gurgaon
Cheap Rate ➥8448380779 ▻Call Girls In Sector 54 Gurgaon
 
Call Girls in Tilak Nagar (DELHI-) 8377877756 Call Girls Service
Call Girls in Tilak Nagar (DELHI-) 8377877756 Call Girls ServiceCall Girls in Tilak Nagar (DELHI-) 8377877756 Call Girls Service
Call Girls in Tilak Nagar (DELHI-) 8377877756 Call Girls Service
 
Authentic No 1 Amil Baba In Pakistan Amil Baba In Faisalabad Amil Baba In Kar...
Authentic No 1 Amil Baba In Pakistan Amil Baba In Faisalabad Amil Baba In Kar...Authentic No 1 Amil Baba In Pakistan Amil Baba In Faisalabad Amil Baba In Kar...
Authentic No 1 Amil Baba In Pakistan Amil Baba In Faisalabad Amil Baba In Kar...
 
(8264348440) 🔝 Call Girls In Green Park 🔝 Delhi NCR
(8264348440) 🔝 Call Girls In Green Park 🔝 Delhi NCR(8264348440) 🔝 Call Girls In Green Park 🔝 Delhi NCR
(8264348440) 🔝 Call Girls In Green Park 🔝 Delhi NCR
 
Cheap Rate ➥8448380779 ▻Call Girls In Sector 56 Gurgaon
Cheap Rate ➥8448380779 ▻Call Girls In Sector 56 GurgaonCheap Rate ➥8448380779 ▻Call Girls In Sector 56 Gurgaon
Cheap Rate ➥8448380779 ▻Call Girls In Sector 56 Gurgaon
 
(8264348440) 🔝 Call Girls In Sriniwaspuri 🔝 Delhi NCR
(8264348440) 🔝 Call Girls In Sriniwaspuri 🔝 Delhi NCR(8264348440) 🔝 Call Girls In Sriniwaspuri 🔝 Delhi NCR
(8264348440) 🔝 Call Girls In Sriniwaspuri 🔝 Delhi NCR
 
Hot Sexy call girls in Rajouri Garden🔝 9953056974 🔝 Delhi escort Service
Hot Sexy call girls in  Rajouri Garden🔝 9953056974 🔝 Delhi escort ServiceHot Sexy call girls in  Rajouri Garden🔝 9953056974 🔝 Delhi escort Service
Hot Sexy call girls in Rajouri Garden🔝 9953056974 🔝 Delhi escort Service
 
Cheap Rate ➥8448380779 ▻Call Girls In Sector 55 Gurgaon
Cheap Rate ➥8448380779 ▻Call Girls In Sector 55 GurgaonCheap Rate ➥8448380779 ▻Call Girls In Sector 55 Gurgaon
Cheap Rate ➥8448380779 ▻Call Girls In Sector 55 Gurgaon
 
Guwahati Call Girls 7001305949 WhatsApp Number 24x7 Best Services
Guwahati Call Girls 7001305949 WhatsApp Number 24x7 Best ServicesGuwahati Call Girls 7001305949 WhatsApp Number 24x7 Best Services
Guwahati Call Girls 7001305949 WhatsApp Number 24x7 Best Services
 
Report about the AHIABGA-UnityNet UNDRIPDay / Earth-Day 2024 Gathering in Mar...
Report about the AHIABGA-UnityNet UNDRIPDay / Earth-Day 2024 Gathering in Mar...Report about the AHIABGA-UnityNet UNDRIPDay / Earth-Day 2024 Gathering in Mar...
Report about the AHIABGA-UnityNet UNDRIPDay / Earth-Day 2024 Gathering in Mar...
 
Pakistani Jumeirah Call Girls # +971559085003 # Pakistani Call Girls In Jumei...
Pakistani Jumeirah Call Girls # +971559085003 # Pakistani Call Girls In Jumei...Pakistani Jumeirah Call Girls # +971559085003 # Pakistani Call Girls In Jumei...
Pakistani Jumeirah Call Girls # +971559085003 # Pakistani Call Girls In Jumei...
 
Viet Nam Inclusive Business Accreditation System
Viet Nam Inclusive Business Accreditation SystemViet Nam Inclusive Business Accreditation System
Viet Nam Inclusive Business Accreditation System
 
Model Call Girl in Bawana Delhi reach out to us at 🔝8264348440🔝
Model Call Girl in Bawana Delhi reach out to us at 🔝8264348440🔝Model Call Girl in Bawana Delhi reach out to us at 🔝8264348440🔝
Model Call Girl in Bawana Delhi reach out to us at 🔝8264348440🔝
 
Delhi Munirka 🔝 Call Girls Service 🔝 ( 8264348440 ) unlimited hard sex call girl
Delhi Munirka 🔝 Call Girls Service 🔝 ( 8264348440 ) unlimited hard sex call girlDelhi Munirka 🔝 Call Girls Service 🔝 ( 8264348440 ) unlimited hard sex call girl
Delhi Munirka 🔝 Call Girls Service 🔝 ( 8264348440 ) unlimited hard sex call girl
 
TDC Health Limited Nigeria Business Plan Opportunity Presentation 2024
TDC Health Limited Nigeria Business Plan Opportunity Presentation 2024TDC Health Limited Nigeria Business Plan Opportunity Presentation 2024
TDC Health Limited Nigeria Business Plan Opportunity Presentation 2024
 
(8264348440) 🔝 Call Girls In Babarpur 🔝 Delhi NCR
(8264348440) 🔝 Call Girls In Babarpur 🔝 Delhi NCR(8264348440) 🔝 Call Girls In Babarpur 🔝 Delhi NCR
(8264348440) 🔝 Call Girls In Babarpur 🔝 Delhi NCR
 
Gurgaon Rajiv Chowk 🔝 Call Girls Service 🔝 ( 8264348440 ) unlimited hard sex ...
Gurgaon Rajiv Chowk 🔝 Call Girls Service 🔝 ( 8264348440 ) unlimited hard sex ...Gurgaon Rajiv Chowk 🔝 Call Girls Service 🔝 ( 8264348440 ) unlimited hard sex ...
Gurgaon Rajiv Chowk 🔝 Call Girls Service 🔝 ( 8264348440 ) unlimited hard sex ...
 

Company valuation-report-equidam-sample

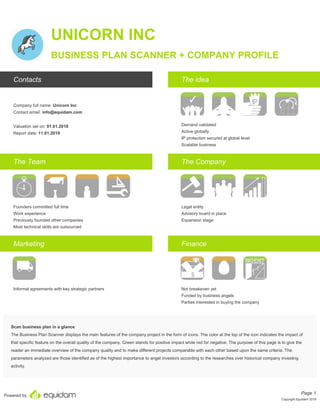
  • 1. Powered by UNICORN INC BUSINESS PLAN SCANNER + COMPANY PROFILE Contacts Company full name: Unicorn Inc Contact email: info@equidam.com Valuation set on: 01.01.2018 Report date: 11.01.2019 The idea Demand validated Active globally IP protection secured at global level Scalable business The Team Founders committed full time Work experience Previously founded other companies Most technical skills are outsourced The Company Legal entity Advisory board in place Expansion stage Marketing Informal agreements with key strategic partners Finance Not breakeven yet Funded by business angels Parties interested in buying the company Scan business plan in a glance The Business Plan Scanner displays the main features of the company project in the form of icons. The color at the top of the icon indicates the impact of that specific feature on the overall quality of the company. Green stands for positive impact while red for negative. The purpose of this page is to give the reader an immediate overview of the company quality and to make different projects comparable with each other based upon the same criteria. The parameters analyzed are those identified as of the highest importance to angel investors according to the researches over historical company investing activity. Page 1 Copyright Equidam 2019
  • 2. Powered by COMPANY PROFILE Unicorn Inc Started in: 2017 Incorporated: Yes Year of incorporation: 2017 Country: The Netherlands Scalability: Yes Industry: Online Services Business Activity: Other Online Services Committed resources Capital: € 20,000 Founders time commitment: Full time Stage of development: Stage of development: Expansion stage Product roll-out: Already to Market Profitability: Not breakeven yet Investment proposal Capital needed: € 470,000 Equity offered: 15.0% Core Business Unicorn Inc produces the best quality single horn for horses. Our mission is to transform the world and make it a better place. Team Founders: 3 Employees (excluding founders, interns and freelancers): 5 Founders time commitment: Full time Skills and Experience Years of experience in the industry: 5 Founded other companies before: Yes Business and managerial: Business background and/or experience Technical: Most technical skills are outsourced Competition Level of competition: Some small players Competitive products are: On the same level and not comparable solutions Page 2 Copyright Equidam 2019
  • 3. Powered by COMPANY PROFILE Shareholders Key figures Latest operating performance Ratios Revenues € 150,000 Net profit as % of revenues -161.3% Cost of Goods Sold (COGS) € 160,000 . COGS as % of revenues 106.7% Salaries € 210,000 . EBITDA as % of revenues -14.7% Operating expenses (SGA) € 12,000 EBITDA € -232,000 EBIT € -242,000 Net profit € -242,000 Assets Liabilities Cash and Equivalents € 100,000 Accounts Payables € 0 Accounts Receivables € 0 Other current liabilities € 0 Inventory € 0 Long term liabilities (Debt) € 100,000 Tangible assets € 0 Equity € 102,000 Intangible assets € 0 Financial assets € 77,000 Elevator pitch As the world moved to cars, nobody thought about improving the horse. At Unicorn Inc we sell the best single horn for horses and we are headed to the stratosphere. Page 3 Copyright Equidam 2019
  • 4. Powered by VALUATION The 5 Methods Used € 2,608,728 € 2,780,972 € 8,127,248 € 792,213 € 8,359,672 Scorecard Method Check-List Method Venture Capital Method DCF with LTG DCF with Multiples Valuation Average Weights Weights Valuation weights The weights displayed in the chart are those used to average the outcomes of the 5 valuation methodologies implemented in this analysis. The weights are set according to the stage of development of the start-up: the later the stage and the higher the influence of analytical models given the higher reliability of the financial projections. Users may however prefer one method over another in determining their valuation estimate. of the 5 methods 6% 6% 16% 36% 36% Page 4 Copyright Equidam 2019
  • 5. Powered by VALUATION The Average Pre-Money valuation is: € 4,918,421 Lower Bound € 4,088,000 Higher Bound € 5,749,000 This determines a percentage of for an investment of 8.7% € 470,000 7.6% 10.3% Page 5 Copyright Equidam 2019
  • 6. Powered by QUALITATIVE METHODS SCORECARD METHOD € 2,608,728 45.83% 50% 40% 50% 83.33% 50% 83.33% 50% 75% 50% 50% 50% Strength of the team Size of the Opportunity Strength and protection of the product/service Competitive Environment Strategic relationships with partners Funding required Unicorn Inc Average valuation (The Netherlands). . CRITERIA Strength of the team 45.83% Size of the Opportunity 40% Strength and protection of the product/service 83.33% Competitive Environment 83.33% Strategic relationships with partners 75% Funding required 50% ASSUMPTIONS Starting value of this method (Average Company Valuation) € 2,293,388 Comparable transactions are relevant in pricing a company The main tenet of this method is that comparable transactions are relevant in pricing a company. It considers the average pre-money valuation of companies from the same region as starting point. Then, for each of the 6 criteria, the company is assigned a score that indicates whether it performs better or worse than comparable companies for those criteria. Based on these scores and their weights, the starting valuation will be adjusted upward or downward. Originally developed in 2001 by American business angels, this method was published in 2007 by the Kauffman Foundation and revised in 2011 by Bill Payne from Ohio TechAngels. Equidam reviewed the score system and the information on which the scores are attributed. Page 6 Copyright Equidam 2019
  • 7. Powered by QUALITATIVE METHODS CHECK-LIST METHOD € 2,780,972 a 31% 100% a 85.6% 100% a 55.6% 100% a 45.8% 100% a 70% 100% a Quality of the core team Quality of the Idea Product roll-out and IP protection Strategic Relationships Operating Stage Unicorn Inc Maximum valuation (The Netherlands). . CRITERIA Quality of the core team 31% Quality of the Idea 86% Product roll-out and IP protection 56% Strategic Relationships 46% Operating Stage 70% ASSUMPTIONS Maximum value for this method € 5,000,000 Valuing intangible assets The main tenet of this method is that intangible assets of early stage companies are the foundation of their future success, thus valuable - just as tangible assets are for established businesses. It assumes a fixed maximum valuation based on the region and assigns the company a score for each of the 5 criteria. The weighted sum of the score of each criteria determines the pre-money valuation. Business Angel Investor Dave Berkus, who has participated in more than 140 early-stage deals, proposed this method in 1996, and later extended it in 2016. Equidam reviewed the weights system and the information on which the scores are attributed. Page 7 Copyright Equidam 2019
  • 8. Powered by FINANCIAL FORECASTS Revenues 01/2018 - 12/2018 01/2019 - 12/2019 01/2020 - 12/2020 € 350,000 € 125,000 € 2,650,000 Average estimate The stage of development of the company allows for the estimation of expected performance. The risk involved is however very high since there is no track_record. EBIT € -470,245 € -1,047,516 € 855,856 The uncertainty featuring financial projections The projections about the expected performance of the company are provided by the users and are not, by any means, subject to the previous check by Equidam. The users are required to indicate the projected values regarding revenues and costs (fixed and variables), while other items as Working Capital, Depreciation and Amortization and the interest expenses are estimated by Equidam according to industry-specific databases. The Cash Flows are also estimated by the Equidam algorithm combining users’ inputs and the Equidam data. Equidam provides an indication of the level of reliability of the users’ projections based upon the stage of development of the business. Another way to check the reliability of the projections is offered by the revenues from contracts in place, displayed in the second page of the Company Profile. Page 8 Copyright Equidam 2019
  • 9. Powered by VC METHOD DCF WITH LTG DCF WITH MULTIPLES Free Cash Flow to Equity for the next three years € -580,552 € -1,248,223 € 438,214 € 1,100,000 EBITDA Year 3 X 24.2 Industry multiple € 8,127,248 Pre-money valuation 49% discount rate per year 5.5% Equity percentage € 470,000 Investment CRITERIA Exit value in year 3 € 26,668,276 ASSUMPTIONS Annual discount rate applied 48.6% The quick approach used by Venture Capital Funds The venture capital method is a quick approach to the valuation of companies. It comprises in estimating the exit value of the company at the end of the forecast horizon and ignoring the intermediate cash flows. The exit value is calculated by taking the final financial result of the company and applying the EBITDA multiple. This value is then discounted at a high rate to get the present value. The discount rate is determined according to the stage of development and is reported in the table above. Given its simplistic approach, this model does not apply illiquidity or survival discount as the following to methods do. The annual discount rate applied already accounts for these issues. Page 9 Copyright Equidam 2019
  • 10. Powered by VC METHOD DCF WITH LTG DCF WITH MULTIPLES Cash flow table Failure rate Survival rate € -580,552 15.86% 84.14% € -1,248,223 25.81% 74.19% € 438,214 32.37% 67.63% € 1,100,347 12.8% 2.5 % Discount rate Long-Term Growth 28% Illiquidity discount € 792,213 Pre money valuation 37.2% Equity percentage CRITERIA EBITDA Year 3 € 1,100,000 Long Term Growth Winsorized* 2.5% Value of the company in the last Year (Terminal Value) € 2,949,071 *Winsorization is a statistic approach that eliminates the outliers from a dataset by applying a lower and higher bound. In this case is necessary since some of the industries in the Equidam database have a negative historical growth. ASSUMPTIONS Beta 2.39 Market Risk Premium 5.1% Weighted Average Cost of Capital 12.8% The innovative approach to Discounted Cash Flows (DCF) The DCF with terminal growth model is one of the most used models to value public companies. This method assumes that the company is going to survive at a steady and constant growth rate. The growth rate applied is based on the industry of belonging. The Equidam methodology however applies two important additional features: 1. The annual cash flows are estimated by the Equidam algorithm and are weighted according to the country-specific survival rate for companies. 2. The calculated present value is further discounted by applying an illiquidity discount to account for the fact that the sale of the equity stake is likely to happen on the private market. As a consequence, investors need a higher return. The illiquidity discount is estimated according to the work of academic researches. Page 10 Copyright Equidam 2019
  • 11. Powered by VC METHOD DCF WITH LTG DCF WITH MULTIPLES Cash flow table Failure rate Survival rate € -580,552 15.86% 84.14% € -1,248,223 25.81% 74.19% € 438,214 32.37% 67.63% € 1,100,000 EBITDA Year 3 X 24.2 Industry multiple € 11,611,194 12.8% Discount rate 28% Illiquidity discount* € 8,359,672 Pre-money valuation 5.3% Equity percentage CRITERIA EBITDA Year 3 € 1,100,000 EBITDA multiple Year 3 24.24 Value of the company in the last Year (Terminal Value) € 18,034,791 Implied Annual Return if sale value realized (ROI) 26.88% ASSUMPTIONS Beta 2.39 Market Risk Premium 5.1% Weighted Average Cost of Capital 12.8% Industry peers' comparison The DCF with exit multiple is the other most used valuation approach. It is based on the assumption that the exit value of the company is determined by the average of industry peers. The most commonly used multiple is the EBITDA multiple since the generated estimate is less susceptible to differences in the operating margin among industry peers. The Equidam methodology also applies: 1. The annual cash flows are estimated by the Equidam algorithm and are weighted according to the country-specific survival rate for companies. 2. The calculated present value is further discounted by applying an illiquidity discount to account for the fact that the sale of the equity stake is likely to happen on the private market. As a consequence, investors need a higher return. The illiquidity discount is estimated according to the work of academic researches Page 11 Copyright Equidam 2019
  • 12. Powered by PROFIT AND LOSS CASH FLOW 01/2018 - 12/2018 01/2019 - 12/2019 01/2020 - 12/2020 Revenues € 350,000 € 125,000 € 2,650,000 Cost of goods sold € 200,000 € 250,000 € 325,000 Gross margin 42.9% -100% 87.7% Salaries € 450,000 € 700,000 € 980,000 Selling, General and Administrative € 138,000 € 211,000 € 245,000 EBITDA € -438,000 € -1,036,000 € 1,100,000 Depreciation and Amortization € 32,245 € 11,516 € 244,144 as % of revenues 9.2% 9.2% 9.2% EBIT € -470,245 € -1,047,516 € 855,856 Financial Gain-Loss € -15,180 € -19,819 € -124,316 Debt interest payment € 15,180 € 19,819 € 124,316 Interest rate on debt 12.65% 12.65% 12.65% Cash interest gain € 0 € 0 € 0 Taxes € 0 € 0 € 0 Nominal tax rate 25% 25% 25% Effective tax payable € -121,356 € -266,834 € 182,885 Deferred tax assets € 121,356 € 388,190 € 205,305 Net profit € -485,425 € -1,067,335 € 731,540 Good understanding of numbers is good understanding of business Revenues, Cost of Goods Sold and Selling, General and Administrative are provided by the user, while the D&A and Financial expenses are estimated by Equidam. The former is based upon the average D&A as % of Revenues of the industry peers and the latter upon the COVERAGE RATIO (EBIT/INTEREST PAID) and then adding the related risk premium to the country-specific risk free rate. The risk premia related to the COVERAGE RATIO are fixed as determined by academic researches. The tax outlays are determined by applying the country-specific tax rate for companies, as reported in the Equidam databases. Page 12 Copyright Equidam 2019
  • 13. Powered by PROFIT AND LOSS CASH FLOW 01/2018 - 12/2018 01/2019 - 12/2019 01/2020 - 12/2020 Net profit € -485,425 € -1,067,335 € 731,540 Change in Working Capital € 27,372 € -17,596 € 197,470 Account payables € 23,095 € 8,248 € 174,859 Account receivables € 47,505 € 16,966 € 359,680 Inventory € 2,962 € 1,058 € 22,425 Depreciation and Amortization € 32,245 € 11,516 € 244,144 Capital Expenditures € 120,000 € 240,000 € 370,000 Change in outstanding debt € 20,000 € 30,000 € 30,000 Debt at the end of the year € 120,000 € 150,000 € 180,000 FREE CASH FLOW TO EQUITY € -580,552 € -1,248,223 € 438,214 Raise or repayment of equity € 0 € 0 € 0 Free cash flow € -580,552 € -1,248,223 € 438,214 Beginning of the year cash € 570,000 € -10,552 € -1,258,775 End of the year cash € -10,552 € -1,258,775 € -820,561 Cash is the king The cash flows are estimated by Equidam starting from the user's data. This is to provide the reader with a more reliable estimation based upon industry peers benchmarks rather than leaving the user the freedom to guess the estimates. Both Depreciation and Amortization and Working Capital are based on the Equidam industry databases, while the change in Debt and in Equity and the investment outlays are based upon the user's projections. Page 13 Copyright Equidam 2019
  • 14. Powered by APPENDIX SCORECARD METHOD CRITERIA DESCRIPTION Time commitment of the founders Number of employees Team spirit and comradeship Years of industry experience of the core team Business and managerial background of the core team Technical skills of the core team Estimated revenues in the third year according to the stage of the development Estimated size of the market in three years Geographical scope of the business Stage of the product/service roll-out Degree of loyalty of customers Type of IP protection applicable IP protection in place (if any) Level of competition in the market Quality of competitive products/services Competitive advantage over other products/services Barriers to entry to the market Threat of international competition Strength of the relationships with key strategic partners Capital required according to the stage of development Page 14 Copyright Equidam 2019 Strength of the team analyzes: Size the opportunity analyzes: Strength and protection of the product/service analyzes: Competitive environment analyzes: Strategic relationships with partners analyzes: Funding required includes:
  • 15. Powered by APPENDIX CHECK-LIST METHOD CRITERIA DESCRIPTION Average age of the founders Presence in the team of serial, successful entrepreneurs Time commitment of the founders Team spirit and comradeship Years of industry experience of the core team Business and managerial background of the core team Technical skills of the core team Validation of the demand for the product/service Feedback received by early adopters/industry experts Level of competition in the market Competitive advantage over other products/services Geographical scope of the business Threat of international competition Degree of loyalty of customers Stage of the product/service roll-out Type of IP protection applicable IP protection in place (if any) Presence of an advisory board and number of advisors Presence and type of current shareholders Relationship with legal counselors Strength of the relationships with key strategic partners Stage of development Current profitability Page 15 Copyright Equidam 2019 Quality of the core team analyzes: Quality of the idea analyzes: Product roll-out and IP protection analyzes: Strategic relationships analyzes: Operating stage
  • 16. About this report This report was generated automatically using the Equidam Valuation Platform. Equidam is the easy way to compute and generate valuation reports. To get a similar report for your company or other companies please visit .www.equidam.com Important legal notes Equidam BV does not represent or endorse the accuracy or reliability of any advice, opinion, statement or any other information displayed or distributed through this report or its website. The estimates and the data contained herein are made using the information provided by the user, publicly available information and data for different industries. Equidam BV has not audited or attempted to confirm this information for accuracy or completeness. Under no circumstances the present report is to be used or considered as an offer, solicitation, or recommendation to sell, or a solicitation of any offer to buy any security. Equidam BV excludes any warranties and responsibilities concerning the results to be obtained from the present report nor their use and shall not be liable for any claims, losses or damages arising from or occasioned by any inaccuracy, error, delay, or omission, or from use of the report or actions taken in reliance on the information contained in it. The use of this report and the information provided herein is subject to Equidam BV online Terms of Use and Privacy Policy.