Data science in demand planning - when the machine is not enough

A presentation by Calven van der Byl BCom Economics and Statistics, BCom Honours Mathematical Statistics, Masters Mathematical Statistics, Inventory Optimization Demand Planning Manager, DSV, South Africa. Delivered during SAPICS 2016, a leading event for supply chain professionals, held in Sun City, South Africa. Demand Planning is a complex, yet often de-emphasized function in the supply chain planning function. The demand planning function is often characterized by an over-reliance on off the shelf software as well as a great deal of manual intervention. This presentation will outline the current developments and perspective in big data analytics and how they can be leveraged with the demand planning function to improve forecasting agility and efficiency. A simulation study will be presented in order to illustrate these principles in practice.

Recommended
Recommended
More Related Content
What's hot
What's hot (20)
Similar to Data science in demand planning - when the machine is not enough
Similar to Data science in demand planning - when the machine is not enough (20)
More from Tristan Wiggill
More from Tristan Wiggill (20)
Recently uploaded
Recently uploaded (20)
Data science in demand planning - when the machine is not enough
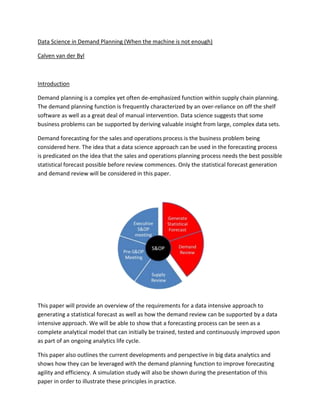
- 1. Data Science in Demand Planning (When the machine is not enough) Calven van der Byl Introduction Demand planning is a complex yet often de-emphasized function within supply chain planning. The demand planning function is frequently characterized by an over-reliance on off the shelf software as well as a great deal of manual intervention. Data science suggests that some business problems can be supported by deriving valuable insight from large, complex data sets. Demand forecasting for the sales and operations process is the business problem being considered here. The idea that a data science approach can be used in the forecasting process is predicated on the idea that the sales and operations planning process needs the best possible statistical forecast possible before review commences. Only the statistical forecast generation and demand review will be considered in this paper. This paper will provide an overview of the requirements for a data intensive approach to generating a statistical forecast as well as how the demand review can be supported by a data intensive approach. We will be able to show that a forecasting process can be seen as a complete analytical model that can initially be trained, tested and continuously improved upon as part of an ongoing analytics life cycle. This paper also outlines the current developments and perspective in big data analytics and shows how they can be leveraged with the demand planning function to improve forecasting agility and efficiency. A simulation study will also be shown during the presentation of this paper in order to illustrate these principles in practice.
- 2. Big Data in Forecasting Demand Organizations are now widely dependent on software systems. Large amounts of business data are routinely created by business software. The demand forecasting process is no different. The table below shows how the data required for the demand planning process can easily be seen as big data using the four V’s of big data. If any data that forms part of the demand planning process exhibits any of these characteristics, alternative data approaches should be considered. Common Forecasting Process A common forecasting process set up within an organization usually involves the use of the forecasting module from an MRP system and Excel. 4 V's of Big Data Velocity • Daily forecasting of SKU's required to maintain the forecast plan Veracity • Stock take uncertainty • Stock outs • Business process controls the interpretation of the data Variety • Demand history • Daily stock on hand • Customer master data Volume • Customer level sales history • Point of sales history
- 3. This process may require a fair amount of manual intervention from a demand planner. If each item in a portfolio requires a lengthy amount of consideration, this forecasting process would require at least one demand planner per 200 SKU’s. This forecasting process can mean a heavy reliance on the forecasts generated by a forecasting module with very little flexibility in selecting the forecasting models that get applied. Data Science Data science is the practice of deriving meaningful insight from data in order to drive value in an organization. The skill sets required are multi-faceted for a data scientist. A data scientist is required to understand the business problem, be capable of extracting the relevant data and designing the analytics methods that need to be used. Demand planning is characterized by predictive analytics. MRP Forecast DP extracts report from MRP DP manual checks DP reports created Forecast Review Business Understanding •Asking the right questions •Identifying the business Opportunity Technology •Data Architecture •Calculation efficiency •Deployment into production Math and Statistics •Understanding the algorithms and models used •Identifying the appropriate methods
- 4. Predictive analytics is characterized by assumptions and theory about the data being analyzed. The forecasting process is no different, the results of which should be continuously assessed for accuracy, credibility and reliability. The following questions are asked of the forecasting process: How large will prediction errors be? What is the bias to be expected from the forecast process? How long does it take to run a forecast? These are very difficult questions to answer in the absence of a formalized and automated forecasting process that is monitored by a technically capable specialist. Five years of sales history data is used to train the forecasting process. Use three years to train the data set and get results for year four. The results are then validated by running a hold out for year 5 to validate the results in training. The idea is to fairly represent the real world forecasting process as closely as possible. This can be formalized and automated by applying the six phases of the analytics life cycle to the forecasting process. Six Phases of the Analytics Life Cycle The analytics life cycle is a formal framework of the steps covering the investigation, management and deployment of analytics into a business process. The 6 phases are shown below. Discovery entails the formulation of the business problem as well as understanding if data is available to support the analytics project. Discovery Data Preparation Model Planning Model Building Communicate Results Deploy to Production
- 5. Data preparation requires the ability to extract the data required from the production system as well as the tools needed to transform data into a workable condition. This will often entail data cleansing. Model planning consists of exploratory analysis as well as determining the possible set of methods and workflows that will be followed during the next phase. Model building requires the execution of the analytics models defined in the planning phase. The performance of the models is assessed in terms of resources required to execute as well the appropriateness of the model results. Results are communicated in order to assess if the analytics models answer business questions formulated in discovery. Production deployment involves the construction and implementation of the recommended models into the production environment. Application to Demand Planning The monthly demand forecasting process can be seen as a complete model that can be built and calibrated within the analytics life cycle framework. • Discovery: Identify forecast level. Could be different to data available (Customer level vs Item level). What KPI’s are going to be used? WAPE, APE, Error etc. Typically required when setting up a forecasting process but needs to be re-visited. • Data Conditioning: Identify data sources and the reports required to perform the monthly forecast, e.g. SAP report, SQL extract, ODBC. The methods to be used to Discovery Data Conditioning Model Planning (Segementation) Model Building (Execution) Communicate Results Deploy to Production
- 6. condition data into a desired, workable format will need to be defined. Data is edited and re-formatted so that it can be used in analysis. • Model Planning (Segmentation): Software to be used to generate the statistical forecast. This should be preferably separate from the software environment that does the actual MRP calculation. A forecast using solely the forecasting module or forecast software is created. Rules based exception management is created in order to direct forecasting models to the most appropriate SKU segments. • Model Building (Execution): Custom models and methods are applied to the SKU segments in the segmentation phase. Any items not flagged for segmentation are to keep the initial software forecast. • Communicate Results: The statistical forecast is presented to the relevant stakeholders as part of a demand forecast review before consideration in the rest of the S&OP process. Recommendations about new data and desired forecasts are received. • Deploy to production: It is then the responsibility of the forecaster to translate the input from the demand review into clear mathematical statements that can be taken back to the discovery, data conditioning and model planning phases. Three Tiers of Forecasting This entire process requires the appropriate tools needed to set up a workflow and turn business knowledge into mathematical statements. This can be described in terms of the three tiers of forecasting required by a forecasting process. This will require the technology needed to store data, a sufficient analytics tool to translate business requirements into mathematical statements and presentation software in order to show results.
- 7. Analytics Life Cycle in Action The advantage of defining the forecasting process in this way is that it lends itself to an analytical framework that can be automated for testing and training of an entire demand forecasting process. The graph below shows • BI software: TableauPresentation • Analytical tool: R • Forecasting software: Forecast Pro Application and Logic • Data store: SQL • Data access: ODBC Data
- 8. Summary A few important points can be concluded: Focus has been on the forecasting portion of the S&OP process. Big data complexity suggests that an alternative analytics approach would be required. Manually driven forecasting can benefit from a data science approach. Three tiers of forecasting require specialist analytics software for presentation, custom logic and quick data access. The forecast process can be seen as an analytics model which can be trained, validated and automated. A data science approach to forecasting can support the S&OP process by allowing the forecaster full control over the implementation of business logic into the forecasting. There is huge potential for analytics to add value to the forecasting within an organization where a “black box” cannot.
- 9. About The Author Calven van der Byl is an Inventory Optimization Demand Planning Manager at UTi and leads a team of statistician demand planners within the SDi division of UTi. He is a data driven demand planner with a passion for extracting insight from data. He holds a BCom (Economics and Statistics), a BCom Honours (Mathematical Statistics) and a Masters (Mathematical Statistics) from the Nelson Mandela Metropolitan University UTi SDi currently provides an Inventory Optimization service to clients in the Pharmaceutical, Automotive, Chemical, Manufacturing and Retail industries. SDi Africa have also successfully completed projects with a number of high profile international companies across several industries and are the Inventory Optimization centre of excellence for UTi globally. Contact details Email address: cvanderbyl@go2uti.com Website: http://www.go2uti.com/inventory-optimization Telephone: 0415012612