Download as PDF, PPTX
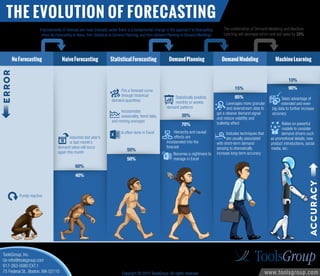

This document discusses different types of forecasting methods and their accuracy levels. Naive forecasting is the simplest but least accurate, assuming past demand will repeat. Statistical forecasting fits curves to historical data and incorporates seasonality and trends, improving accuracy. Demand planning further increases accuracy by using more granular downstream data and reducing effects that cause demand fluctuations. The most accurate methods are demand modeling and machine learning, which consider demand drivers and patterns from extended or big data, decreasing errors and lost sales by 33%.


![[DSC DACH 24] Reduce waste by state-of-the art Demand Forecasting using AI an...](https://cdn.slidesharecdn.com/ss_thumbnails/arminfanzott-240920110154-58f15cc7-thumbnail.jpg?width=640&height=640&fit=bounds)


![Lect 1 Number systems and base conversions. [Autosaved].pptx](https://cdn.slidesharecdn.com/ss_thumbnails/lect1numbersystemsandbaseconversions-260111134109-67c2d865-thumbnail.jpg?width=640&height=640&fit=bounds)


