More Related Content
Similar to Janney-State-Health-Oct-2014--New-York
Similar to Janney-State-Health-Oct-2014--New-York (20)
Janney-State-Health-Oct-2014--New-York
- 1. Municipal Bond Market Note
janney fixed income strategy
October 1, 2014
JANNEY MONTGOMERY SCOTT
www.janney.com
© 2014 Janney Montgomery Scott LLC
Member: NYSE, FINRA, SIPC
Municipal Market • Page 1
Tom Kozlik
Municipal Credit Analyst
215.665.4422
tkozlik@janney.com
See page 3 for important
information regarding
certifications, our ratings
system as well as other
disclaimers.
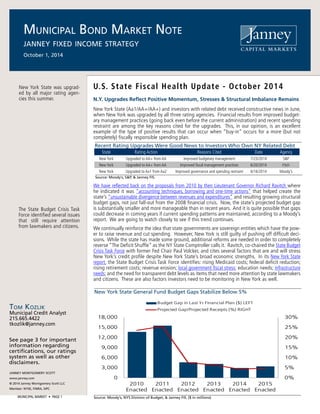
U.S. State Fiscal Health Update - October 2014
N.Y. Upgrades Reflect Positive Momentum, Stresses & Structural Imbalance Remains
New York State (Aa1/AA+/AA+) and investors with related debt received constructive news in June,
when New York was upgraded by all three rating agencies. Financial results from improved budget-
ary management practices (going back even before the current administration) and recent spending
restraint are among the key reasons cited for the upgrades. This, in our opinion, is an excellent
example of the type of positive results that can occur when “buy-in” occurs for a more (but not
completely) fiscally responsible spending plan.
We have reflected back on the proposals from 2010 by then Lieutenant Governor Richard Ravitch where
he indicated it was “accounting techniques, borrowing and one-time actions” that helped create the
state’s “unsustainable divergence between revenues and expenditures” and resulting growing structural
budget gaps, not just fall-out from the 2008 financial crisis. Now, the state’s projected budget gap
is substantially smaller and more manageable than in recent years. And it is quite possible that gaps
could decrease in coming years if current spending patterns are maintained, according to a Moody’s
report. We are going to watch closely to see if this trend continues.
We continually reinforce the idea that state governments are sovereign entities which have the pow-
er to raise revenue and cut spending. However, New York is still guilty of pushing off difficult deci-
sions. While the state has made some ground, additional reforms are needed in order to completely
reverse “The Deficit Shuffle” as the NY State Comptroller calls it. Ravitch, co-chaired the State Budget
Crisis Task Force with former Fed Chair Paul Volcker, and cites several factors that are and will stress
New York’s credit profile despite New York State’s broad economic strengths. In its New York State
report, the State Budget Crisis Task Force identifies: rising Medicaid costs; federal deficit reduction;
rising retirement costs; revenue erosion; local government fiscal stress; education needs; infrastructure
needs; and the need for transparent debt levels as items that need more attention by state lawmakers
and citizens. These are also factors investors need to be monitoring in New York as well.
New York State was upgrad-
ed by all major rating agen-
cies this summer.
The State Budget Crisis Task
Force identified several issues
that still require attention
from lawmakers and citizens.
New York State General Fund Budget Gaps Stabilize Below 5%
Source: Moody’s, NYS Division of Budget, & Janney FIS. ($ in millions)
0%
5%
10%
15%
20%
25%
30%
0
3,000
6,000
9,000
12,000
15,000
18,000
2010
Enacted
2011
Enacted
2012
Enacted
2013
Enacted
2014
Enacted
2015
Enacted
Budget Gap in Last Yr Financial Plan ($) LEFT
Projected Gap/Projected Receipts (%) RIGHT
Recent Rating Upgrades Were Good News to Investors Who Own NY Related Debt
State Rating Action Reasons Cited Date Agency
New York Upgraded to AA+ from AA Improved budgetary management 7/23/2014 S&P
New York Upgraded to AA+ from AA Improved fiscal management practices 6/20/2014 Fitch
New York Upgraded to Aa1 from Aa2 Improved governance and spending restraint 6/16/2014 Moody's
Source: Moody’s, S&P, & Janney FIS.
- 2. Municipal Bond Market Note
October 1, 2014
Municipal Market • Page 2
Janney U.S. State Fiscal Health Indicators
Source: Janney FIS and below. Federal Aid as a % of Revenue is per the Census Bureau. Medicaid % of Total Expenditures per National Association of State
Budget Officers Fall 2013 Expenditure Report. % Change in Tax Revenue is 2Q2013 to 2Q 2014 and per the Rockefeller Institute Sept 2014. NTSD to state
GDP is per Moody’s May 2014 State Debt Medians. State pension data from Moody’s Jan. 2014 report (data from FY12). Mortgage foreclosure & 90 days
past due data (non-SA) from the Mortgage Bankers Association 2Q 2014. Unemployment rate (SA) per the Bureau of Labor Statistics as of Aug 2014.
State Bond Ratings
Federal Aid as a
% of Total
Revenues
Medicaid as %
of Total
Expenditures
% Change in
Tax Collections
Net Tax-
Supported
Debt as % of
GSDP
Pension Liability
as a % of
GSDP
Mort Forecls.
"Seriously
Delinquent"
Unemploy.
Rate
Total/Average 35% 24% -1.7% 2.90% 8.8% 4.8% 6.1%
Alabama Aa1AA/AA+ 37% 24% -2.0% 2.30% 4.2% 4.6% 6.9%
Alaska Aaa/AAA/AAA 24% 14% -15.7% 2.20% 19.3% 1.8% 6.8%
Arizona* Aa3/AA-/NR 42% 32% -11.3% 2.20% 2.8% 2.3% 7.1%
Arkansas Aa1/AA/NR 36% 21% -5.0% 1.60% 7.7% 4.4% 6.3%
California Aa3/A/A 31% 25% 1.9% 4.70% 5.8% 2.7% 7.4%
Colorado* Aa1/AA/NR 29% 22% 1.2% 1.00% 7.9% 2.1% 5.1%
Connecticut Aa3/AA/AA 28% 22% -7.7% 8.60% 25.1% 6.6% 6.6%
Delaware Aaa/AAA/AAA 24% 17% 4.5% 3.50% 8.7% 5.8% 6.5%
Florida Aa1/AAA/AAA 36% 30% 1.6% 2.50% 2.8% 9.8% 6.3%
Georgia Aaa/AAA/AAA 40% 22% 3.9% 2.50% 2.9% 4.4% 8.1%
Hawaii Aa2/AA/AA 29% 14% -5.4% 9.20% 22.7% 5.3% 4.3%
Idaho* Aa1/AA+/AA 38% 27% -0.9% 1.40% 3.9% 2.6% 4.7%
Illinois A3/A-/A- 32% 25% -5.3% 4.80% 26.9% 6.3% 6.7%
Indiana* Aaa/AAA/AA+ 34% 32% -2.3% 1.20% 6.7% 5.2% 5.8%
Iowa* Aaa/AAA/AAA 38% 19% -14.4% 0.60% 2.6% 3.0% 4.5%
Kansas* Aa2/AA/NR 32% 20% -21.9% 2.30% 12.0% 3.4% 4.9%
Kentucky* Aa2/AA-/A+ 38% 22% 0.4% 5.20% 23.9% 4.6% 7.1%
Louisiana Aa2/AA/AA 46% 25% -6.0% 2.80% 18.8% 4.8% 5.8%
Maine Aa2/AA/AA 39% 32% -3.4% 2.40% 18.7% 7.0% 5.6%
Maryland Aaa/AAA/AAA 33% 21% -1.6% 3.30% 15.3% 6.4% 6.4%
Massachusetts Aa1/AA+/AA+ 31% 21% 0.7% 8.30% 15.5% 5.4% 5.8%
Michigan Aa2/AA-/AA 36% 26% -7.2% 1.90% 3.7% 3.5% 7.4%
Minnesota Aa1/AA+/AA+ 29% 23% 4.7% 2.60% 3.8% 2.3% 4.3%
Mississippi Aa2/AA/AA+ 49% 26% 2.1% 5.10% 12.9% 5.6% 7.9%
Missouri Aaa/AAA/AAA 43% 36% -1.8% 1.60% 4.2% 3.3% 6.3%
Montana Aa1/AA/AA+ 42% 18% -0.5% 0.70% 12.5% 1.9% 4.7%
Nebraska* Aa2/AAA/NR 36% 18% -8.6% 0.00% 0.9% 2.4% 3.6%
Nevada Aa2/AA/AA+ 25% 22% 4.1% 1.30% 3.3% 6.8% 7.6%
New Hampshire Aa1/AA/AA+ 31% 26% -1.7% 1.80% 4.2% 3.3% 4.4%
New Jersey A1/A/A 27% 20% -4.4% 7.00% 11.5% 11.6% 6.6%
New Mexico Aaa/AA+/NR 42% 25% ND 3.10% 10.4% 4.8% 6.7%
New York Aa1/AA+/AA+ 36% 29% -3.7% 5.20% 1.8% 8.8% 6.4%
North Carolina Aaa/AAA/AAA 34% 24% -9.7% 1.70% 2.9% 3.7% 6.8%
North Dakota* Aa1/AAA/NR 25% 13% -4.4% 0.40% 9.2% 1.2% 2.8%
Ohio Aa1/AA+/AA+ 38% 25% -13.4% 2.50% 3.1% 5.5% 5.7%
Oklahoma Aa2/AA+/AA+ 38% 24% 0.7% 1.30% 9.7% 4.5% 4.7%
Oregon Aa1/AA+/AA+ 36% 21% 8.1% 3.80% 6.3% 4.5% 7.2%
Pennsylvania Aa3/AA-/AA- 34% 34% -0.8% 2.50% 11.1% 5.5% 5.8%
Rhode Island Aa2/AA/AA 38% 24% 2.7% 4.30% 9.2% 6.3% 7.7%
South Carolina Aaa/AA+/AAA 36% 22% 0.8% 2.00% 5.3% 4.6% 6.4%
South Dakota* Aa2/AA+/AA 45% 20% -2.8% 0.80% 4.0% 1.8% 3.6%
Tennessee Aaa/AA+/AAA 44% 30% -0.5% 0.80% 2.1% 4.1% 7.4%
Texas Aaa/AAA/AAA 39% 30% 7.7% 1.20% 9.5% 3.1% 5.3%
Utah Aaa/AAA/AAA 32% 17% -2.4% 2.60% 2.8% 2.8% 3.6%
Vermont Aaa/AA+/AAA 36% 28% 3.7% 2.00% 14.6% 4.7% 4.1%
Virginia Aaa/AAA/AAA 26% 17% -3.2% 2.40% 2.2% 2.7% 5.6%
Washington Aa1/AA+/AA+ 30% 14% 4.4% 5.40% 2.3% 4.1% 5.6%
West Virginia Aa1/AA/AA+ 37% 13% 2.6% 2.80% 15.6% 3.1% 6.6%
Wisconsin Aa2/AA/AA 32% 17% -12.0% 4.10% 1.4% 3.7% 5.6%
Wyoming* NR/AAA/NR 36% 7% ND 0.10% 7.7% 1.6% 4.6%
- 3. Municipal Bond Market Note
October 1, 2014
JANNEY MONTGOMERY SCOTT
www.janney.com
© 2014 Janney Montgomery Scott LLC
Member: NYSE, FINRA, SIPC
Municipal MArket • Page 3
Analyst Certification
I,Tom Kozlik, the Primarily Responsible Analyst for this report, hereby certify that all of the views expressed in this report accurately
reflect my personal views about any and all of the subject sectors, industries, securities, and issuers. No part of my compensation
was, is, or will be, directly or indirectly, related to the specific recommendations or views expressed in this research report.
Definition of Outlooks- Positive: Janney FIS believes there are apparent factors which point towards improving issuer or
sector credit quality which may result in potential credit ratings upgrades. Stable: Janney FIS believes there are factors which point
towards stable issuer or sector credit quality which are unlikely to result in either potential credit ratings upgrades or downgrades.
Cautious: Janney FIS believes there are factors which introduce the potential for declines in issuer or sector credit quality that may
result in potential credit ratings downgrades. Negative: Janney FIS believes there are factors which point towards weakening in
issuer credit quality that will likely result in credit ratings downgrades.
Definition of Ratings- Overweight: Janney FIS expects the target asset class or sector to outperform the comparable
benchmark (below) in its asset class in terms of total return. Marketweight: Janney FIS expects the target asset class or sector to
perform in line with the comparable benchmark (below) in its asset class in terms of total return Underweight: Janney FIS expects
the target asset class or sector to underperform the comparable benchmark (below) in its asset class in terms of total return
Benchmarks- Asset Classes: Janney FIS ratings for domestic fixed income asset classes including Treasuries, Agencies,
Mortgages, Investment Grade Credit, High Yield Credit, and Municipals employ the “Barclay’s U.S.Aggregate Bond Market Index”
as a benchmark. Treasuries: Janney FIS ratings employ the “Barclay’s U.S. Treasury Index” as a benchmark. Agencies: Janney FIS
ratings employ the “Barclay’s U.S. Agency Index” as a benchmark. Mortgages: Janney FIS ratings employ the “Barclay’s U.S. MBS
Index” as a benchmark. Investment Grade Credit: Janney FIS ratings employ the “Barclay’s U.S. Credit Index” as a benchmark.
High Yield Credit: Janney FIS ratings for employ “Barclay’s U.S. Corporate High Yield Index” as a benchmark. Municipals: Janney
FIS ratings employ the “Barclay’s Municipal Bond Index” as a benchmark.
Disclaimer- Janney or its affiliates may from time to time have a proprietary position in the various debt obligations of the
issuers mentioned in this publication. Unless otherwise noted, market data is from Bloomberg, Barclays, and Janney Fixed Income
Strategy & Research (Janney FIS). This report is the intellectual property of Janney Montgomery Scott LLC (Janney) and may not
be reproduced, distributed, or published by any person for any purpose without Janney’s express prior written consent.This report
has been prepared by Janney and is to be used for informational purposes only. In no event should it be construed as a solicitation
or offer to purchase or sell a security. The information presented herein is taken from sources believed to be reliable, but is not
guaranteed by Janney as to accuracy or completeness. Any issue named or rates mentioned are used for illustrative purposes only,
and may not represent the specific features or securities available at a given time. Preliminary Official Statements, Final Official
Statements, or Prospectuses for any new issues mentioned herein are available upon request. The value of and income from
investments may vary because of changes in interest rates, foreign exchange rates, securities prices, market indexes, as well as
operational or financial conditions of issuers or other factors. Past performance is not necessarily a guide to future performance.
Estimates of future performance are based on assumptions that may not be realized. We have no obligation to tell you when
opinions or information contained in Janney FIS publications change. Janney Fixed Income Strategy does not provide individually
tailored investment advice and this document has been prepared without regard to the circumstances and objectives of those
who receive it. The appropriateness of an investment or strategy will depend on an investor’s circumstances and objectives. For
investment advice specific to your individual situation, or for additional information on this or other topics, please contact your
Janney Financial Consultant and/or your tax or legal advisor.