2. AN EVALUATION OF COMMERCIAL TEXTILE TANNINS 53
The objective of this study is to comparatively evaluate commonly applied textile tannins in terms of
their inert COD content and toxicity towards marine bacteria Vibrio fischeri. All the assessments are
performed on simulated textile bath effluents where the tannin formulations are added.
MATERIALS AND METHODS
Tannins under investigation
Physicochemical and ecotoxicological characteristics of tannin formulations as obtained from
material safety datasheets (MSDS) are tabulated in Table 1.
Table 1. Characteristics of tannin formulations
Property Tannin 1 Tannin 2
Appearance Brownish liquid with smell of ammonia Yellowish-brownish clear viscous liquid
Ingredients
A methylene linked condensation product
of arylsulphonic acids and
hydroxyarylsulphone
Sulfonated phenol polymer with
formaldehyde, 1-methoxy-2-propanol
and phenol
Density (g cm
-3
) 1.2 at 23 °C 1.17
pH 8 – 9 at 23 °C (in 100 g l
-1
water) 2.5 – 3.5 (in 100 g l
-1
water)
Solubility Miscible Soluble in cold water
Viscosity (mPa s) <100 at 23
o
C 2500
Acute oral toxicity
(LD50*, mg kg
-1
)
>5000 >2000
Fish toxicity
(LC50**, mg l
-1
)
>1 – 10 (Test duration, 48 h) 1 – 10 (Test duration, 96 h)
Toxicity
(LC50***, mg l
-1
)
ND 1 – 10 (Test duration, 48 h)
* Lethal dose causing 50 % death in rats;
**Lethal concentration of pollutant causing 50% death of the studied test organism, Leuciscus idus.
***Effective concentration of pollutant causing 50% inhibiton of studied test organism, Daphnia magna.
ND: not detected
The same chemical or wastewater can exert different levels of toxicity towards different organisms.
Although both of the tannin formulations have low acute oral toxicities, when evaluated in
combination with the typical concentrations encountered in spent textile baths, the values tabulated
for acute fish toxicity can be considered as potentials of toxicity for the formulations. Table 1
presents aquatic toxicities of the tannin formulations on two organisms; namely Leuciscus idus as a
fish specie and water flea Daphnia magna as a crustacean specie. By performing toxicity tests on
Vibrio fischeri bacteria, this study adds new data to literature. Fish, bacteria and crustaceans
represent different tropic levels. A sound evaluation of substitutable chemicals can only be realized
when complementary toxicity data on fish, bacteria and crustaceans are uploaded to an ecosystem
model (Heinlaan et al., 2008).
Samples used
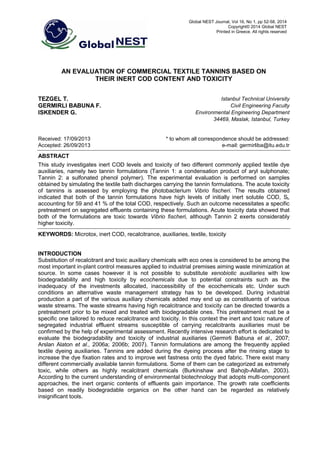
As given in Figure 1 the tannin formulations are added to the textile baths during dye fixation stage
where pre-treated textile material is processed at 70 °C at a pH of 4 for about 20 minutes. Both of
the tannin formulations are applied at a concentration of 4 g l-1
to the textile baths (i.e. 4 % of fabric
weight) and, approximately, 25 % of the formulations remain unfixed in the exhausted textile bath.
Therefore spent textile baths (where tannin formulations are added) are simulated by dissolving 1
gram of formulations (both Tannin 1 and Tannin 2) in 1 litre water. pH adjustment is performed with
acetic acid addition for both of the tannin containing samples.
Assessment of inert COD
The inert COD content of samples, were assessed according to an experimental procedure given in
literature (Germirli et al., 1993). The method involves running two aerated cylindrical batch reactors,
one fed with the sample itself, and the other with glucose solution having the same dilution, of 3000
ml volumetric capacity. The seed was obtained from a lab-scale fill and draw aerobic reactor
operated under steady state with a food to microorganism ratio (F/M) of 0.7 mg COD (mg VSS day-1
)
for about 40 days. 100 ml of sludge was wasted from the reactor daily. A mixture of 50% glucose
and 50% sample was applied as the feed for this fill and draw aerobic reactor used to obtain the
3. 54 TEZGEL et al.
seed. Then initial biomass concentrations of 50 mg l-1
VSS were sustained in two batch reactors (run
with sample and with glucose) where inert COD tests were performed to hinder the interference of
the residual COD that can form from the endogenous respiration of initial inoculums. By adopting
such a low sludge concentration in these reactors the adsorption of biomass as a mechanism for the
removal of organic matter was neglected. Aliquots removed periodically from the mixed liquor of
each reactor were analyzed for soluble COD. Experiments were continued and data were collected
until the observation of a stable soluble COD plateau where the threshold level was established as
less than 3-5 % variation between consecutive samples. In the batch tests the samples were
adjusted to a pH of 7-8, a range suitable for biological activity. Nitrification inhibitor (Formula
2533TM, Hach Company) was added to all bioreactors in order to avoid possible interferences.
Figure 1. Process flowchart
Assessment of toxicity
In this study, toxicity experiments are carried out with bioluminescence marine bacteria Vibrio
fischeri by BO1243-500 BioToxTM
Kit. The inhibitory effect of the sample on the light emission of
luminescent bacteria is measured with luminometer. The inhibition percentage (% INH) is calculated
according to the formula given below.
H 100 [(
t
0
)] 100
where;
KF = Correction factor, (
Ct
C0
)
ICt = Luminescence intensity of control after contact time, t
IC0 = Initial luminescence intensity of control
ITt = Luminescence intensity of test sample after contact time, t
IT0 = Initial luminescence intensity of test sample
The inhibition percentages (% INH) versus dilution factor plots are used to calculate effective
concentrations causing different percentages of inhibition, i.e. EC20, EC50 and EC80. Toxicity
measurements are carried out at 15 and 30 minutes contact times.
Analytical procedure
Apart from COD, all analyses for conventional characterization and tannic acid measurements were
performed as defined in Standard Methods (APHA, AWWA and WPCF, 1998). COD measurements
were accomplished by ISO 6060 method (ISO, 1986). All experiments were conducted at room
temperature. pH adjustments were made by NaOH or H2SO4 solutions. Filtrates of samples
subjected to vacuum filtration by means of Millipore membrane filters with a pore size of 0.45 µm are
Pretreated
textile Dyeing
Dye
Fixation
Product
70 °C
pH 4.0;
20 minutes
Tannin (4% of textile)
100 kg dyed textile 1 m
3
water
Product
Wastewater
Finishing
4. AN EVALUATION OF COMMERCIAL TEXTILE TANNINS 55
defined as soluble fractions. Each data point was calculated as the mean of three replicate
measurements.
RESULTS AND DISCUSSION
Inert COD levels
According to the outcomes of the inert COD tests outlined in Table 2; 75 % and 77 % tannic acid
removals are obtained for Tannin 1 and Tannin 2 respectively.
Table 2. Results of the inert COD experiments for Tannin 1 and Tannin 2 (mg l-1
)
Reactor I
fed with wastewater
Reactor II
fed with glucose
Soluble COD Tannic Acid Soluble COD Tannic Acid
TANNIN 1
Start of the experiment 1050 65 905 -
End of the experiment 630 16 30 -
Duration (days) 100 100
TANNIN 2
Start of the experiment 1200 245 860 -
End of the experiment 515 57 35 -
Duration (days) 90 90
The total COD, CT, of wastewaters can be grouped into of two main fractions: The inert COD, and
the biodegradable COD. The outlet of a properly designed and well operated biological treatment
system does not contain any biodegradable COD fractions due to the fact that all the biodegradable
organics will be removed within the treatment plant. Particulate inert COD fractions leave the
treatment facility by sludge wastage. The soluble inert COD of the wastewaters, SI, gains importance
as it by-passes the biological treatment system without being involved in the biochemical reactions.
On the other hand soluble residual microbial products, SP, are generated through the course of
biochemical reactions during biodegradation. Soluble residual (inert) microbial products, SP, and the
inert COD of influent origin, SI, together control the magnitude of effluent soluble COD level obtained
at the outlet of a biological treatment plant. In other words, the effluent soluble COD of a properly
designed and well operated biological treatment plant is composed of SP+SI, which has to be lower
than the discharge standards. Total and residual COD contents of segregated textile-bath discharges
carrying tannin formulations are outlined in Table 3.
Table 3. Characteristics of segregated dye-bath discharges carrying various textile tannins
Textile Auxiliary
Total COD
CT (mg l
-1
)
Initially Inert
Soluble COD
SI (mg l
-1
)
Residual COD*
SI+SP
(mg l
-1
)
SI/CT
(%)
Reference
Natural Tannin 1100 25 100 2 Germirli et al., 2007
Synthetic Tannin 465 135 190 29 Germirli et al., 2007
Tannin 1 1050 620 630 59 This study
Tannin 2 1200 490 515 41 This study
* at the outlet of a well operated biological treatment facility
The total COD contents (CT) given in table indicates the application of synthetic tannin as the most
favourable outcome since a lower COD is introduced to the segregated textile-bath discharge in this
case. Natural Tannin, Tannin 1 and Tannin 2 formulations yield similar total COD values ranging
from 1050 mg l-1
to 1200 mg l-1
. It must be noted that such an evaluation based on solely total COD
levels will not lead a sound result. A correct conclusion can be drawn from the data on initially inert
soluble COD and residual COD levels. Although Natural Tannin formulation imparted one of the
highest total COD level, i.e. 1100 mg l-1
, only 2 % of this organic input yielding 25 mg l-1
COD can be
considered as initially inert (Germirli et al., 2007). Therefore the segregated wastewater stream
containing natural tannin did not necessitate any pretreatment to improve its biodegradability
(Germirli et al., 2007). Both of Tannin 1 and Tannin 2 formulations on the other hand, are observed
5. 56 TEZGEL et al.
to contain high levels of initially inert soluble COD, SI, accounting for 59 and 41 % of the total COD,
respectively. The mentioned high SI values associated with Tannin 1 and Tannin 2 indicate the
requirement of a specific pretreatment on segregated effluents containing these formulations. When
the textile-bath discharges containing the tannin formulations are comparatively evaluated in terms
of the lowest achievable COD levels after biotreatment, again natural tannin, with a residual COD of
100 mg l-1
, is monitored to yield the best outcome. The results obtained on Tannin 1 and Tannin 2
show that these formulations have around 630 mg l-1
and 515 mg l-1
of residual COD, respectively.
Toxicity
The results of toxicity tests performed with marine bacteria Vibrio fischeri are plotted on Figure 2 and
Figure 3.
Figure 2. Plots of toxicity tests for Tannin 1 at a) 15 and b) 30 minutes contact time
Effective concentrations causing different percentages of inhibition, i.e. EC20, EC50 and EC80 for both
of the tannin formulations are tabulated in Table 4.
Table 4. Effective concentrations causing different percentages of inhibition (mg tannin l-1
)
Contact Time→ 15 minutes 30 minutes
Test Substance↓ EC20 EC50 EC80 EC20 EC50 EC80
Tannin1 80 260 850 110 265 650
Tannin 2 16 50 155 24 63 170
According to the values presented in the table segregated effluents containing both of the tannin
formulation can be considered as highly toxic as both of them contain 1000 mg of tannin formulation
per litre. Tannin 2 is observed to exert considerably high toxicity when compared with Tannin 1.
6. AN EVALUATION OF COMMERCIAL TEXTILE TANNINS 57
Figure 3. Plots of toxicity tests for Tannin 2 at a) 15 and b) 30 minutes contact time
CONCLUSIONS
A comparative evaluation covering inert COD contents and toxicities towards marine bacteria Vibrio
fischeri, performed on two commonly applied textile tannins is presented in this study.
Textile baths containing both of Tannin 1 and Tannin 2 formulations are monitored to have high
levels of initially inert soluble COD, SI, accounting for 59 and 41 % of the total COD, respectively.
These high levels of recalcitrance together with the lowest achievable COD values after biotreatment
(accounting 630 mg l-1
and 515 mg l-1
of residual COD for Tannin 1 and Tannin 2, respectively)
indicate the requirement of a specific pretreatment on segregated effluents containing these
formulations.
Segregated textile baths containing both of the tannin formulations can be considered as toxic
towards marine bacteria Vibrio fischeri. Tannin 2 is determined to exert considerably higher toxicity
than Tannin 1.
ACKNOWLEDGEMENTS
This study was supported by The Research and Development Fund of Istanbul Technical University.
REFERENCES
APHA, AWWA and WPCF, 1998. Standard Methods for the Examination of Water and Wastewater,
American Public Health Association, Washington, DC. 20
th
Edition.
Arslan Alaton I., Iskender G., Ozerkan,B., Germirli Babuna F. and Okay O. (2007), Effect of Chemical
reatment on the Acute oxicity of wo Commercial extile Dye Carriers’, Water Science and
Technology, 55(10), 253-260.
Arslan Alaton I., Okay S.O., Eremektar G. and Germirli Babuna F. (2006a), Toxicity Assessment of Raw
and Ozonated Textile Biocides, International Magazine for Textile Design Processing and Testing
AATCC Review, 6(5), 43-48.
7. 58 TEZGEL et al.
Arslan-Alaton I., Insel G., Eremektar G., Germirli Babuna F. and Orhon D. (2006b), Effect of Textile
Auxiliaries on the Biodegradation of Dyehouse Effluent in Activated Sludge, Chemosphere, 62(9),
1549-1557.
Burkinshaw S. M. and Bahojb-Allafan B. (2003), The development of a metal-free, tannic acid-based after
treatment for nylon 6,6 dyed with acid dyes-part1: Initial studies, Dyes and Pigments, 58, 205-218.
Germirli Babuna F., Yilmaz Z., Okay O., Arslan Alaton I.and Iskender G. (2007), Ozonation of Synthetic
versus Natural Textile Tannins: Recalcitrance and Toxicity towards Phaeodactylum tricornutum,
Water Science and Technology, 55(10), 45-52.
Germirli F., Orhon D., Artan N., Ubay E. and Görgün E. (1993), Effect of two-stage treatment on the
biological treatability of strong industrial wastewaters, Water Science and Technology,
28(2), 145-152.
Heinlaan M., Ivask A., Blinova I., Dubourguier H.C. and Kahru A. (2008), Toxicity of nanosized and bulk
ZnO, CuO and TiO2 to bactreria Vibrio fischeri and crustaceans Daphnia magna and
Thamnocephalus platyurus, Chemosphere, 71(7), 1308-1316.
ISO (1986). Water Quality - Determination of the Chemical Oxygen Demand, Ref. No. ISO 6060-1986.