Fundamental Analysis of The Goodyear Tire & Rubber Company (NASDAQ - GT) - Toan Le
1. Intern: Toan Duc Le Nov 28th, 2014
Supervisor: Robert Donlan Donlan and Barcomb Investment Services
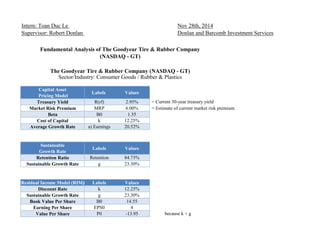
Capital Asset
Pricing Model
Labels Values
Treasury Yield R(rf) 2.95%
Market Risk Premium MRP 6.00% = Estimate of current market risk premium
Beta B0 1.55
Cost of Capital k 12.25%
Average Growth Rate a) Earnings 20.52%
Sustainable
Growth Rate
Labels Values
Retention Ratio Retention 84.73%
Sustainable Growth Rate g 23.30%
Residual Income Model (RIM) Labels Values
Discount Rate k 12.25%
Sustainable Growth Rate g 23.30%
Book Value Per Share B0 14.55
Earning Per Share EPS0 4
Value Per Share P0 -13.95
Fundamental Analysis of The Goodyear Tire & Rubber Company
(NASDAQ - GT)
The Goodyear Tire & Rubber Company (NASDAQ - GT)
Sector/Industry: Consumer Goods / Rubber & Plastics
= Current 30-year treasury yield
because k < g
2. Free Cash Flow 2011 2012 2013
Beta equity 1.55 1.55 1.55
Debt/Equity 6.39 7.82 3.30
Tax Rate (t) 31.00% 26.20% 20.50%
Beta Asset 0.29 0.23 0.43
Adjusted k 4.67% 4.32% 5.52%
Net Income per share 2.08 1.98 2.93
Depreciation per share 2.92 2.80 2.91
Capital Spending per share 4.27 4.6 4.71
Firm's Equity -4.84 -1.16 -7.87
Market Ratio Valuation 2009 2010 2011 2012 2013 2014 (ETS) Column2
High 18.8 16.4 18.8 15.8 24
Low 3.2 9.1 8.5 9.2 11.8
Average 11 12.75 13.65 12.5 17.9
Earning per share 0.95 0.51 1.87 1.83 2.62 2.8
Cash Flow per share 1.67 3.2 4.94 4.66 5.73 5.55
Sales per share 67.3 77.75 93.1 85.6 78.87 69.1
Book Value per share 3.03 2.66 1.02 0.51 5.52 7.55
.
5-Year Historical
Average
Data from
Reuters
P/E 11.58 25.00 7.30 6.83 6.83 11.51 14.31
P/CF 6.59 3.98 2.76 2.68 3.12 3.83 5.49
P/S 0.16 0.16 0.15 0.15 0.23 0.17 0.41
P/BV 3.63 4.79 13.38 24.51 3.24 9.91 4.05
because k<g
3. 40.07 26.15 Not defined
30.47 8.85 Not defined
28.33 1.97 $ 40.07
30.58 1.29 $ 30.47
$ 28.33
$ 30.58
Current Price 27.41$
+ In conducting different valuation methods, I realize that there are
different price levels of GoodYear Tire company, all of which are higher
than the current price level, which is $27.41. The highest price level
indicator is from the Price-earning model, which is $40.07. The RIM and
Free Cash Flow do not provide an exact value due to unequal/ scattered
pattern of dividends payment. Other models show high instric value:
Price- Cash Flow ($30.47), Price-Sales ($28.33), Price-Book Value
($30.58). For that reason, I believe GoodYear Tire shares are underpriced
relatively to its intrinsic value. Though having little dividends, considering
potential capital gains from the stock in near future, I would recommend a
strong-buy for this stock to investors.
Price-Cash Flow
Price-Sales
Price-Book Value
Price
Estimates
Price Estimates based on
Industry Average
73.22
49.12
RIM
Free Cash Flow
Price-earning Model
Model Values
136.13
9.74
Industry
Average