
Recommended
Recommended
More Related Content
Similar to OSIsoft White Paper "Impacting the Bottom Line" in O&G
Similar to OSIsoft White Paper "Impacting the Bottom Line" in O&G (20)
Recently uploaded
Recently uploaded (20)
OSIsoft White Paper "Impacting the Bottom Line" in O&G
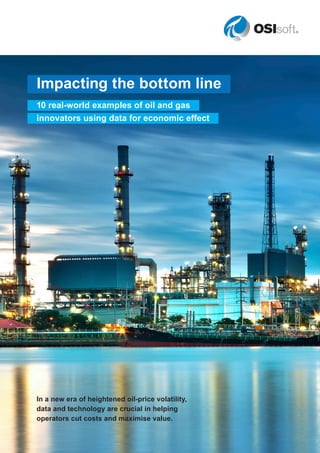
- 1. Impacting the bottom line 10 real-world examples of oil and gas innovators using data for economic effect In a new era of heightened oil-price volatility, data and technology are crucial in helping operators cut costs and maximise value.
- 2. 2 A s everybody in the oil industry knows, it’s battling against low crude prices, tougher regulations, alternative forms of fuel and power, and rising upstream costs. From China to Libya, operators in many of the major oil-producing nations are struggling to achieve breakeven costs of production and most analysts believe things will get worse before they get better. This is why many operators are sweating every last dollar of value from their physical infrastructure just to break even on the cost of production. But there’s only so much value which can be wrung out of physical assets and the smartest operators are turning to a new kind of infrastructure to face today’s and tomorrow’s challenges. It’s called data infrastructure. And it’s this technology which relays vital information from great depths, provides 24/7 monitoring of the condition of mission-critical equipment, monitors for safety issues and much else. But important as this information is, operators are drowning in fragmented, critical, time-series data pouring out of multiple and diverse systems that don’t talk to each other. The burning imperative now is how to harness all this vital information and convert it to data you can use. The OSIsoft PI System does this—and it’s been doing it for years. The PI System provides a platform that converts an ever-mounting deluge of data into a coherent whole that allows operators to save money, meet regulatory requirements and improve safety. Some E&P users of the PI System have cut barrels of oil equivalent per day (boe/d) costs by up to 2-5% while others have cut their controllable margin in logistics by 1-5%. In the hard-hit North Sea, some operators have halved average unit operating costs in the last two years, from $29.70 per barrel ($/b) to $15.30/b. In this paper you’ll find enlightening case studies of what PI System can do. Achieving more with less
- 3. 3 W hen the Polar Vortex hits the Midwest and Eastern Seaboard of America, dumping temperatures to 40F below, Columbia Pipeline (now part of TransCanada) is ready, despite its more than 15,000 miles of pipelines spanning 16 states from New York to the Gulf of Mexico. That’s because the TransCanada- owned group relies on enterprise analytics in the form of the PI System to keep the gas flowing to its domestic and industrial customers. As the company reports, the consequent gains in time, money and man-hours from a PI System-based enterprise analytics is considerable. The cost savings between 2006 and 2016 from the kind of preventive actions that are enabled by its data infrastructure reached a cumulative $10m. But, as Emily Rawlings, the group’s engineering manager of system reliability, acknowledged at the time of one of the biggest Polar Vortex events, the confidence that comes from being able to weather the storms goes far beyond the bottom line. “There are great intangible benefits”, she told a presentation. “The customer confidence [that was created] was huge.” And Columbia has endured the worst Polar Vortex events. In November 2014, before temperatures fell to the lowest levels since 1976, the group had installed the PI System which gathers, absorbs, processes and analyses data that enables engineers to monitor in split seconds the way the gas is flowing. As the hostile weather loomed, Columbia Pipeline had every reason to be concerned. As AccuWeather chief meteorologist Elliot Abrams forecast at the time, “the Arctic blast will have the greatest shock in the central states.” And yet there was no interruption to gas flows. How does enterprise analytics work? Essentially, it employs advanced digitised technology to extract data that companies such as Columbia Pipeline need to know. By harnessing and presenting the data in ways that allow operators to “see” into the efficient functioning of the entire system, enterprise Damage limitation
- 4. 4 analytics helps forestall blips in operations among other applications. As a result, the quality of decision-making is greatly enhanced as engineers can access a wider range of real-time information that enables them to respond to events, major and minor, with confidence. It’s all about certainty. As Chevron Pipe Line Company, another OSIsoft customer, puts it, enterprise analytics closes the gap between “I think” and “I know”. And when a company is producing more than 1.3m b/d of crude, refined products and chemicals through 4,100 miles of pipes, as Chevron Pipe Line Company does, it’s a lot more comforting to “know” rather than to “think”. Safeguards Enterprise analytics is about a lot more than protection against storms however. No oil and gas installation, whatever its nature, can run efficiently 100% of the time and, if problems occur, it’s important to know what has happened and why. In mid-2016, Columbia Pipeline engaged OSIsoft again to deliver a real-time system for “intelligent maintenance”. With a compression fleet grown to 1.2m horsepower, maintenance and operational efficiency had become paramount. Today, executives and front-line staff can see what’s happening on dashboards. More than 7,000 mission-critical streams of data are tapped to provide the big picture of the compression assets. Visibility has increased steadily to 98%. As Hungary’s MOL Group, another long-term PI System user, recognises, visibility is everything. The PI system has become a vital tool in the safe operation of its refineries that produce around 417,000 barrels a day. As the group’s head of process and automation, Tibor Comroczki, explains, in the event of a potentially dangerous malfunction the system dispatches operationally critical data about what happened and automatically logs it for subsequent analysis. As Comroczki points out, “it’s extremely important to have up- to-date information about the state of the safeguard system, which safety function was activated, when and why.” Over the years, the entire group has replaced its cumbersome paper-based reporting processes with PI’s electronic format until today the system is the backbone of MOL’s event management architecture. Eyes on the ground In the battle to lower production costs, all-round situational awareness is essential. And one of the breakthroughs in enterprise analytics is the ability it provides to visualise precisely what’s going on inside operations, however big and complex those operations are. $10m: Cumulative cost savings enabled by data infrastructure between 2006 and 2016
- 5. 5 Kongsberg Maritime Norway-based Kongsberg Maritime is a specialist in deep- sea exploration for the oil and gas industry. With 58 offices in 20 countries, it also provides services to 18,000 vessels. It’s a big and diverse company that’s been in business for 70 years and in all that time reliability has been Kongsberg’s watchword. The PI System is fundamental to the company’s historic goal. At the heart of Kongsberg’s operations is a purpose- designed information management system―the data infrastructure―that enables operational staff to see in real time what’s happening in its most critical functions around the world. For example, in its offshore drilling operations the PI System enables Kongsberg to monitor wellhead fatigue in real time. It maximises the operational efficiency of the drilling riser. And it adjusts work programs according to the weather, sometimes on a minute by minute basis. And that’s just a few of the virtues that the PI System brings to Kongsberg. Taking wellhead fatigue as an example, the PI System effectively provides a running commentary on its status by absorbing a mass of information from undersea sensors and transmiting the data to the control room. Similarly, in the case of Kongsberg’s sea-going fleet, the PI system constantly analyses for cylinder status, leakage in the piston rings and exhaust valves, and performance of the injection system among other vital functions. And because it’s of little use to be overloaded with data and not know what it all means, the system “visualises” the status of the engines and for good measure notifies the nature and pattern of any faults. In short, Kongsberg Maritime’s control room has a running prognosis of the state of engine components in much the same way that racing cars are monitored during an F1 grand prix. And it all shows up on a dash board that, to the trained eye, is as informationally friendly as the dials on a family saloon. This is the kind of coherently organised data that enables big savings. That’s why California’s Pacific Gas and Electricity opted for the PI System. With 43 miles of distribution and 4,500 remote terminal units (RTUs) continuously transmitting data to a central control system, it’s essential to get a system-wide picture of all operations. To give PG&E that picture, OSIoft came up with a video wall. Tools such as video walls constitute one of the most valuable advances in the technology of exploration and production because they provide actionable knowledge, stuff operators need to know. In PG&E’s case, the video wall was installed in the gas distribution control centre where it converts a non-stop avalanche of data into valuable insights. For instance, operators can see at a glance how well the compressors are operating and issue instructions in the confidence that the data on which they’re basing decisions is accurate. This is situational awareness. Because they can see pretty much everything that’s going on, operators can fix things before they cause problems. With 43 miles of distribution and 4,500 remote terminal units continuously transmitting data, it’s essential to get a system-wide picture of operations
- 6. 6 W hen Tullow Oil turned on its technology assisted production system known as TAPS in the remote Jubilee field in the Gulf of Guinea, offshore West Africa, it unleashed a stream of actionable data that the group has exploited ever since to extract maximum value from these isolated assets. So useful has TAPS been that it’s given the company the confidence to develop the deepwater Ten field in the same area. As the group acknowledges, the level of comfort provided by TAPS is vital to operations. “Without the real-time data and analysis tools provided by TAPS it would not have been possible to optimise the Jubilee wells and carry out continuous effective well and reservoir management,” says Tullow’s project manager Mark Whitehouse. The gains have come right across the board. The group estimates that TAPS has saved millions of dollars in the maintenance of the multi-phase flow metering system alone. Based on the PI System, from conception to execution Tullow’s digital solution was developed within just 12 months. But what exactly is TAPS? Summarised, it’s a system for delivering data you can’t do without. And especially when the data is gathered from a depth of 1,250m, roughly 50kms off the coast. Tullow attributes to TAPS a range of benefits. By automating a lot of routine jobs such as alerting engineers about choke settings and well status, it frees up time for more creative work that adds value to the field. And in such a challenging location, there’s a lot of this kind of work. With many of the inspection chores done for them, engineers can put their heads together to resolve technical problems that, if not fixed, could reduce productivity. But how does TAPS work? With the PI system at its heart, it’s essentially a ship-to-shore tool that gathers raw real-time data from strategically placed sensors and transmits it to programmable logic controllers (PLCs) application modules. The data passes through a screen at the control centre before being relayed through a server and collected by PI. These modules process the resulting stream of information— Long way from anywhere…
- 7. 7 for example about the state of the wellheads—and organise it into a shape that delivers important insights. All this happens offshore. Next, the data is transmitted by satellite onshore to Accra, Ghana’s capital, where it flashes up on seven dedicated screens in easily visualised form. At this point Tullow has data it can use—and data is something it uses a lot of. Because the information is so accessible and designated employees see the same data, the company says TAPS facilitates collaboration between different functions. Armed with the lessons the group has learned from TAPS in the Jubilee field, Tullow is applying the system in the TEN area comprising Tweneboa, Enyenra and Ntomme. There won’t be any new drilling in the area pending the resolution of a two-year maritime dispute between the Ivory Coast and Ghana now before the International Tribunal of the Law of the Sea, but meantime Tullow is using TAPS to boost production from existing wells. Dynamic data Plagued by unplanned shutdowns and production losses in the Erb West field 60kms off the coast of Malaysia, Petronas Carigali turned to the PI System a few years ago. The oil major’s main problem in trouble-shooting these interruptions was what it called stagnant data that continually frustrated attempts to restore production. It used to take three weeks before engineers onshore received information about an incident in the field and could then present a report to management. Once a decision could be made, travel to the site had to be arranged. By then, the situation might have worsened with consequent increases in cost and difficulty of repair. Also, since the technical information engineers were given was often inadequate, it made troubleshooting more challenging. Lacking a digital database containing historical information that provided a perspective on which they could rely, engineers often went into action inadequately equipped. Sometimes there was no process data available at all, or it might be hard to access because it was trapped in isolated control systems. “[They were] not able to predict the potential problem [affecting] critical equipment or process instrumentation as there was no real-time monitoring system available,” explains Petronas instrumentation engineer Musreen Azwan. Thus engineers often had to work blind. That’s now all changed. A full panoply of PI System tools was deployed including interfaces, notifications, servers, system management and learning channels. As a result, troubleshooting has become faster, easier and more effective. With much of the work automated―for instance in terms of real-time process information, safe and critical operating limits, instead of having to be gathered by human labour, a lot of highly-paid hours have been saved. “[The system] has given significant return of investment in terms of savings in labour hours and unplanned shutdown time,” the group confirms. Above all, engineers can now identify mounting problems and fix them before they affect production. Petronas Carigali’s capacity for mitigation has increased exponentially. As Azwan puts it, “stagnant data has been turned into a flow of profitable information.” Call it dynamic data. So impressed has Petronas Carigali been by the results that it’s progressively installing the PI System in remote sites across all its offshore operations. Without the real-time data provided by TAPS it would not have been possible to optimise the Jubilee wells
- 8. 8 A s Abu Dhabi’s biggest gas company, Dolphin Energy, is well aware, one of the biggest challenges faced by energy providers is environmental, health and safety compliance. Get it wrong and penalties are certain. But Dolphin Energy has the extra pressure of satisfying the ideals of its chairman, His Highness Sheikh Hamdan Bin Zayed Al Nahayan. As he puts it: “We cherish our environment because it is an integral part of our country, our history and our heritage.” This worthy goal requires an advanced informational infrastructure based on complex calculations and detailed reporting that involves all functions. Comprehensive documentation must be available for third-party auditors. All methodologies employed must be accurate and verifiable. And the data must be rock-solid. Not surprisingly, until a few short years ago Dolphin Energy fell short of the chairman’s goals. The original EHS system, which was based on real-time monitoring of continuous emissions and fuel gas flow meters, was labour-intensive, consuming far too many man-hours with disappointing results. Also, as the company’s Dr. Rola Atiyeh, senior manager for environment and sustainability, acknowledged, it was unreliable for reporting purposes, particularly as regulations become more onerous and production increased. Dolphin Energy produces an average daily volume of 2bn cubic feet (cf) of gas to customers such as Abu Dhabi Water and Electricity, the latter alone taking an average 99m scf a day. OSIsoft stepped into the breach with the PI System. It deployed its latest-generation tools including performance equations, system management, tag configurators, data links and the process book, the latter being a solution-oriented service that allows users to review multiple sets of data and quickly identify ways of enhancing the quality of data. Working with Trinity Consultants and Dolphin Energy’s environmental department, automation engineers, operational groups, process and application engineers, the instrument department, laboratory technicians, and outside consultants, OSIsoft developed a system that today delivers all the data relating to emission rates, carbon footprints, gas flares, gas temperatures, fuel usage and general efficiency among other requirements. Safer, cleaner, greener Game of tags Around the same time as Dolphin Energy was developing its EHS architecture, on the other side of the world in Canada, Suncor Energy was faced with a health and safety issue that was wasting important operational time. The group had been using bypass tags to monitor and audit the safety-critical movement of personnel at two key operations―Firebag and MacKay River that employ steam-assisted gravity drainage techniques. The system had however got out of control with thousands of bypass tags issued, resulting in too many false alarms that took key staff away from more important work. Worried that that health and safety was being compromised, Suncor management called in OSIsoft to see what it could do. “It is very important to continuously monitor and audit safety-critical bypasses as they compromise the functions to protect humans and the environment,” underlines Suncor’s manager of applications and infrastructure, Tripto Somani. A few months later, the PI System was deployed with the desired results and has been applied more widely ever since. Now spread over four sites, it also covers Suncor’s oil sands operations. As Somani explains, the company’s key performance indicators show that the group complies fully with energy and environmental regulatory reporting as well as safety issues. And staff aren’t caught up in wild goose chases. The benefits fell straight to the bottom line. “We did the project to ensure the air emissions calculation system can produce reliable data for all air emission reporting including corporate key performance indicators,” explains Dr. Atiyeh. “The new system will save us a lot of time in quality assurance and quality control. It is accurate, verifiable and documented by scientific methodologies.” As Trinity Consultants’ Sue Sung explains: “In short, [Dolphin Energy] has 100%-validated data that meets regulator’s requirements in the compliance and reporting of environmental health and safety.”
- 9. 9 A s the oil and gas industry searches at ever greater depths for the energy that sustains the global economy, it becomes proportionately more important—and challenging—to know exactly how effectively equipment is functioning far below the earth’s surface. And that’s particularly true about drilling rates. Here’s how Marathon Oil halved from 24 days to 12 days the average time it took to get from spud to total depth. Marathon Oil had been working the difficult Eagle Ford field in Texas for many years. At Eagle Ford, oil is produced at depths of 5,000 to 8,000 feet to the northwest while dry gas is found at depths of 10,000 to 12,000 feet to the southeast, making it difficult to drill and complete wells. So tough are the technical challenges that over the years even experienced operators ran into insurmountable problems and went exploring in easier locations. In 2011, Marathon first began to apply the PI System tool box including MaraDrill and Spotfire. The results weren’t long in coming. Within two years the crews had knocked 50% off the average drilling rate and were approaching 15,000 feet a day, significantly better than industry norms. Up-to-the-minute data The secret is knowing what’s happening in real time at the sharp end. In every single second crews get a flow of insights— between 20-30 bits of data—that tell them how quickly and effectively they are drilling. Rate of penetration, weight on the bit, revolutions per minute, rate of mud flow among other measurements: the data appears on screens in easily understood form. If the drill’s slipping, they know. If it’s sticking, they know. Sensors provide the vital feedback that creates this running commentary of progress from a long way down. Integrated with Spotfire visualization, the crews literally acquire a picture of how they’re doing at any moment of the day or night. Thus they can react quickly if anomalies show up on the screen. As a bonus the management get much better visibility. Not only is it now possible to measure the relative performance of crews, executives can better understand the reasons for any production delays and idle drilling time. Visibility at 2500 metres…
- 10. 10 A step change for Talisman Talisman Energy is another company that has had a long and beneficial relationship with the PI System that every year saves many days in lost production. Back in 2001, Talisman realised it was vulnerable in its North Sea operations to the reliability of its ever-growing portfolio of rotating equipment, much of which operated at considerable depths. Important though the drilling process is, oil and gas companies need to know how well all their hard- worked equipment is functioning. Because there are so many different and interconnected types of machinery in offshore exploration, a malfunction in any one of them can quickly lead to knock-on failures and lost production. As far as Talisman was concerned, prevention was the best cure. After installing its first PI System on a single sub-sea well, Talisman was so impressed by the results that the group began to apply it more widely. Under a project called REEP (for rotating equipment excellence programme), Talisman used PI to monitor the performance of precisely 2,831 pieces of machinery ranging from diesel-driven fire pumps and emergency power generation packages to ballast pumps, gas turbines and compressors and main oil line pumps. In so many words, the purpose was to deliver the data that enables engineers to keep all these complex pieces of engineering up and running. Reaping the rewards Once the PI System was in full operation, Talisman quickly reaped the rewards. When a gas filter got fouled and threatened to blow out, Spotlight alerted the onshore base who deployed a crew to replace it with a standby filter. The estimated saving in lost production was 14 days. Similarly, the system picked up a seal on an oil tank that was registering nearly twice its correct temperature. The resulting fix saved about ten days in lost production. In today’s depressed oil market, it’s these insights that can make all the difference between breakeven costs of production or loss. Talisman Energy is another company that has had a long and beneficial relationship with the PI System
- 11. 11 The PI system is a platform on which hundreds of data-driven applications and services can be mounted which provide executives with the certainty they need to make commercial decisions Coherency counts A s the examples in this paper show the industry needs all the data it can get in the battle to break even in a largely hostile commercial environment. But, as OSIsoft has learned over the years from working alongside these and many other companies, a flood of conflicting information deriving from diverse systems and a heterogenous array of units, protocols and formats can be overwhelming and often leads to confused decision-making. Put bluntly, data has to be banged into shape before it’s useful. The PI System is a platform on which literally hundreds of data-driven applications and services can be mounted, all of them contributing to coherent insights that provide executives and other levels of management with the certainty they need to make sound commercial decisions. And as data is piled on data, it often overwhelms systems built for less information-rich times. That’s why we made the PI System scalable so that it can grow with the demands made on it. Over the years the industry’s needs for data have constantly grown and evolved. It must be delivered in the same language, accessible anywhere on any kind of device, predictive in a way that forestalls hostile events, and organised so that it facilitates collaboration instead of being buried unproductively in silos. It’s this knowledge that underpins the PI System’s universality—that’s why it’s deployed at over 17,000 sites around the world.
- 12. ABOUT OSIsoft, a global leader in operational intelligence, delivers an open enterprise infrastructure to connect sensorbased data, operations, and people to enable real-time and actionable insights. As the maker of the PI System, OSIsoft empowers companies across a range of industries in activities such as exploration, extraction, production, generation, process and discrete manufacturing, distribution, and services to leverage streaming data to optimizeand enrich their businesses. For over thirty years, OSIsoft customers have embraced the PI System to deliver process, quality, energy, regulatory compliance, safety, security, and asset health improvements across their operations. Founded in 1980, OSIsoft is a privately- held company, headquartered in San Leandro, California, U.S.A., with offices around the world. For more information visit www.osisoft.com To discover more uses of technology in oil and gas, visit our dedicated website: http://www.osisoft.com/oil-and-gas/ email: oilandgas@osisoft.com The companies, products, and brands mentioned are trademarks of their respective trademark owners. © Copyright 2017 OSIsoft, LLC | 1600 Alvarado Street, San Leandro, CA 94577 | www.osisoft.com