3. Kilometers
100
50
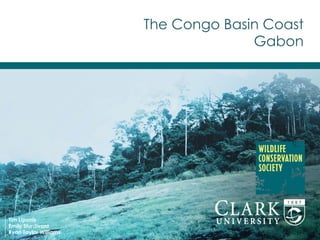
Study Area
Atlantic Ocean
Congo Basin
Coast
Gabon
Landsat 8 Image
USGS and World Atlas
mangroves 2010
UNEP Wetlands 2005
Coastal zone
Protected Areas
3
0°
4°
S
4. Research Objectives
• Identify coastal habitats in Gabon from
Landsat 8 imagery;
• Assess optimal classification methods
based on Landsat 8 data, including
valuable bands and datasets for the
Congo Basin Coast;
• Document challenges and solutions to
facilitate future classifications in the
region.
4
7. Post-
Classification
Classification
Image Prep
Training Site Development
• Literature Review
– Identify important classes
– Develop contextual
knowledge
• Ancillary data
– UNEP, USGS
• Wetlands, mangroves
– Vegetation indices
– Elevation imagery
– Google Earth
• Panaramio (user imagery)
Training Site
Development
7
8. Non-Mangrove Training Site Selection
Class
No.
of
Pixels
Water
76728
Forest
82244
Forest
Shadow
1343
Wetland
44135
Wetland
Shadow
223
Secondary
Complex
2689
Soils
Bright
2582
Soils
Medium
578
Soils
Dark
1684
Savannah
5551
Savannah
shadow
102
20 40 km
8
14. Spectral Signatures of Training Sites
Coastal
Blue
Blue
Green
Red
NIR
SWIR
SWIR
4000
6000
8000
10000
12000
14000
16000
18000
1
2
3
4
5
6
7
Water
Forest
Wetland
Secondary
Complex
Soils
Bright
Soils
Medium
Soils
Dark
Savannah
Landsat 8 Band
DN
14
15. Spectral Signatures of Jones et al. (2014)
0
0.05
0.1
0.15
0.2
0.25
0.3
0.35
0.4
0.45
Band
1
(Blue)
Band
2
(Green)
Band
3
(Red)
Band
4
(NIR)
Band
5
(SWIR)
Band
7
(SWIR)
At-surfacespectralreflectance
Landsat 7 ETM+ bands
savannah
acYve
crops
terrestrial
forest
exposed
soil
exposed
mud
15
16. 0
0.05
0.1
0.15
0.2
0.25
0.3
0.35
0.4
0.45
Band
1
(Blue)
Band
2
(Green)
Band
3
(Red)
Band
4
(NIR)
Band
5
(SWIR)
Band
7
(SWIR)
At-‐surface
spectral
reflectance
Landsat
7
ETM+
bands
closed-‐canopy
mangrove
open-‐canopy
mangrove
mix
closed
&
open
mangrove
terrestrial
forest
Spectral Signatures of Mangroves
Jones et al. (2014)
5000
7000
9000
11000
13000
15000
4
5
6
7
DN
Landsat
8
bands
Training Sites Signatures
Title
Mangroves
Forest
16
Red
NIR
SWIR
SWIR
19. Post-
Classification
Image Prep
Mangrove Classification
Training Site
Development
Classification
Training sites
Flood polygons
Segmentation
Manual digitization
Classification inputs
1 - 7
PCA components
4 - 7
4 - 6, NDWI, and
Distance to water (in CTA)
Red-NIR- SWIR
Classification technique
Maximum Likelihood
Classification Tree Analysis
19
22. Post-
Classification
Classification
• Split into two lines of
methodology
– Non-mangrove
Multi-layered Perceptron
Classification Tree Analysis
Maximum Likelihood
– Mangrove – two windows
Maximum Likelihood
Classification Tree Analysis
Image Prep
Training Site
Development
Classification
22
30. Conclusions of this study
• Mitigating cloud contamination
• Mask clouds using unsupervised classification
• Classifying
• Maximum likelihood identifies prevalent terrestrial types
(Bands 1-7)
• Image sub-setting for rare vegetation types
• Classification tree analysis for mangrove terrestrial
types using Red, NIR, and SWIR bands
• Literature review and ancillary
datasets very useful to determine
training sites
30
31. Recommendations
• Find best imagery
• Review metadata
• Early dry season
• Know study area
• Review literature
• Survey scene and auxiliary data
• Learn the ecology and signatures together
• Site knowledge of scene is crucial!
31
32. Thank You
Acknowledgements:
We would like to thank Dr.
David Wilkie, Dr. Robert Rose,
Dr. Trevor Jones, WCS Congo Program,
Dr. Florencia Sangermano, Arthur Elmes,
and our colleagues for their support on this project.