1. LINKS Report
UAR 2 — Data Stream Inc.
December 8th, 2015
Executive Board Members:
Gary Khodanian — President
Stone Creel — VP of Finance
Timothy Carter — VP of Marketing
Tyler Chambers — VP of Transportation
Heath Jolley — VP of Forecasting and Production
2. UAR 2 LINKS Report – DB 430 1
I. SUMMARY OF STRATEGIES
a.) Product Decisions
i) Planned Additions:
DSI has already made Hyperware and Metaware active in all available SBUs. DSI plans to
activate private label Hyperware and private label Metaware in all available SBUs in the next
two quarters. DSI also plans to activate private label Hyperware and private label Metaware
in the Latin America region when it becomes available.
ii) Planned Deletions:
DSI has not planned any deletion of any products to date. DSI will keep all available
products active unless any strategic business unit displays a consistent reduction in
profitability.
b.) Strategic Competitive Positions
DSI’s competitive positioning strategies are currently strategized for each channel. (Note: These
positions will change as DSI acquires and analyzes more research relating to each specific SBU).
- In the Retail Channel, Hyperware and Metaware are positioned as same product and
availability benefits for a lesser price.
- In the Direct Channel, Hyperware and Metaware are positioned as more product and
availability benefits for a same price.
- In the Major Accounts Channel, Hyperware and Metaware are positioned as same product and
availability benefits for a lesser price.
c.) Distribution Decisions
i) Active Channels:
For Hyperware and Metaware, all available channels are currently active.
ii) Distribution Centers:
DSI owns three distribution centers, with one DC located in North America, Europe, and the
Pacific Rim respectively. DSI will open a distribution center in the Latin America region
when market access becomes available.
iii) RFID Decisions:
DSI will in-source all RFID operations in order to substantially save on the variable costs
involved in installing RFID on units sold in the Retail Channel.
e.) Price Strategies
DSI’s strategy will be to set prices either at or below the current market price. DSI executives
feel that charging a price above the market average will become detrimental for the company’s
total gross margin on unit sales. After more research is acquired and analyzed, DSI will adjust
the prices accordingly in order to optimize for gross margin.
- For Hyperware, in the Retail Channel, for all regions, price is: $295
- For Hyperware, in the Direct Channel, for all regions, price is: $450
3. UAR 2 LINKS Report – DB 430 2
- For Hyperware, in the Major Accounts Channel, for all regions, price is: $420
- For Metaware, in the Retail Channel, for all regions, price is: $410
- For Metaware, in the Direct Channel, for all regions, price is: $560
- For Metaware, in the Major Accounts Channel, for North America & Europe, price is: $620
- For Metaware, in the Major Accounts Channel in the Pacific Rim, price is: $530
f.) Marketing Spending
i) Total Marketing Spending:
In Quarters 1, 2, and 3 total spending per Quarter was: $6,500,000. In Quarter 4, DSI
increased marketing spending to $7,480,008. DSI will increase marketing spending dollars
per quarter based solely on corresponding sales volume increases.
In Year 1, total marketing spending was: $26,980,008
In Year 2, projected total spending is: $33,000,000
In Year 3, projected total spending is: $37,000,000
ii) Mix Allocations
DSI’s current marketing mix allocation is the same across all products, regions, and channels:
Advertising: 40%
Promotion: 30%
Sales Force Programs: 30%
DSI will adjust the marketing mix allocations for each SBU once more research is acquired.
iii) Promotional Programs:
DSI’s promotional programs are divided by channels:
Retail Channel: Primary = Dealer Rebates;
Secondary = Trade-Ins/Exchanges
Direct Channel: Primary = Customer Rebates
Secondary = Trade-Ins/Exchanges
Major Accounts Channel: Primary = Sales Force Training
Secondary = Trade-Ins/Exchanges
According to current research, all promotional programs currently in place are highly valued
by all customers and clients. Therefore, DSI will keep the current promotional programs
unless future research reveals changes that should be made. Specifically, DSI will optimize
promotional programs based on customer preferences and sales revenue within each channel.
iv) Sales Force Salary and Size:
For DSI, Sales Force Salary is currently the same across all regions; however, Sales Force
Size differs between the various regions. This difference is a direct result of the increased
marketing spending that DSI has implemented in North America and the Pacific Rim.
For all regions in all channels: Sales Force Quarterly Salary: $10,500
4. UAR 2 LINKS Report – DB 430 3
In North America: Sales Force Spending = $125,500
Sales Force Size = 3.4
In Europe: Sales Force Spending = $115,500
Sales Force Size: 3.1
In the Pacific Rim: Sales Force Spending = $133,000
Sales Force Size = 3.6
II. STRATEGY EVOLUTION
Over the course of 9 decision quarters, DSI made four major changes to marketing strategy:
1. Instead of basing the marketing mix, promotion, and positioning decisions on
channels, DSI discovered that the specific region played an a more integral role in all
marketing decisions. (For example: In the Pacific Rim a Service driven position is very
effective. Therefore, in the Retail Channel, a Same Benefits for a Lesser Price with an
emphasis on Service was used for positioning.)
2. All available products that can be activated should be activated. DSI found that every
product that was activated would be profitable simply based on the unit sales generated
by the product over time. By maintaining this product expansion strategy, DSI greatly
increased sales revenue and market share throughout the simulation.
3. Prices should only be changed if profit margin can be significantly enhanced through the
price change. In essence, if research study #24 delineated that there would be a significant
change in profit margin, then we changed our price in the strategic business unit.
However, if there was little to no available increase in margin through a price change,
then we kept price at the current level.
4. The most difficult lesson DSI learned was that total marketing spending should be no
higher than 8.5% of the previous quarter’s sales revenue. In quarter 6, marketing
spending was over 9.5% of sales revenue. By spending such a substantial amount on
marketing in exchange for only a minor enhancement to unit sales, DSI’s bottom line
suffered greatly (stock price by over $50). DSI discovered that setting the marketing
spending level at 8.5% of revenues generated the optimal level of unit sales sales success;
we concluded that the direct returns on sales are significantly diminished at all marketing
spending levels above 8.5%.
III. MARKETING RESEARCH
Research Study Usefulness:
Studies #1, 2, 9, & 11 — Benchmarking:
These studies were useful to research any firms who lead any SBUs in sales, or to see what other
firms chose for their generate demand decisions.
Study #12 – Marketing Statistics:
Due to this study being largely made up of benchmarking inventory levels in the Retail Channel,
in every region, for all companies, DSI purchased the report based on quarterly performance with
retail inventory management. Because the study also contains the industry’s demand and unfilled
5. UAR 2 LINKS Report – DB 430 4
orders for Hyperware and Metaware, DSI purchased the report when either choosing important
channels and regions on which to focus resources or intending to capitalize on another firm’s
unfilled orders.
Study #24 – Price Sensitivity Analysis:
Throughout the 9 quarters, DSI purchased this study for every SBU, starting in the United States
and ending in Europe, in order to ensure that our price levels were set for optimal gross margin
across all business units.
Study #25 – Market Potential of Channel Segments:
This study aided in DSI’s allocation of resources throughout the all channels in all regions;
therefore, this report was purchased every quarter.
Study #27 – Marketing Program Benchmarking
This study was invaluable to DSI due to the study’s presentation of all marketing decisions,
except price, for all firms in all SBUs. The data conveyed within the report was extremely
important in making any marketing decision (giving us competitive insight on the performance
of other groups). If a competing firm showed explosive sales growth in any SBU, DSI used this
study to discover what strategies they used to achieve success and countered their decisions.
Study #34 - Availability Perception Drivers
Study #34 was the most valuable research study that we utilized throughout the simulation. The
majority of our marketing decisions were made based on the findings of this study. This study
delineated how customers perceived DSI’s product quality, service quality, and availability for
Hyperware and Metaware across all regions and channels; therefore, DSI purchased this report
every quarter in order to make targeted Marketing Mix, Positioning, and Promotional decisions.
In essence, this study communicated the correct strategies to use for each SBU, directly guiding
all of our firm’s marketing decisions.
Research Study Cost Breakdown:
Quarter 4
Studies #14, 20, 24, 25, 26, 27, 33, & 34
— Total Cost: $328,000
— Revenues: $107,956,505
— Research Operating Expense Ratio: 0.30%
Quarter 5
Studies #14, 20, 24, 25, 26, 27, 33, & 34
— Total Cost: $328,000
— Revenues: $122,585,905
— Research Operating Expense Ratio: 0.26%
Quarter 6
Studies #12, 14, 20, 24, 25, 26, 27, 33, & 34
— Total Cost: $330,500
— Revenues: $114,173,420
— Research Operating Expense Ratio: 0.29%
Quarter 7
Studies #1, 2, 6, 9, 11, 12, 14, 24, 25, 27, & 34
6. UAR 2 LINKS Report – DB 430 5
— Total Cost: $276,500
— Revenues: $129,727,295
— Research Operating Expense Ratio: 0.21%
Quarter 8
Studies #1, 2, 6, 9, 11, 12, 14, 24, 25, 27, & 34
— Total Cost: $276,500
— Revenues: $145,899,400
— Research Operating Expense Ratio: 0.19%
Quarter 9
Studies #1, 2, 6, 9, 11, 12, 14, 24, 25, 27, & 34
— Total Cost: $276,500
— Revenues: $181,197,992
— Research Operating Expense Ratio: 0.15%
Quarter 10
Studies #1, 2, 6, 9, 11, 12, 14, 24, 25, 27, & 34
— Total Cost: $276,500
— Revenues: $199,003,536
— Research Operating Expense Ratio: 0.14%
Quarter 11
Studies #1, 2, 6, 9, 11, 12, 14, 24, 25, 27, & 34
— Total Cost: $276,500
— Revenues: $207,218,029
— Research Operating Expense Ratio: 0.13%
Quarter 12
No Research was purchased.
— Total Cost: $0
— Revenues: $228,089,200
— Research Operating Expense Ratio: 0%
Total Research Costs: $2,369,000
Total Revenues: $1,435,851,282
Total Research Operating Expense Ratio: 0.16%
IV. PERFORMANCE
Data Stream Inc. experienced a high level of overall operational and financial success within the
LINKS simulation. This success was manifested through our firm’s often industry-leading
competitive position in terms of sales revenue, market share, and stock price. However, our
success did not come through a hands-off approach to management; DSI actively engaged in
refining marketing strategy, optimizing inventory management, and carefully analyzing each
strategic business unit in order to achieve a high level of performance. Though DSI ended the
simulation as the set-top box industry leader, the road to success was not an easy or simple path;
our firm experienced significant variation in terms of quarter-to-quarter financial and operational
performance based directly on our decision inputs. Both the challenges and the triumphs that our
firm experienced within the LINKS simulation are demonstrated by our yearly Income
Statement, Balance Sheet, KPI, and Strategic Profit Model reports.
7. UAR 2 LINKS Report – DB 430 6
The shifting strategic focus, and resulting financial performance, for our firm with regard to
product introductions, forecasting inaccuracy, marketing spending, and net income can be
explained through referencing the Income Statement report, found in Appendix A. As a whole,
our income statement paints a clear picture of lackluster financial results (only a slight net
income increase) in Year 2 followed by a strong financial results in Year 3. One major factor that
led to the less impressive bottom line during Year 2 was the product expansion mindset and
strategy for our firm. As seen in Appendix A, introductions for Year 2 constituted a much more
substantial cost value and percentage of revenue relative to Years 1 and 3. We approached Year 2
with the mindset that continually opening products in SBUs would positively benefit our firm’s
performance in the long-run, regardless of the high short-term costs. Therefore, we suffered a
consistent burden on our quarterly net income values due to our maximization of quarterly
product introductions. These quarterly product introductions also led our firm to incur another
major cost of forecast inaccuracy, shown to be a higher percentage of income in Year 2 than in
Years 1 or 3. When introducing products into a new region in which no firms were currently
operating, we faced the situation of making blind forecasts on unit sales of our product. The
inaccuracy of these new product forecasts resulted in consistently high cost values for our firm in
the category of forecast inaccuracy, further lowering our bottom line for Year 2. Upon entering
Year 3, we shifted directly into a market-share gaining strategy with a heavy emphasis on
marketing spending. Though our marketing spending costs as a percentage of sales increased, our
quarterly sales revenue and net income rose significantly, leading to our financial success during
Year 3. Overall, the Income Statement in Appendix A accurately delineates our varying strategies
and resulting performance throughout the simulation.
Similarly, our firm’s varying strategic path in terms of cash balance, loans, inventory value, and
total retained earnings can be explored through referencing the Balance Sheet report, found in
Appendix B. Though Year 1 ended with a relatively stable level of cash and loans, the end of
Year 2 found our firm burdened with a significant level of loans, a high amount of stored
inventory, and an increased balance of cash. The previously mentioned product expansion
strategy during Year 2, along with the inconsistency of sales forecasts, led to a substantial build
up of inventory levels throughout our distribution centers. Without the available capital to pay
for the increased inventory costs, our firm was forced to increase our loans in order to fund the
major expansion. However, the balance sheet for Year 2 further delineates that we continued in
loyalty to our shareholders regardless of the increased financial burden by showing a nearly $3
million increase in dividends paid out and a $13 million increase in total retained earnings. We
believe that our consistent unit sales across all regions during this time allowed our firm to
increase our cash balance and shareholder performance regardless of the ongoing expansion. As
we moved into Year 3, our focus on unit sales through marketing spending proved to be
tremendously successful in terms of cash balance and retained earnings. After operating the firm
for over a year of decision variables upon entering Year 3, we had gained knowledge on
successful inventory management techniques. This success and increase in efficiency, in turn,
greatly decreased our inventory costs, rapidly increased our cash balance, and fully enhanced our
dividends distributed to shareholders. Our selling success further allowed us to significantly
reduce our loan balance over the course of Year 3, ending with over $40 million less in loans
when compared to Year 2. Viewed in full, the Balance Sheet reports in Appendix B reflect the fall
and subsequent rise in our firm’s financial performance over the course of the simulation.
8. UAR 2 LINKS Report – DB 430 7
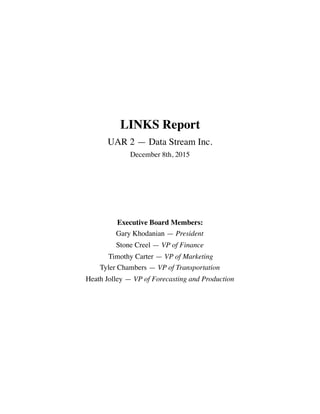
The overall operational efficiency of our firm with regard to quarterly stock price, sales revenue,
unit sales, and forecast accuracy can be studied through viewing the KPI reports, found in
Appendix C. When analyzing our firm’s share price on a quarterly basis (seen in Figure 1),
Quarter 6 during Year 2 conveys a particularly poor decision period for our firm. The primary
factor that brought about this fall in share price was our firm’s excessive marketing spending. As
seen on the KPI table, we increased marketing spending by nearly $4 million from Quarter 5 to
Quarter 6. In essence, our strategy behind this decision was to convert the early revenue
advantage we had gained into an enormous lead in terms of market share and unit sales.
However, our anticipated sales did not reach anywhere near our actual sales volume, clearly
shown by our 56% forecasting accuracy for the period (our enormous forecasting accuracy dip
can be seen in Figure 2). Therefore, the combination of excessive marketing and poor unit sales
led to a huge fall for our firm in terms of overall revenue, gross margin, net income, and share
price. Upon analyzing our mistakes, our firm responded by reducing marketing spending to a
stable level (we began to base our marketing spending on a percentage of revenue instead of on
pure dollar amounts) and focusing on refining various marketing mixes in each specific SBU.
These decisions, in turn, allowed our firm to return to profitable levels of operation and steadily
increase in operational success throughout the rest of the simulation, shown by the positive slope
on the share price, sales revenue, and unit sales figures in Appendix C after Quarter 6. As a
whole, the operational tables and figures throughout Appendix C show our substantial mistakes
in quarterly decisions, the detrimental overall performance that resulted from those mistakes, and
the recovery steps that our firm took to return to profitability.
The ultimate measures of growth and success for our firm in terms of profit margin, return on
assets, and return on equity can be analyzed through referencing the Strategic Profit Model report
found in Appendix D. Similar to both the Income Statement and Balance Sheet reports, the
Strategic Profit model report shows a modest improvement across all variables for Year 2. The
primary negative component shown in Year 2’s DuPont model is the increase of our firm’s
financial leverage. The major factor contributing to this increased financial leverage is the
substantial increase in firm-wide loans that took place throughout Year 2 in order to fund our
higher inventory levels and continual product introductions. The ratios of profit margin, asset
turnover, and return on assets increased regardless of our aggressive marketing strategy, allowing
our overall return on equity to increase by just over 1.5% from Year 1 to Year 2. However, as our
firm entered the period of financial success in Year 3, our strategic profit model began to reflect
our improved operating decisions. Specifically, the reduction in our inventory levels combined
with our increase in sales and net income led to our asset turnover ratio increasing much beyond
all expectations. This increase in asset turnover, in turn, allowed for our overall return on assets
to rise nearly 10% from Year 2 to Year 3. Though we expected our profit margin to end at a
higher value, we found that our substantial increases in revenue and consistency in cost-related
decisions allowed for the profit margin percentage itself to stabilize (while greatly increasing our
net income dollars). Finally, our reduction of loans through firm-wide profitability allowed for
our financial leverage ratio to decrease greatly. All of these positive changes to our strategic
profit model allowed for our return on equity to end at over 23%, increasing by nearly 11% in the
last 4 quarters of the simulation. When analyzed in-depth, the Strategic Profit Model report found
in Appendix D effectively delineates the true financial success caused by our effective asset
utilization and inventory management decisions.
9. UAR 2 LINKS Report – DB 430 8
V. POST MORTEM ASSESSMENT
Question 1 / Keys to Success in LINKS:
Throughout the LINKS simulation, we faced a number of difficult challenges that required the
full application of our collective business acumen to solve. These challenges were not simple
choices between cost-related alternatives for our firm; the difficulties ranged from allocating
sufficient time and effort for gaining industry insight, making complex decisions amidst differing
opinions from team members, and managing risk within an unpredictable market landscape. To
some, these unique challenges, along with the tremendous depth of decisions required by the
simulation, could seem insurmountable. However, our team was able to persevere through the
difficulties that arose and achieve success by holding true to the three key strategies of studying
the industry and competition, engaging in effective communication, and executing all decisions
with a high level of decisiveness.
The first strategy that our team feels is a key to success in LINKS is the comprehensive,
continual learning of the set-top box industry through the LINKS manual and research studies.
As the simulation began, our team collectively agreed to placing a large emphasis on studying
the LINKS manual in order to fully understand the decision making variables involved. Due to
each team member’s execution of this agreement, we entered the simulation with a number of
decisions already planned out (the decision to open owned distribution centers in all regions, the
transportation carrier to use, etc.). This strategy, in turn, led to early financial success for our firm
and provided our team with a solid foundation from which to build our set-top box marketing
expertise. However, the initial knowledge base of the LINKS manual was only the starting point
for our utilization of industry knowledge in pursuit of success. While the LINKS manual gave
our team the competence to know the various effects and costs for each decision, our full,
industry-impacting knowledge came directly from studying purchased research studies in the
simulation. From executing on pricing changes in strategic business units to reevaluating
marketing decisions and even gauging the threats posed by competing firms, research studies
were unequivocally integral in our firm’s industry-leading success. We supported every major
decision made by our team throughout the simulation with hard data sourced directly from our
quarterly LINKS report and research studies. This fact-based decision making framework would
have been impossible without each team member’s diligent dedication to understanding and
utilizing the information provided by the reports. As a whole, we feel that our continual openness
and commitment to learning about the set-top box industry, be it through the LINKS manual or
through the various quarterly reports and research studies, was a direct proponent to the
successful operation of our firm within the simulation.
Another strategy that our team feels is essential for success in LINKS is the integration of
effective, consistent communication in all firm operations. From the onset of all group activities,
our team established a consistent schedule of one weekly meeting occurring at the same time and
in the same location. We also established that all quarterly decision inputs would be discussed,
decided, and implemented solely at the weekly meeting (fully outlawing all individual “rogue”
decision inputs). Beyond simply implementing an attendance requirement for meetings, we
agreed that constant communication via phone and email for all LINKS related topics was
immensely important, specifically stating a lack of communication as a key component of our
firing policy. As the simulation began and progressed throughout the year, the communication
between all group members during decision making scenarios proved to be tremendously
10. UAR 2 LINKS Report – DB 430 9
beneficial in allowing our team to intelligently execute on our planned strategies. The primary,
and most practical, purpose that continual communication served for our team was simply
allowing all weekly decisions to be discussed and input in the correct order, format, and time
structure. Our collaborative presence at the weekly meeting allowed our firm to successfully
input our forecasting, transportation, and production decisions without mix-ups or errors in the
system, helping our firm to minimize technical mistakes (all decisions were entered on one
computer system by the firm President). However, effective communication also served the
deeper, more meaningful purpose of allowing all major firm decisions to be discussed and
interpreted from every perspective in our firm. Though the final decision was always left in the
hands of the divisional manager (pricing decisions were ultimately confirmed by the VP of
Marketing, distribution center decisions were confirmed by the VP of Production, etc.), the
communal presence of every executive representative during decisions allowed for an open
dialogue on assessing the true business impacts of any decision. Therefore, all major decisions
were defined by the group structure itself, allowing the fullness of the group expertise to judge
the correct decision input. Overall, this open, constant communication pattern allowed us to
execute on marketing strategies with our shared knowledge as the source and our shared
responsibility in the outcome, propelling us towards success in the simulation.
The final strategy that our firm discovered as a key for successful operation in the LINKS
simulation is exercising confidence and decisiveness in all decision inputs. As we began the
simulation, our firm combined the previously discussed strategies of strong industry knowledge
and active communication in order to jump ahead of the competing firms in terms of financial
performance and stock price. Though this success was tremendously satisfying and encouraging,
our industry-leading performance brought about a challenge in comparative analysis for our
firm’s executive team. Specifically, this challenge came to fruition in our decision making
process when the opportunity for moving into the private label sector was at the forefront of our
strategy and conversation. In essence, our team had agreed prior to the simulation that opening
private label products would be our first major move after opening products in all standard
strategic business units. However, when we reached the quarter in which we had initially planned
to execute on that strategic decision, we noted that the firms who had already moved into the
private label sector were suffering from poor financial performance. Due to our industry-leading
position, we were unsure on whether the poor performance was caused by the competing firms’
poor decision making or by the private label products themselves. In the end, we lacked
confidence in our firm’s successful performance and in the reliability of our previous analysis
behind moving into the private label category; therefore, we chose to hold off on opening private
label products that quarter. This lack of decisiveness in executing the decision we knew to be
correct (opening private label products) was the primary factor in our firm’s tremendous losses
the following quarter (Quarter 6); the quarter was characterized with our firm losing a large
volume of unit sales, market share, and sales dollars to competing firms throughout Channel 1
(where they had opened private label products). From that point onward in the simulation, we
vowed to execute all further decisions with full trust in our team’s decision making abilities,
never failing to execute on our strategic plans based on hesitancy or self-doubt. The commitment
to decisiveness that we established following that quarter’s losses led to our firm’s most
successful decisions throughout the simulation, including the early move into Latin America that
solidified our market share and sales volume throughout the region. Though all of our decisions
continued to be heavily vetted and discussed by each team member, we never again missed on a
11. UAR 2 LINKS Report – DB 430 10
strategic opportunity due to fear of our own firm’s inadequacy. Therefore, we strongly believe
that confidence in analysis, strategy, and decision making, paired with a high level of industry
knowledge and team communication, is the means by which a firm can rise to industry success in
the LINKS simulation.
Question 2 / Valuable Lessons:
The two valuable lessons that our team learned from the LINKS competition were financial
competence when discussing business metrics and highly effective team communication skills.
The first key component of our learning experience, gaining competence for relevant financial
discussion, resulted from the weekly viewing and analysis of the LINKS reports. Essentially,
each team member learned both the true meaning and business application of terms like net
income, gross margin, and market share. Beyond the terms themselves, we also learned how firm
decisions directly affect the relevant business ratios of net income to revenue, financial leverage,
and return on assets, among many others. This experience, in turn, allowed us to consistently
engage in high level conversations that heavily involve concepts that many real-world executives
consider and discuss on a day-to-day basis. We feel that the extensive experience in working
with and understanding the terminology that filled the LINKS simulation will give us a true
advantage moving into the business world.
The second key component of our learning experience, practiced and fluid team communication
skills, resulted directly from our weekly team meetings and the continual discussions that we
engaged in on LINKS related topics. On a weekly basis, the simulation initially forced us to learn
about how each individual team member thinks and communicates when considering a decision.
As the simulation progressed, our challenge developed into understanding how the different
background and responsibility areas of another team member affect their decision making
rationale and processes. In each meeting, we converged our individual ideas and thoughts into a
collective pool of agreed-upon group knowledge; we then utilized this shared knowledge in order
to execute on our strategies and achieve success. We feel that the experience in developing from
a diverse group of individuals into a fully functioning, cohesive business unit will aid in our
successful team-based communication and performance in the professional business world.
Question 3 / Recommendations for Improvement:
We feel that the current method of implementation for the LINKS Multi-Channel Management
Simulation in Distribution Operations was highly successful, yielding a tremendous learning
experience for each of our group members. Therefore, we recommend no changes to how the
simulation is currently used to aid student learning in the course. We do, however, feel that the
use of LINKS should be more prevalent and in-depth in the prerequisite course in order to
adequately prepare students for the challenge of running a firm in the Multi-Channel
Management Simulation.
12. UAR 2 LINKS Report – DB 430 11
APPENDIX A — INCOME STATEMENT FOR THREE YEARS
Income Statement Year 1 (Q 1-4) Year 2 (Q 5-8) Year 3 (Q 9-12)
$ Millions % $ Millions % $ Millions %
Sales Revenue 332.99 100 512.39 100 815.51 100
- Cost of Goods Sold -236.85 -71.13 -361.93 -70.64 574.52 -70.45
Gross Profit Margin 96.14 28.87 150.46 29.36 240.98 29.55
Fixed & Overhead Costs 31.03 9.32 43.00 8.30 62.44 7.66
Marketing 22.68 6.81 36.96 7.20 62.12 7.62
Marketing Creative 1.30 0.39 4.42 0.86 1.60 0.20
Research Studies 0 0 0.84 0.16 1.03 0.13
Emergency Production 0.99 0.30 2.07 0.40 2.02 0.25
Introductions 0.75 0.23 6.50 1.20 5.13 0.63
Forecast Inaccuracy 1.03 0.31 6.14 1.10 7.81 0.94
Information Technology 0.11 0.03 0.22 0.04 0.19 0.02
Inventory Charges 0.78 0.23 2.71 0.52 4.09 0.50
Price Changes 0 0 0.30 0.05 0.16 0.02
Consulting Fees -0.30 -0.09 -3.60 -0.70 -1.60 -0.20
Service Outsourcing 11.03 3.31 16.14 3.10 28.82 3.53
Unfilled Handling 0.91 0.27 0.01 0 0 0
- Total Fixed & Other
Costs
-71.1 -21.35 -118.13 -23.05 -173.81 -21.31
Operating Income 25.04 7.52 32.33 6.31 67.17 8.24
- Non-Operating Income -3.02 -0.91 -4.91 -0.95 -6.26 -0.78
- Taxes -11.01 -3.31 -13.71 -2.68 -30.45 -3.73
Net Income After Tax 11.01 3.31 13.71 2.68 30.45 3.73
13. UAR 2 LINKS Report – DB 430 12
APPENDIX B — END OF YEAR SPREADSHEETS FOR QUARTERS 4, 8, AND 12
Quarter 4 / End of Year 1:
Quarter 8 / End of Year 2:
Assets $ Liabilities $ Equity $
Cash: 5,397,825 Loans: 31,086,935 Corporate capitalization:
100,000,000
Inventories: 8,399,207 Dividends, Current:
-1,025,095
Plant Investment: 125,000,000 Dividends, Cumulative:
-2,279,229
Retained Earnings,
Current: 3,416,984
Retained Earnings,
Cumulative: 7,597,437
Total Assets: 138,797,032 Total Liabilities: 31,086,935 Total Equity: 114,318,745
Assets $ Liabilities $ Equity $
Cash: 7,294,970 Loans: 56,545,678 Corporate capitalization:
100,000,000
Inventories: 41,556,367 Dividends, Current:
-1,394,736
Plant Investment: 125,000,000 Dividends, Cumulative:
-6,021,969
Retained Earnings,
Current: 4,649,121
Retained Earnings,
Cumulative: 20,073,243
Total Assets: 173,851,337 Total Liabilities: 56,545,678 Total Equity: 117,305,659
14. UAR 2 LINKS Report – DB 430 13
Quarter 12 / End of Year 3:
Assets $ Liabilities $ Equity $
Cash: 11,404,460 Loans: 15,892,206 Corporate capitalization:
100,000,000
Inventories: 18,112,049 Dividends, Current:
-3,586,905
Plant Investment: 125,000,000 Dividends, Cumulative:
-12,966,360
Retained Earnings,
Current: 11,956,350
Retained Earnings,
Cumulative: 43,221,218
Total Assets: 154,516,509 Total Liabilities: 15,892,206 Total Equity: 138,624,303
15. UAR 2 LINKS Report – DB 430 14
APPENDIX C — SUMMARY OF KPI AND OPERATING PERFORMANCE
Key Performance Indicators:
Note: All dollar values in the Key Performance Indicators table are presented in millions of
dollars.
Quarter Total
Marketing
Budget
Share
Price
Sales
Revenue
Gross
Margin
$
Gross
Margin
%
Net
Income
$
Net
Income
%
3 5.4 79.2 76.7 21.9 28.5 2.4 3.16
4 6.4 79.6 107.9 31.8 29.4 3.4 3.17
5 7.4 105.6 122.5 36.1 29.5 4.9 4.00
6 11.6 51.1 114.1 31.6 27.7 0.2 0.20
7 8.6 71.1 129.7 39.3 30.3 3.9 3.00
8 9.2 98.6 145.8 43.3 29.7 4.6 3.20
9 12.4 120.5 181.1 52.6 29.1 5.6 3.11
10 14.8 130.0 199.0 56.7 28.5 5.8 2.94
11 16.5 155.4 207.2 61.3 29.6 7.0 3.39
12 17.9 229.2 228.1 70.2 30.8 11.9 5.20
0
50
100
150
200
250
3 4 5 6 7 8 9 10 11 12
Share Price
Share Price
Figure 1 - Share Price Over Time