Physical and perceptual-cognitive demands of top-class refereeing in association football
•
1 like•616 views


Recommended
Recommended
More Related Content
What's hot
What's hot (20)
Viewers also liked
Similar to Physical and perceptual-cognitive demands of top-class refereeing in association football
Similar to Physical and perceptual-cognitive demands of top-class refereeing in association football (20)
Physical and perceptual-cognitive demands of top-class refereeing in association football
- 1. Physical and perceptual-cognitive demands of top-class refereeing in association football WERNER HELSEN* and JEAN-BAPTIST BULTYNCK Department of Kinesiology, Katholieke Universiteit Leuven, Tervuursevest 101, B-3001 Heverlee (Leuven), Belgium Accepted 14 June 2003 The aim of this study was to examine the physical and perceptual-cognitive demands imposed on UEFA top- class referees and assistant referees during the final round of the Euro 2000 Championship. To investigate the physical workload, the heart rates during matches were monitored by short-range radio telemetry and translated to different workloads expressed as a percentage of maximal heart rate. For measurement of the perceptual- cognitive workload, video-recordings of games were used to obtain the average number of observable decisions taken by a referee. On average, referees and assistant referees performed the matches at 85+5% and 77+7% of their maximal heart rate, respectively. Over the 31 games, the mean number of observable decisions was 137 (range 104–162), 64% of which were based on communication with the assistant referees and/or the fourth official. To optimize the physical preparation of top-class match officials, the results of this study support the application of intensive and intermittent training sessions, which should place priority on high-intensity aerobic stimuli. In addition, video training is discussed as an additional method for improving match officials’ decision making. Keywords: decision-making skills, heart rate, refereeing. Introduction Several researchers have examined the activity profiles and physiological demands of professional soccer players during competitive games (Bangsbo, 1994a,b; Reilly, 1997; Reilly et al., 2000). Only a few researchers, however, have examined the movement patterns and physiological strain of referees (Krustrup and Bangsbo, 2001). To date, no attempt has been made to examine both the physical and perceptual-cognitive demands on top-class referees and assistant referees. In Table 1, we provide an overview of the results of studies that have examined the different activity profiles of referees. Based on the average speed criteria of the different activity categories suggested by Krustrup and Bangsbo (2001) and D’Ottavio and Castagna (2001a), a generalized speed range is presented for the different activities. In line with Bangsbo (1995), we compiled all these activities into five main categories, expressed as a percentage of individual maximal heart rate (HRmax). For several reasons, it is difficult to compare the findings of the studies in Table 1. First, there are substantial differences in the methodology the authors used to categorize the different activities and in the technologies they employed to quantify the physiolo- gical demands. Recent researchers (Krustrup and Bangsbo, 2001; D’Ottavio and Castagna, 2001a), for example, used twice as many activity categories as the researchers in the late 1980s and the early 1990s. However, even for those studies which involved the same number of activity categories, as in the 2001 studies, different speed criteria have been applied to obtain the amount of time spent in each of the different activities. In terms of the physiological demands, there are also quite important differences between studies. Johnston and McNaughton (1994) used activities over 85% HRmax as the upper range, whereas Krustrup and Bangsbo (2001) and D’Ottavio and Castagna (2001a, b) used activities over 90% HRmax. On a related topic, we also need to consider how the authors used HRmax as an indicator of the physical demands. Krustup and Bangsbo (2001) used peak values to determine maximal heart rate, while both Johnston and McNaughton (1994) and D’Ottavio and Castagna (2001a, b) used the ‘2207age in years’ rule to obtain HRmax. Because in all these studies the physical demands were expressed in relation to HRmax, it is clear that the way HRmax was determined may impact on the results. * Author to whom all correspondence should be addressed. e-mail: werner.helsen@flok.kuleuven.ac.be Journal of Sports Sciences, 2004, 22, 179–189 Journal of Sports Sciences ISSN 0264-0414 print/ISSN 1466-447X online # 2004 Taylor & Francis Ltd DOI: 10.1080/02640410310001641502
- 2. A second reason why comparisons between studies may only be done with caution is that differences in the competitive standard of both referees and players may be of importance for the results that have been obtained. Harley et al. (1999), for example, reported total distances of approximately 7 km for English county standard referees, which approximates to the distance an Italian referee in Serie A covers during a single half (Castagna and D’Ottavio, 2001). In the same way, players in the English Premier League cover 1.5 km more than their South American international counterparts (Drust et al., 1998). Evidently, these differences also impact on the referees’ performances. A third factor that should be taken into consideration when comparing different studies is the fitness of the referees. As Krustrup and Bangsbo (2001) and Cas- tagna and D’Ottavio (2001) have pointed out, the fitness of referees clearly affects the distance they cover: the better the physical condition of the referees, the greater the amount of activity they will perform at both high intensity and maximum speed during the game. Evidently, fitness differences between groups may partly explain the differences found between the studies published in 2001 listed in Table 1. Finally, differences in the styles of play (the ‘between- country effect’) should also be taken into consideration when comparing the results of different studies. Specifically, it may be hypothesized that the patterns of play in matches in the Italian Serie A are quite different from those in the top Danish leagues. Hence this difference in play will lead to a difference in the activities of the referees. In the same way, it is difficult to make a like-for-like comparison between the 1994 Australian results of Johnston and McNaughton due to the standard of the football played, especially back in 1993 and the limitations to their study mentioned previously (i.e. HRmax being calculated as 2207age in years). Obviously, each country has a slightly different story to tell with regards to the demands upon both players and referees. If only those studies using a similar methodology are taken into consideration, it becomes clear that the total distance covered by referees has increased significantly from approximately 9 km in the early 1990s (Johnston and McNaughon, 1994) to over 11 km in the most recent studies (D’Ottavio and Castagna, 2001a,b). However, the total distance covered during a game is not the best measure of the physical load imposed on a referee during a game. As Bangsbo et al. (1991) have pointed out, the amount of high-intensity work is a better indicator of the demanding periods of the game. From this perspective, D’Ottavio and Castagna (2001a) combined maximal ( 424.1 km × h71 ), high (18.1– 24.0 km × h71 ) and medium (13.1–18.0 km × h71 ) speed runs to represent the high-intensity activity category. Within this high-intensity activity category, Italian high-level soccer referees covered 4.8 km or 42% of the whole match distance. Heart rates amounted to 89% of the estimated maximal heart rate over the duration of a full game. These results are in line with those of D’Ottavio and Castagna (2001b), but twice those found in the early 1990s (e.g. Johnston and McNaughton, 1994). To date, limited research has examined the activity patterns and physiological demands of soccer referee- ing, and only one study has focused on assistant refereeing. Using the same methodology Krustrup and Bangsbo (2001) used for referees, Krustrup et al. (2002) performed computerized time–motion analyses and measured the heart rate and blood lactate concentration of assistant referees in the top Danish leagues. Compared with referees, who covered a total distance of 10.1 km and performed 1265 different activities, assistant referees covered 7.2 km and per- formed 943 activities, resulting in a change in activity every 4 and 6 s, respectively. For referees and assistant referees, the mean heart rate was 162 and 137 beats × min71 , corresponding to 85% and 73% of maximal heart rate, respectively. Taken together, the results of Krustrup et al. (2002) show that top-class assistant soccer refereeing is characterized by brief intense bouts of forward and sideways running inter- spersed with long periods of low activity. The present study was the first to examine the physical loads imposed on the two categories of match officials. To extend the existing knowledge base using a more homogeneous sample of games, we investigated the physical load imposed on UEFA top-class referees and assistant referees during matches in the final rounds of the Euro 2000 Championship. Perceptual-cognitive demands The most important aspect of refereeing is the decision- making process. Throughout the game, a referee has to make correct decisions under time constraints. To date, only two studies have examined the correctness of referees’ and assistant referees’ decisions. Van Meerbeek et al. (1987), for example, counted the number of correct and incorrect decisions related to specific laws of the game during the 1986 World Cup in Mexico. They found that of all the decisions made in 16 games, 17% were incorrect (range 11–35%). Unfortu- nately, these authors did not explain how a small panel of researchers were able to conclude what was the correct response for each decision (and decide that the top-class referees were ‘wrong’). Without this informa- tion, it is difficult to assess the accuracy of the findings of their study. That it is very difficult to achieve an errorless implementation of the laws of the game has 180 Helsen and Bultynck
- 3. Table 1. Relationship between different activity categories of referees and corresponding intensity categories expressed as a percentage of maximal heart rate Intensity categories Asami et al. (1988) Catterall et al. (1993) Johnston and McNaughton (1994) Krustrup and Bangsbo (2001) D’Ottavio and Castagna (2001a) Speed range (km × h71 ) Maximal effort (4 95% HRmax) — Sprinting (11.8%) Sprinting (6.2%) Sprinting (0.5%) Sprinting (5.3%) 4 24.1 High-intensity (86–95% HRmax) Running (17.7%) — Running/striding (12.1%) High speed (1.6%) Moderate speed (4.5%) High speed (13.7%) Medium speed (22.7%) 18.1–24.0 13.1–18.0 Low-intensity (76–85% HRmax) Jogging (48.5%) Jogging (47.0%) Jogging (46.6%) Low speed (9.0%) Jogging (15.5%) Low speed (36.7%) 9.1–13.0 6.1–9.0 Active recovery (66–75% HRmax) Walking (33.8%) Walking (23.0%) Walking (18.9%) Walking (40.3%) Walking (7.8%) 3.1–6.0 Passive recovery (5 65% HRmax) — — — Standing (22.6%) — 5 3 No specifications Backward (10.8%) Reverse run (18.2%) Backward (16.2%) Backward (5.9%) Back and sideways (13.2%) 10.0
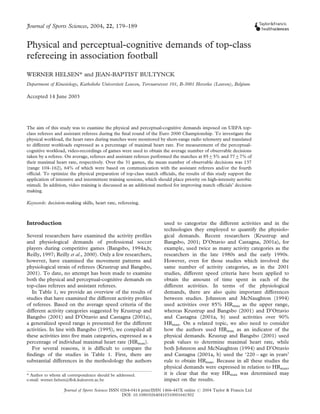
- 4. also been demonstrated recently by Oudejans et al. (2000) for judging offside by assistant referees. Speci- fically, they showed that the observation point of assistant referees relative to the offside line is an important determinant of incorrect decisions in judging offside. To our knowledge, no study has dealt with the perceptual-cognitive demands of top-class refereeing, revealing how many and what kinds of decisions a referee has to make while ‘reading’ the game. Therefore, we wished to gain a better understanding of this particular aspect of decision making, as well as examine the physical demands of football refereeing during top games. The specific aims of this study were to: (1) examine the physical load imposed on both referees and assistant referees during the matches of the Euro 2000 Cham- pionship; and (2) assess the perceptual-cognitive demands of top-class refereeing during all the 31 matches of the Euro 2000 Championship, expressed as the number and type of visible decisions. Methods Participants The participants were all experienced UEFA top-class referees (n = 17) and assistant referees (n = 17) selected from different European countries. After a brief explanation of the nature of the study, written consent was obtained from the UEFA referees’ committee and from all the referees involved in the tournament. The study was designed and conducted in accordance with the ethical standards laid down in the 1964 Declaration of Helsinki and approved by the Committee for Ethical Considerations in Human Experimentation of the Faculty of Physical Education and Physiotherapy from the Katholieke Universiteit Leuven. Back-up team For the Euro 2000 tournament, the refereeing team was considered in a manner similar to that as the 16 national sides. First, there was the assistance of the members of the referees’ committee. To further assist the 34 referees, there was also a back-up team that consisted of a medical doctor, three physiotherapists, a video technician, a press officer, one assistant coach and one head coach, who was also the coordinator of the back- up staff. All these people were present full-time for the group matches. Thereafter, one physiotherapist left as well as the assistant coach, resulting in four full-time staff members for the second tour. From the quarter- finals until the final, three staff members were present full-time. Anthropometry The age of the participants was recorded to the nearest 0.01 year by subtracting the decimal year of the participant’s date of birth from the decimal year of the day of the measurement (Baxter-Jones et al., 1995). Measurement of height and weight was performed during the week prior to the start of the tournament. All measurements took place in the medical service room and were carried out by the UEFA referees’ team physician. Height was measured to the nearest milli- metre with a Harpenden stadiometer (Holtain Ltd, Crosswell, UK). For accuracy, the measurement was performed twice and the results averaged. The mean arithmetical difference between these two measure- ments for standing height was 0.04 cm. Body mass was measured to the nearest 100 g on a Soehnle electronic scale (Soehnle, Bonn, Germany). Physical workload during match-play Heart rate measurement was used as an indication of the physical workload imposed on referees and assistant referees during match-play. Heart rate was recorded using short-range radio telemetry (Polar Accurex Plus, Kempele, Finland). A chest monitor transmitted the heart rate signal to a receiver on the wrist. The heart rate was recorded every 5 s. The data were stored in the watch and then downloaded on a computer using the Polar precision 3.0 software (Polar, Kempele, Finland). After each and every game, the individual heart rate data were printed out to inform each and every referee about his performance and/or progress. During the UEFA top-class referees’ course in Malta (February 2000), and the pre-tournament clinic in Brussels and Leuven (April 2000), each referee was given a heart rate watch. For those who were not familiar with the equipment, these courses were used to provide them with the necessary experience before the start of the Euro 2000 tournament. The wearing of the heart rate watch during matches was not mandatory. However, 47 match observations were obtained (13 for the referees and 34 for the assistant referees). In Fig. 1, typical examples are given of the graphical output of the heart rate recordings of the referee during the Euro 2000 final between France and Italy and one of his assistant referees. Perceptual-cognitive demands To measure the number of ‘observable’ decisions a referee made during a match, each game was recorded on videotape. Using an interactive programme (Video- Coach 2.0, Sport4S, Heverlee, Belgium), it was possible to make an objective notational analysis of 182 Helsen and Bultynck
- 5. the referees’ decisions in all 31 matches. This analysis was based on the observation of the body language of the referee on the video replays of the games. A distinction was made between three main categories. First, there were those decisions that the referee had to make, including signalling to let the play continue even when an infringement had occurred (i.e. playing ‘advantage’), awarding direct and indirect free kicks and penalties, and dealing with ‘simulations’ (i.e. when players try to force a penalty or a free kick when there is no real offence). The second category consisted of those decisions in which the referee had to communicate with one of his assistants before making a decision, as in the case of corner kicks, goals, goal kicks, offsides, team changes and throw-ins. Finally, the decisions under the heading ‘others’ referred to dropped balls and the 12010560450 80 100 120 140 160 180 200 Time First period Second period 85-95% HRmax Extra time Heartrate(beats.min-1) (a) 60 80 100 120 140 160 180 Heartrate(beats.min-1) 12010560450 85-95% HRmax First period Second period Extra time (b) Fig. 1. A typical example of the graphical output of heart rate recordings, showing heart rate versus time. The graphs show data for the referee (a) and one of his assistants (b) during the final of the Euro 2000 Championship between France and Italy. 183Demands of top-class refereeing
- 6. awarding of red and yellow cards. The 31 match analyses were all performed by the same experienced observer, and were tested for intra- and inter-observer reliability. During a match, however, a referee can also decide not to interfere. The numbers and types of these ‘non-observable’ decisions were not taken into account. Data reduction In line with Krustrup and Bangsbo (2001) and Krustrup et al. (2002), individual values for maximal heart rate (HRmax) were determined as the peak values reached in any of the 5 s periods observed during matches, training sessions or incremental exercise tests in the laboratory. For the analysis of the physical load imposed on both referees and assistant referees during the actual matches, a distinction was made between five different activity categories expressed as a percentage of maximal heart rate: (1) maximal effort ( 495% HRmax); (2) high-intensity (86–95% HRmax); (3) low-intensity (76– 85% HRmax); (4) active recovery (65–75% HRmax); and (5) passive recovery ( 565% HRmax). These five categories were based on findings in the literature (Bangsbo, 1994a; D’Ottavio and Castagna, 2001a,b; Krustrup and Bangsbo, 2001; Weston and Brewer, 2002) as well as on empirically defined standards that were based on our experiences with top-class referees. An interactive programme (Polar precision 3.0 soft- ware, Kempele, Finland) was used to identify the amount of time that was spent in the different activity categories. Changes in physical and mental load were evaluated for 15 min intervals during the first and second half. Data analysis The anthropometric data for the referees and assistant referees were compared using unpaired t-tests. For the analysis of the physical load during match-play, a two- way analysis of variance (ANOVA) was performed on the heart rate data expressed as a percentage of HRmax using a 2 (group: referees, assistant referees)66 (period: 15 min intervals) design with repeated mea- sures on the last factor. To further examine the relative contribution of the different activities performed during match-play by referees and assistant referees, a two-way ANOVA was performed using a 2 (group: referees, assistant referees)65 (activity category: maximal effort, high-intensity, low-intensity, active recovery, passive recovery) design with repeated measures on the last factor. For the analysis of perceptual-cognitive demands, the total number of decisions was reduced to the mean number of decisions per round as given in Table 3. Because of the non-significant number of indirect free kicks, we merged this category into the general free kick group for the statistical analysis. Also, the number of decisions that were taken in added time at the end of the first and second half were not included in this analysis. In line with Nevill et al. (2002), a chi-squared goodness-of-fit test was used to determine whether the number of observed decisions was uniformly distributed throughout the six 15 min intervals. Statistical significance was set at P 50.05 for all statistical tests. Fisher’s LSD post-hoc procedure (P 50.05) was used to further evaluate any significant effect suggested by the analyses of variance. Results Participants Table 2 presents the mean age, height, body mass and body mass index (BMI) of the participants. In addition, some basic heart rate parameters are provided, such as the heart rate at rest, the maximal heart rate during match-play and the maximal heart rate during an incremental exercise test the referees performed in an exercise laboratory in their home country. Finally, maximal heart rate is also shown using the ‘2207age in years’ rule. Of all the anthropometric measurements, only the mean difference in standing height approached the adopted level of significance (P50.06), with referees tending to be taller than assistant referees. For both groups of match officials, the mean BMI was less than the reference value of 25 (Eismann, 1996), although individual differences were apparent with values ran- ging from 20.5 to 31.4. Table 2. Anthropometric characteristics and cardiovascular responses to matches and laboratory exercise tests of the referees and assistant referees at the Euro 2000 Championship (mean+s) Referees (n = 17) Assistant referees (n = 17) Age (years) 40.2+3.9 41.3+2.8 Height (m) 1.82+0.06 1.77+0.08 Body mass (kg) 79.7+9.2 75.3+8.9 BMI (kg × m72 ) 24.2+2.6 24.0+1.7 HR at rest (beats × min71 ) 52+7 59+6 HRmax (beats × min71 ) match 179+9 181+9 laboratory 172+9 177+9 ‘2207age’ 180+4 178+3 184 Helsen and Bultynck
- 7. For heart rate, there was a significant difference between both groups for heart rate at rest (P = 0.0054), referees showing a lower heart rate than assistant referees. The maximal heart rate (range 164–200 beats × min71 ) seemed to be consistently higher during match observations than during exercise tests in the laboratory. Although the ‘2207age in years’ rule approximates, on average, the maximal heart rate, it does not hold true on an individual basis (i.e. deviations from 711 to +18 beats × min71 ). Physical load during match-play Figure 2 provides an overview of the mean physical load imposed on match officials during match-play. The overall mean for referees and assistant referees was 85+5% and 77+7% of the individual maximal heart rate, respectively. A two-way ANOVA yielded a main effect for group (F1,45 = 16.48, P 50.0002) and period (F5,225 = 10.41, P50.0001). The group6period inter- action effect was also significant (F5,225 = 5.45, P50.0001). Specifically, referees performed at a higher percentage of their HRmax than assistant referees throughout the game. This was also the case for mean heart rate, referees recording higher values (155+16 beats × min71 ) than assistant referees (140+14 beats × min71 ). For both referees and assistant referees, the physical load was higher at the beginning of the first half than at the beginning of the second half. Finally, from Fig. 3 it becomes clear that the significant interaction effect was mainly explained by a significant increase in physical workload for the referees towards the end of each half, while for the assistant referees there was a progressive decrease in heart rate to a baseline activity level that was maintained throughout the second half. In Fig. 3, the activities performed by referees and assistant referees are shown expressed as a percentage of total match time. A two-way ANOVA yielded a main effect for activity category (F4,180 = 13.27, P50.0001). The group6activity category interaction effect was also significant (F4,180 = 14.91, P50.0001). Specifically, referees appear to spend most of their efforts in the maximum effort and high-intensity categories, while assistant referees perform mostly at high and low intensity. Perceptual-cognitive demands Table 3 provides an overview of the type and number of observable decisions for all 31 matches during the final rounds of the Euro 2000 tournament. These decisions were clearly observable on video replays of the actual games. The video analysis of the obser- vable decisions revealed an acceptable intra-observer reliability of 0.98 and an inter-observer reliability of 0.96. On average, 137 observable decisions were made per match (range 104–162). The average number of decisions a referee had to make by himself was 44.4. Throw-ins made up the highest proportion of decisions a referee had to make. During the tournament, the mean number of direct free kicks was 37.3, while there were only 0.6 indirect free kicks. However, as off-side is presented as a separate category, it is not included in these indirect free kicks. Of all the decisions, 64% were based on communication with the assistant referees and/or the fourth official. Finally, the average number of decisions under the heading ‘others’ was 12.5. In added time after the second half, twice as many decisions were taken than in added time after the first half (2.6 vs 5.2). Physicalload(%HRmax) 74 76 78 80 82 84 86 88 0-15 Time (min) 15-30 30-45 45-60 60-75 75-90 Fig. 2. Physical load imposed on referees (&) and assistant referees (.) for 15 min intervals expressed as a percentage of individual maximal heart rate (mean+sx). 0 5 10 15 20 25 30 35 40 Activity categories %oftotaltime ACTIVE RECOVERY LOW INTENSITY PASSIVE RECOVERY MAXIMUM EFFORT HIGH INTENSITY Fig. 3. Activities performed during match-play by referees () and assistant referees (.) expressed as a percentage of total time (mean+sx). 185Demands of top-class refereeing
- 8. The calculated value of the chi-squared goodness-of- fit test (0.323) clearly showed that the number of observed decisions was uniformly distributed through- out the six 15 min intervals (the critical w2 value was 11.07). Discussion In this study, we used an interdisciplinary approach to gain a better understanding of both the physical and perceptual-cognitive demands of top-class soccer refer- eeing. We chose to examine the match performances of the UEFA top-class referees and assistant referees during the final rounds of the Euro 2000 Champion- ship. That the overall pattern of activities of a referee varies in parallel with the players’ actions is clear from the graphs of the heart rate recordings of the referee and of one of his assistant referees during the Euro 2000 final between France and Italy. As a result, it is not surprising that in our study referees and assistant referees are subjected to an average physical workload of approximately 85+5% and 77+7%, respectively. Reilly (1986) observed English league footballers during friendly matches and reported that they ex- ercised at an average of 80% of their HRmax. Van Meerbeek et al. (1987) found that Belgian university players exercised at 87 and 84% of their HRmax in the first and second half, respectively. Recently, Helgerud et al. (2001) reported an average increase in work intensity during a football match from 83% to 86% of HRmax after a training programme that was designed to improve aerobic endurance. In the literature (Reilly, 1996), the last 15 min of each half have been suggested to be the most frenetic periods in a game. Obviously, players do whatever they can to have an impact on the final outcome. Quite clearly, this final ‘power-play’ also affects the referees’ efforts. In our study, too, the load imposed on referees increased significantly towards the end of each half. All together, referees spend most of their efforts in the maximum effort and high-intensity categories, while assistant referees perform mostly at high and low intensity. These observations on the total distance covered, the amount of time spent at high intensity, the number of changes in activity and the physical workload, reveal that referees performing at the highest international standard show work rate profiles that are as high as, if not higher than, those of players. This may be explained by the more active behaviour the referee has to show to implement the rules of play. As D’Ottavio and Castagna (2001a) noted, players potentially have a much wider choice of undertaking high-intensity efforts ‘off the ball’ Table 3. Average number and type of observable decisions for all 31 matches during the final rounds of the Euro 2000 tournament Group Quarter Semi Final (24 games) (4 games) (2 games) (1 game) Mean Total Referees Advantage 4.1 1.8 2.5 1.0 3.6 111 Direct free kick 35.0 40.5 56.0 41.0 37.3 1156 Indirect free kick 0.7 0.3 0.5 0.0 0.6 19 Penalty 0.4 1.0 2.0 0.0 0.5 17 Simulations 2.5 1.3 2.5 2.0 2.4 73 Total 1376 Assistant referees Corner kick 10.7 8.3 13.5 15.0 10.7 332 Goal 2.8 3.5 1.5 3.0 2.8 86 Goal kick 19.5 21.3 20.0 25.0 19.9 618 Offside 6.5 6.5 7.5 11.0 6.7 208 Team changes 5.1 4.8 6.0 6.0 5.2 160 Throw-in 43.0 35.3 56.0 31.0 42.4 1315 Total 2719 Others Dropped ball 0.1 0.5 0.5 1.0 0.2 6 Red card 0.3 0.5 0.5 0.0 0.4 10 Yellow card 3.5 4.5 8.5 3.0 3.9 121 Total 136.5 4233 186 Helsen and Bultynck
- 9. than referees, who have to follow the game quite closely from beginning to end without any down time. In fact, to apply the laws of the game, match officials are expected to follow the game closely irrespective of the intensity of their previous movements because good positioning is a pre-requisite for accurate decision making. Given that the match officials at this standard of competition are on average about 15–20 years older than the professional players, they have to attain excellent age-related fitness to make the appropriate decisions and to control the game to the very end. Heart rate clearly seems to be a useful index of the physical strain imposed on match officials during games. Heart rate increases to facilitate the transport of oxygen to the working muscles. Nevertheless, heart rate can also be affected by stress mediated by the secretion of the ‘stress hormones’ adrenaline and noradrenaline. The psychological component of heart rate is illustrated by the pre-match heart rates of referees being much higher (approximately 85% HRmax) than their heart rates before the start of the second half (approximately 75% HRmax). Evidently, this increase is not only caused by the pre-match warm-up, as match officials have to be back in the dressing room approximately the same amount of time (20 min) before kick-off as during the break. As Krustrup et al. (2002) have pointed out, heart rates can be elevated beyond the normal HR–V˙ O2 relationship, during static contractions and during exercise with small muscle groups, under thermal stress and emotional stress. These findings may also explain why heart rates observed during matches are generally higher than during speed endurance or high-intensity training sessions. We have found that HRmax is consistently higher during matches and high-intensity training sessions than during exercise tests in the laboratory. In line with Krustup and Bangsbo (2001), we therefore used the peak values reached in any of the 5 s periods observed during match performances or training sessions to determine the maximal heart rate for each and every match official. It has also been shown that the ‘2207age in years’ rule approximates, on average, the maximal heart rate, but does not hold true on an individual basis. Although this rule is still used in many textbooks and fitness programmes, its use for calculat- ing work rates and for creating individual target zones should be questioned, at least for this particular age group. As also shown by Shephard (1987), the formula using the age-correction on the estimated maximal heart rate may exaggerate the ageing effect. As a wide range of physiological attributes appears to be required by referees, including high aerobic and anaerobic capacities to meet the demands of officiating a match (see Fig. 3), they need to prepare very carefully. The results of this study support the adoption of specialized intensive and intermittent training sessions by referees, which should in the main place priority on high-intensity aerobic exercise in view of the need to maintain a high work rate throughout the game. The anaerobic system, although involved to a lesser extent, also plays an important role as short and multiple periods of high-intensity activities are particularly important throughout the game (Krustrup and Bangs- bo, 2001). As training programmes have to be designed in a task-specific way, taking into consideration the differential demands, these findings are important to optimize the content of training sessions for both referees and assistant referees. In terms of perceptual-cognitive demands, a top referee makes approximately 137 observable decisions per match. Besides these decisions, which can easily be categorized using video replays, there are also ‘non- observable’ decisions (i.e. when a referee decides not to interfere with play). It is difficult to quantify these invisible decisions, but from our discussions with top- class referees and members of the UEFA referees’ committee, we speculate that non-observable decisions brings the total number of decisions to approximately 200. Given an effective playing time of approximately 56.3% or 51 min (Miyamura et al., 1997), a top-class referee takes 3–4 decisions per minute. As there are no data available for comparison in other team sports, it is not possible to verify if this workload is similar to, or higher than, that in other sports. What we do know, however, is that the number of observed decisions is uniformly distributed throughout the match. Match officials have to be completely focused from the start of a match to the very end. In addition, 64% of all decisions are based on teamwork between the match officials. In line with the results of Krustrup et al. (2002), our data also suggest that separate training programmes for referees and assistant referees are required that are in line with the specific requirements during the game. Further applications For the trainability of decision-making skills, video training offers a unique tool to assist both referees and assistant referees in controlling the game to the same high standard but with greater economy of effort. Indeed, research in industry, traffic and sport has indicated that, with increasing experience, experts ‘read the environment/game’ more efficiently, more selec- tively and more rapidly the more expert they are (Helsen and Starkes, 1999a). In similar circumstances, such as police officers making decisions under stresses of time when they intervene in potentially dangerous 187Demands of top-class refereeing
- 10. situations, video training has proven to be an appro- priate way of providing complementary experience ‘off the field’ (Helsen and Starkes, 1999b). In the same way, refereeing does have a very definite structure and cognitive demands, which account in part for what makes a top-class referee. However, research on perception and decision making of football referees is limited (Oudejans et al., 2000). For players, laboratory settings have predominantly been used in which simulated game situations have been presented as video clips (e.g. Helsen and Starkes, 1999a; Williams and Grant, 1999). To optimize the decision-making skills of referees, similar set-ups can be used. These are concerned primarily with the way in which visual information registration and processing in general, and perceptual performance in particular, can be improved. It must be stressed that it is not possible to elevate a novice referee to the level of an expert simply by perceptual imitation, or by improving his fitness alone. Although the availability of specific information is the same for different skill groups, only experienced referees can make the important relationship between informative items (e.g. a simulation or an offence) and their implications (e.g. giving advantage or a direct free kick). It is thus important to disclose the relationship between specific informative items and their sport- specific significance, which also develops their knowl- edge structure. Further research must therefore not only be directed to the disclosure of the information or knowledge that is used by experts in a specific situation, but also to the way in which it can be best transmitted. The findings of the present study suggest that a dynamic and sport-specific context is needed to adequately represent both physical and mental match- play demands. In this respect, Abernethy and Wood (2001) have recently revealed the limited contribution of general visual training programmes, which are being promoted by sports optometrists in the USA and Canada under the motto ‘Eyerobics’. They stimulate only the visual information system in non-specific and often static environmental contexts, which, in our opinion, cannot lead to more successful sports partici- pation and performance. As has been shown by Farrow and Abernethy (2002), training programmes – including anticipatory tasks and other audio-visual aids such as video and 16 mm film – may offer a fruitful alternative to improve the decision- making skills of referees and assistant referees. Conclusions This is the first study to address empirically the physical and perceptual-cognitive demands of top-class referee- ing during the final tournament of a European championship. The present results indicate that match officials are highly stressed during top matches, both physically and cognitively. Acknowledgements We would like to thank the members of the UEFA referees’ committee for their support in this project. The cooperation of the Euro 2000 match officials is gratefully acknowledged. We are also grateful to Bert De Bruyn and Tim Vanmarcke for assistance with data reduction. Finally, we wish to thank Matthew Weston and Carlo Castagna for their valuable comments on earlier drafts of the manuscript. References Abernethy, B. and Wood, J.M. (2001). Do generalised visual training programmes for sport really work? An experi- mental investigation. Journal of Sports Sciences, 19, 203– 222. Asami, T., Togari, H., and Ohashi, J. (1988). Analysis of movement patterns of referees during soccer matches. In Science and Football (edited by T. Reilly, A. Lees, K. Davids and W.J. Murphy), pp. 341–345. London: E FN Spon. Bangsbo, J. (1994a). The physiology of soccer – with special reference to intense intermittent exercise. Acta Physiologica Scandinavica, 151, suppl. 619. Bangsbo, J. (1994b). Energy demands in competitive soccer. Journal of Sports Sciences, 12, S5–S12. Bangsbo, J. (1995). Fitness Training in Football: A Scientific Approach. Bagsvaerd, Denmark: HO+Storm. Bangsbo, J., Nørregaard, L. and Thorsøe, F. (1991). Activity profile of competition soccer. International Journal of Sports Medicine, 13, 125–132. Baxter-Jones, A.D.G., Helms, P., Maffulli, N., Baines- Preece, J.C. and Preece, M. (1995). Growth and devel- opment of male gymnasts, swimmers, soccer and tennis players: a longitudinal study. Annals of Human Biology, 22, 381–394. Castagna, C. and D’Ottavio, S. (2001). Effect of maximal aerobic power on match performance in elite soccer referees. Journal of Strength and Conditioning Research, 15, 420–425. Catterall, C., Reilly, T., Atkinson, G. and Coldwells, A. (1993). Analysis of the work rates and heart rates of association football referees. British Journal of Sports Medicine, 27, 193–196. D’Ottavio, S. and Castagna, C. (2001a). Physiological load imposed on elite soccer referees during actual match play. Journal of Sports Medicine and Physical Fitness, 41, 27–32. D’Ottavio, S. and Castagna, C. (2001b). Analysis of match activities in elite soccer referees during actual match play. Journal of Strength and Conditioning Research, 15, 167–171. Drust, B., Reilly, T. and Rienzi, E. (1998). Analysis of work rate in soccer. Sports Exercise and Injury, 4, 151–155. 188 Helsen and Bultynck
- 11. Eismann, H.J. (1996). The 23rd Man: Sports Medical Advice for Football Referees. Leipzig: Gerso¨ne-Druck. Farrow, D. and Abernethy, B. (2002). Can anticipatory skills be learned through implicit video-based perceptual learn- ing? Journal of Sports Sciences, 20, 471–485. Harley, R.A., Tozer, K. and Doust, J. (1999). An analysis of movement patterns and physiological strain in relation to optimal positioning of association football referees. Journal of Sports Sciences, 17, 813. Helgerud, J., Engen, L.C., Wisloff, U. and Hoff, J. (2001). Aerobic endurance training improves soccer performance. Medicine and Science in Sports and Exercise, 33, 1925–1931. Helsen, W.F. and Starkes, J.L. (1999a). A multidimensional approach to skilled perception and performance in sport. Applied Cognitive Psychology, 13, 1–27. Helsen, W.F. and Starkes, J.L. (1999b). A new training approach to complex decision making for police officers in potentially dangerous interventions. Journal of Criminal Justice, 27, 395–410. Johnston, L. and McNaughton, L. (1994). The physiological requirements of soccer refereeing. Australian Journal of Science and Medicine in Sport, 26, 67–72. Krustrup, P. and Bangsbo, J. (2001). Physiological demands of top-class soccer refereeing in relation to physical capacity: effect of intense intermittent exercise training. Journal of Sports Sciences, 19, 881–891. Krustrup, P., Mohr, M. and Bangsbo, J. (2002). Activity profile and physiological demands of top-class soccer assistant refereeing in relation to training status. Journal of Sports Sciences, 20, 861–871. Miyamura, S., Seto, S. and Kobayashi, H. (1997). A time analysis of men’s and women’s soccer. In Science and Football III (edited by T. Reilly, J. Bangsbo and M. Hughes), pp. 251–257. London: E FN Spon. Nevill, A.M., Atkinson, G., Hughes, M.D. and Cooper, S. (2002). Statistical methods for analysing discrete and categorical data recorded in performance analysis. Journal of Sports Sciences, 20, 829–844. Oudejans, R.R.D., Verheijen, R., Bakker, F.C. et al. (2000). Errors in judging ‘offside’ in football. Nature, 404, 33. Reilly, T. (1986). Fundamental studies on soccer. In Sportwissenschaft und Sportpraxis, pp. 114–121. Hamburg: Verlag Ingrid Czwalina. Reilly, T. (1996). Motion analysis and physiological demands. In Science and Soccer (edited by T. Reilly), pp. 65–81. London: E FN Spon. Reilly, T. (1997). Energetics of high intensity exercise (soccer) with particular reference to fatigue. Journal of Sports Sciences, 15, 257–263. Reilly, T., Bangsbo, J. and Franks, A. (2000). Anthropo- metric and physiological predispositions for elite soccer. Journal of Sports Sciences, 18, 669–683. Shephard, R.J. (1987). Physical Activity and Aging, 2nd edn. London: Croom Helm. Van Meerbeek, R., Van Gool, D. and Bollens, J. (1987). Analysis of the refereeing decisions during the world soccer championship in 1986 in Mexico. In Science and Football (edited by T. Reilly, A. Lees, K. Davids and W.J. Murphy), pp. 377–382. London: E FN Spon. Weston, M. and Brewer, J. (2002). An investigation into the physiological demands of soccer refereeing. Journal of Sports Sciences, 20, 59–60. Williams, A.M. and Grant, A. (1999). Training perceptual skill in soccer. Journal of Sport and Exercise Psychology, 30, 194–220. 189Demands of top-class refereeing