
Recommended
More Related Content
What's hot
What's hot (11)
Similar to Syrian - oSTEM Poster 2016 FINAL 1
Similar to Syrian - oSTEM Poster 2016 FINAL 1 (20)
Syrian - oSTEM Poster 2016 FINAL 1
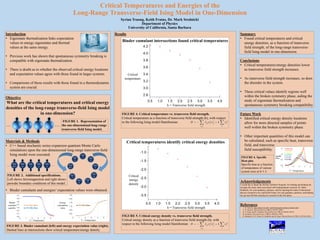
- 1. Objective What are the critical temperatures and critical energy densities of the long-range transverse-field Ising model in one-dimension? Critical Temperatures and Energies of the Long-Range Transverse-Field Ising Model in One-Dimension Syrian Truong, Keith Fratus, Dr. Mark Srednicki Department of Physics University of California, Santa Barbara Materials & Methods • C++ based stochastic series expansion quantum Monte Carlo simulations upon the one-dimensional long-range transverse-field Ising model were executed. • Binder cumulants and energies’ expectation values were obtained. Results Future Work • Identified critical energy density locations allow for more directed samples of points well within the broken symmetry phase. • Other important quantities of this model can be calculated, such as specific heat, transverse field, and transverse field susceptibility. Introduction • Eigenstate thermalization links expectation values in energy eigenstates and thermal values at the same energy. • Previous work has shown that spontaneous symmetry breaking is compatible with eigenstate thermalization. • There is doubt as to whether the observed critical energy locations and expectation values agree with those found in larger systems. • Comparisons of those results with those found in a thermodynamic system are crucial. References • A. W. Sandvik, http://physics.bu.edu/~sandvik/programs/ssebasic/ssebasic.html. • A. W. Sandvik, Physical Review E 68 (5), 056701 (2003). • K. R. Fratus and M. Srednicki, Physical Review E 92 (4), 040103 (2015). • M. Srednicki, Physical Review E 50 (2), 888-901 (1994). • R. Mondaini, K. R. Fratus, M. Srednicki and M. Rigol, Physical Review E 93 (3), 032104 (2016). Acknowledgements I would like to thank the McNair Scholars Program, for funding and helping me navigate the many tasks associated with undergraduate research; Dr. Mark Srednicki, for your guidance, patience, and for opening the realm of theoretical physics research to me; and Keith Fratus, for your guidance, patience, and helping me get into McNair and physics research in the first place. Conclusions • Critical temperatures/energy densities lower as transverse field strength increases. • As transverse field strength increases, so does the disorder in the system. • These critical values identify regions well within the broken symmetry phase, aiding the study of eigenstate thermalization and spontaneous symmetry breaking compatibility Summary • Found critical temperatures and critical energy densities, as a function of transverse field strength, of the long-range transverse- field Ising model in one-dimension. . . .. . . FIGURE 2. Additional specifications. Left shows ferromagnetism and right shows periodic boundary conditions of this model. FIGURE 1. Representation of the one-dimensional long-range transverse-field Ising model. FIGURE 3. Binder cumulant (left) and energy expectation value (right). Dashed lines at intersections show critical temperature/energy density. T = Temperature T = Temperature Binder cumulant quantity Energy expectation value Critical temperature Critical energy density h = Transverse field strength h = Transverse field strength FIGURE 4. Critical temperature vs. transverse field strength. Critical temperature as a function of transverse field strength (h), with respect to the following Ising model Hamiltonian: FIGURE 5. Critical energy density vs. transverse field strength. Critical energy density as a function of transverse field strength (h), with respect to the following Ising model Hamiltonian: T = Temperature FIGURE 6. Specific Heat plot. Specific heat as a function of temperature of various system sizes at h=1.5. Binder cumulant intersections found critical temperatures Critical temperatures identify critical energy densities N=1024 Sites N=512 Sites N=256 Sites N=128 Sites N=64 Sites N=32 Sites N=16 Sites Specific Heat N=512 Sites N=256 Sites N=512 Sites