1. Return on
Equity
YEAR 2019-20
YEAR 2020-21
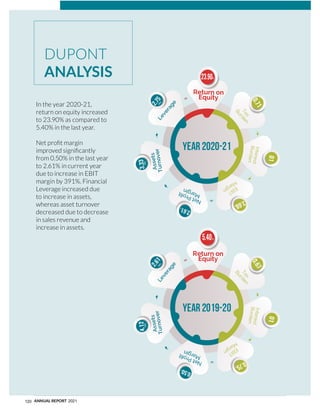
In the year 2020-21,
return on equity increased
to 23.90% as compared to
5.40% in the last year.
Net pro t margin
improved signi cantly
from 0.50% in the last year
to 2.61% in current year
due to increase in EBIT
margin by 391%. Financial
Leverage increased due
to increase in assets,
whereas asset turnover
decreased due to decrease
in sales revenue and
increase in assets.
DUPONT
ANALYSIS
120 ANNUAL REPORT 2021
2. 121
ATTOCK PETROLEUM LIMITED
KEY OPERATING AND
FINANCIAL DATA
FOR SIXYEARS FROM 2015-16 TO 2020-21
2020-21 2019-20 2018-19 2017-18 2016-17 2015-16
Pro t and Loss Summary
Sales volumes Metric Tons 1,912,823 1,907,342 2,147,038 2,488,810 2,360,529 2,034,818
Net sales Rs thousand 188,645,375 201,078,720 223,054,352 177,216,737 138,660,665 109,234,361
Gross pro t Rs thousand 9,981,941 3,637,890 8,221,167 9,743,294 7,335,321 5,749,061
Operating pro t Rs thousand 7,499,729 1,083,793 5,708,378 8,085,325 6,367,177 4,984,849
Pro t before tax Rs thousand 6,939,058 1,503,086 5,722,857 8,289,312 7,699,168 5,633,450
Pro t after tax Rs thousand 4,919,632 1,008,294 3,960,606 5,656,349 5,299,168 3,828,585
Pro t before interest, tax,
depreciation, and amortization
(EBITDA)
Rs thousand 8,567,400 2,677,291 6,314,452 8,711,258 8,046,868 5,951,622
2020-21 2019-20 2018-19 2017-18 2016-17 2015-16
Balance Sheet Summary
Share capital Rs thousand 995,328 995,328 995,328 829,440 829,440 829,440
Reserves Rs thousand 21,725,606 17,450,693 17,931,407 17,588,222 15,465,051 13,487,726
Shareholders' equity Rs thousand 22,720,934 18,446,021 18,926,735 18,417,662 16,294,491 14,317,166
Non- current liabilities
Long term lease liabilities Rs thousand 6,274,485 3,978,932 - - - -
Others Rs thousand 1,107,011 904,651 792,993 911,540 733,581 626,159
Rs thousand 7,381,496 4,883,583 792,993 911,540 733,581 626,159
Current assets
Stock in trade Rs thousand 16,121,539 9,464,503 12,865,862 12,460,539 7,234,415 4,836,653
Trade debts Rs thousand 11,025,245 13,970,178 16,838,255 16,475,576 10,801,077 6,046,556
Cash, bank balances & Short
term investments
Rs thousand 11,391,415 8,279,393 3,810,956 5,839,645 11,843,739 11,030,176
Others Rs thousand 5,672,781 3,812,064 3,587,872 3,372,804 2,620,715 4,088,455
Rs thousand 44,210,980 35,526,138 37,102,945 38,148,564 32,499,946 26,001,840
Current liabilities
Trade and other payables Rs thousand 31,179,480 27,561,324 26,633,386 26,138,159 21,061,447 15,434,650
Others Rs thousand 615,975 347,404 49,598 663,965 277,433 147,330
Rs thousand 31,795,455 27,908,728 26,682,984 26,802,124 21,338,880 15,581,980
Net current assets Rs thousand 12,415,525 7,617,410 10,419,961 11,346,440 11,161,066 10,419,860
Property, plant and equipment Rs thousand 16,616,819 13,839,661 8,348,942 6,417,787 4,339,301 3,011,665
Other non-current assets Rs thousand 1,070,086 1,872,533 950,825 1,564,975 1,527,705 1,511,800
Capital expenditure during the
year
Rs thousand 1,597,707 2,135,057 2,523,060 2,503,439 1,676,134 886,972
Total assets Rs thousand 61,897,885 51,238,332 46,402,712 46,131,326 38,366,952 30,525,305
Total liabilities Rs thousand 39,176,951 32,792,311 27,475,977 27,713,664 22,072,461 16,208,139
3. 122 ANNUAL REPORT 2021
2020-21 2019-20 2018-19 2017-18 2016-17 2015-16
Cash Flow Summary
Cash ows of operating activities Rs thousand 5,631,875 7,414,512 2,998,293 (1,030,368) 4,848,276 3,700,253
Cash ows of investing activities Rs thousand (1,177,105) (1,681,346) (1,246,624) (2,491,841) 1,046,533 3,660,211
Cash ows of nancing activities Rs thousand (1,498,680) (1,851,147) (3,492,842) (3,088,661) (3,312,880) (3,064,694)
E ect of exchange rate changes Rs thousand 1,726 (1,684) 6,500 3,822 142 698
Net change in cash and cash
equivalents
Rs thousand 2,957,816 3,880,335 (1,734,673) (6,607,048) 2,582,071 4,296,468
Cash & cash equivalents at end of the
year
Rs thousand 10,240,783 7,282,967 3,402,632 5,137,305 11,744,353 9,162,282
Free cash ows Rs thousand 3,076,028 4,740,157 475,233 (3,533,807) 3,172,142 2,813,281
PERFORMANCE INDICATORS (RATIO)
2020-21 2019-20 2018-19 2017-18 2016-17 2015-16
Pro tability and Operating Ratios
Gross pro t % 5.29 1.81 3.69 5.50 5.29 5.26
Net pro t to sales % 2.61 0.50 1.78 3.19 3.82 3.50
EBITDA margin to sales % 4.54 1.33 2.83 4.92 5.80 5.45
Operating leverage % (5,848.86) 748.42 (119.70) 27.57 136.12 (66.34)
Return on equity % 23.90 5.40 21.21 32.59 34.62 27.47
Return on capital employed % 23.80 5.38 21.21 32.59 34.62 27.47
Shareholders' Funds % 36.71 36.00 40.79 39.92 42.47 46.90
Return on Shareholders' Funds % 23.90 5.40 21.21 32.59 34.62 27.47
2020-21 2019-20 2018-19 2017-18 2016-17 2015-16
Liquidity Ratios
Current Times 1.39 1.27 1.39 1.42 1.52 1.67
Quick / Acid test ratio Times 0.88 0.93 0.90 0.96 1.18 1.36
Cash to current liabilities Times 0.32 0.26 0.13 0.19 0.55 0.59
Cash ows from operations to sales Times 0.03 0.04 0.01 (0.01) 0.03 0.03
2020-21 2019-20 2018-19 2017-18 2016-17 2015-16
Activity / Turn Over Ratios
Inventory turnover Times 13.97 17.68 16.97 17.01 21.76 19.88
No. of days in inventory 26 21 22 21 17 18
Debtors turnover Times 15.09 13.05 13.39 12.99 16.46 15.32
No. of days in receivables 24 28 27 28 22 24
Creditors turnover Times 6.08 7.29 8.14 7.10 7.20 6.64
No. of days in payables 60 50 45 51 51 55
Total assets turnover Times 3.33 4.12 4.82 4.19 4.03 3.61
Fixed assets turnover Times 12.39 18.12 30.21 32.95 37.73 40.04
Operating cycle Days (10) (1) 4 (2) (12) (13)
Number of retail outlets 738 702 662 629 604 563
4. 123
ATTOCK PETROLEUM LIMITED
2020-21 2019-20 2018-19 2017-18 2016-17 2015-16
Investment / Market Ratios
Basic and diluted EPS Rs 49.43 10.13 39.79 68.19 63.89 46.16
Basic and diluted EPS (restated) Rs 49.43 10.13 39.79 56.83 53.24 38.47
Price earning Times 6.50 30.13 7.25 8.65 9.81 9.48
Price to book Times 1.41 1.65 1.52 2.66 3.19 2.53
Dividend yield % 8.05 2.96 4.38 6.68 6.94 8.32
Dividend payout % 54.63 88.84 50.26 58.66 66.52 86.66
Dividend cover Times 1.83 1.13 1.99 1.70 1.50 1.15
Cash dividends Rs thousand 2,687,386 895,795 1,990,656 3,317,760 3,525,120 3,317,760
Cash dividend per share Rs 27.00 9.00 20.00 40.00 42.50 40.00
Bonus shares issued Rs thousand - - - 165,888 - -
Bonus per share % - - - 20 - -
Break-up value per share without surplus on
revaluation of Property plant and equipment
Rs 228.28 185.33 190.16 222.05 196.45 172.61
Break-up value per share with surplus on
revaluation of Property plant and equipment
including the e ect of all investments
Rs 228.28 185.33 190.16 222.05 196.45 172.61
Break-up value per share including
investment in related party at fair/ market
value and with surplus on revaluation of
Property plant and equipment
Rs 236.74 193.44 199.24 235.77 210.90 184.75
Market value per share
Year end Rs 321 305 289 590 626 438
Highest (during the year) Rs 390 398 633 706 765 596
Lowest (during the year) Rs 297 207 255 486 430 398
2020-21 2019-20 2018-19 2017-18 2016-17 2015-16
Capital Structure Ra os
Debt to equity % 0.27 : 99.73 0.65 : 99.35 0 : 100 0:100 0:100 0:100
Financial leverage Times 0.00 0.01 - - - -
Weighted average cost of debt % 0.64 0.93 - - - -
Interest cover Times 5,183 1,989 - - - -
Employee Produc vity Ra os
Revenue per Employee Rs thousand 404,818 430,575 494,577 438,655 385,169 344,588
Sta Turnover Ratio % 6.22 7.28 6.43 8.91 9.72 9.46
Others
Spares Inventory as %age of Assets
Cost
% 0.21 0.32 0.20 0.16 0.13 0.15
Maintenance Cost as
% of operating expenses
% 6.22 5.57 4.91 6.60 6.08 3.43
Market Share (Source: OCAC) % 9.40 10.90 10.80 9.70 9.00 8.50
7. 126 ANNUAL REPORT 2021
2016 2017 2018 2019 2020 2021
2016 2017 2018 2019 2020 2021
2016 2017 2018 2019 2020 2021
2016 2017 2018 2019 2020 2021
2016 2017 2018 2019 2020 2021
2016 2017 2018 2019 2020 2021
Rupees
in
Billion
Rupees
in
Billion
Rupees
in
Billion
Times
Percentage
Days
Profit and Loss
Cash Flows
Liquidity Ratios
Balance Sheet
Profitability Ratios
Activity Ratios
Cash flow from
operating activities
Cash flow from
investing activities
Cash flow from
financing activities Gross profit Net profit to sales EBITDA margin to sales
Current ratio Quick / Acid test ratio
Gross profit Operating profit Profit before tax Profit after tax Shareholders’ equity Net current assets Total assets Total liabilities
No. of days in inventory No. of days in receivables No. of days in payables
GRAPHICAL
PRESENTATION
8. 127
ATTOCK PETROLEUM LIMITED
37
12
47
02
03
02
Percentage
95
94
03
01
03
01
04
02
96
97
02
01
99
0
01
96
Percentage
51
56
42
02
58
40
02
57
41
02
54
36
10
51
2016 2017 2018 2019 2020 2021
Break-up value per share Market value per share (Year End)
Market Ratios
2016 2017 2018 2019 2020 2021
Rupees
Investment Ratios
Earnings per share Cash dividend per share
Rupees
Times
Turnover Ratios
Fixed assets turnover Total assets turnover
Composition of Assets
Composition of
Profit and loss
Composition of Total Liabilities
& Shareholders' Equity
Percentage
85
10
05
85
11
04
83
14
03
80
18
02
70
27
03
71
27
02
Current Assets Property, Plant and Equipment Other Non-Current Assets
Current Liabilities Non- Current Liabilities
Shareholders' Equity Expenditure Pro t Income Tax
2016 2017 2018 2019 2020 2021
40.00
42.50
40.00
20.00
9.00
10.13
27.00
49.43
438
626
590
289 305
321
173
196
222
190 185
228
9. 128 ANNUAL REPORT 2021
Total Assets Total Liabilities
Total Shareholders’ Equity Net Sales
Gross Profit Net Profit
32.79
39.18
27.48
27.71
22.07
16.21
Rupees
in
Billion
51.24
61.90
46.40
46.13
38.37
30.53
Rupees
in
Billion
Rupees
in
Billion
Rupees
in
Billion
Rupees
in
Billion
Rupees
in
Billion
18.45
22.72
18.93
18.42
16.29
14.32
201.08
188.65
223.05
177.22
138.66
109.23
3.64
8.22
9.74
9.18
7.34
5.75
1.01
3.96
5.66
5.30
4.92
3.83
10. 129
ATTOCK PETROLEUM LIMITED
COMMENTS
ON FINANCIAL
ANALYSIS
Cash ow
Cash ow from operating activities: In the year
2020-21, cash ows decreased by 24% as
compared to last year due to increase in stock in
trade as per operational requirement. Over the
last six years, cash ows remained positive, except
for the year 2017-18, due to increase in stock
level.
Cash ow from investing activities: In year 2020-
21, Company invested substantial amount in
property, plant and equipment that resulted in
negative cash ow from investing activities. In year
2015-16 and 2016-17, Cash ow from investing
activities was positive due to encashment of short
term investments.
Cash ow from nancing activities: Financing
activities, which mainly comprises of payment of
dividend and lease liabilities, was at lowest level
in year 2020-21 as compared to previous ve
years due to decrease in payment of dividend.
Further, the Company has obtained term nance
facility under SBP Salary Re nance Scheme to pay
salaries and wages to employees.
Ra os Analysis
Pro tability and operating ratios: Pro tability
ratios improved signi cantly in year 2020-21.
Gross pro t increased by 192% due to better
margins, ef cient purchase of imported product
and intelligent decision-making. This resulted in
increase in Net pro t to sales and EBITDA margin
to sales ratio. Further, these ratios uctuate over
the years due to varying margins and product
sale prices. Company sold highest volume, and
resultantly earned highest pro t in year 2017-18.
Liquidity ratios: There is slight variation in the
liquidity ratios as compared to year 2019-
20. Stock in trade increased as per operation
requirements whereas trade debts decreased.
Trade payables increased on account of import
under letter of credit facility.
Activity / Turn over ratios: Stock levels, debtors
and creditors and varying prices results in
uctuation of these ratios over the years. As
compared to last year; Inventory turnover and
No. of days in inventory changed due to variation
in stock level and cost of product sold. Debtors
turnover ratio and No. of days in receivable
changed due to uctuation in trade debts and net
sales. Creditors’ turnover decreased by 17% due
to increase in trade payables by 13%. Total assets
and xed assets turnover has decreased by 19%
and 32% respectively as compared to last year
due to decrease in net sales, signi cant investment
in construction of new storage terminals and
recognition of right-of-use assets as required
by newly implemented International Financial
Reporting Standard (IFRS) -16 “Leases”.
Investment / Market ratios: Earnings per share
improved signi cantly due to higher pro ts as
compared to last year, whereas Price earnings
ratio decreased from 30.11 times in 2019-20 to
6.50 times in 2020-21. Market value per share
stood at Rs 321, up by around 5% compared to
last year. In the year 2020-21, total cash dividend
is Rs 27.00 per share translating into dividend
payout ratio at 55%.
Capital Structure ratios: All capital requirements
are nanced through equity contribution. Further,
the Company has obtained term nance facility
under SBP Salary Re nance Scheme to pay
salaries and wages to employees.
Ver cal analysis
Balance sheet: Substantial investment in storage
terminals and recognition of right-of-use assets
as required by newly implemented International
Financial Reporting Standard (IFRS) -16 “Leases”
in the year 2020-21 and 2019-20, resulted in
11. 130 ANNUAL REPORT 2021
increase in Weightage of Property, plant and
equipment over last 05 years. Increase in prices of
petroleum products and increase in stock as per
operational requirements, resulted in an increase
in the Current Assets Weightage. In year 2020-
21, Weightage of Shareholder’s Equity and non-
current liabilities also increased due to increase
in net pro t and long term liabilities in connection
with recognition of right of use assets.
Pro t & loss: Fluctuation in prices of petroleum
products leading to inventory gains, coupled
with ef cient inventory management and better
product margins are the major factors, which
improved weightage of pro t and loss components
in the year 2020-21 as well as in the years 2016-
to-2019 as compared to 2019-20.
Horizontal Analysis
Balance sheet: Property, plant and equipment
increased by Rs 13,605 Million over the last 05
years due to investment in storage terminal and
facilities, procurement of other Capital nature
items and recognition of right-of-use assets.
Current assets comprise of stores and spares,
stock in trade, trade debts, other receivables,
short term investments and cash & bank balances.
Variation in current assets’ balances during the ve
years since 2015-16 was mainly due to uctuation
in trade debts on account of circular debts issue,
stock balances as per operational requirements
and cash & bank balances.
Non current liabilities increased in the year 2020-
21 and year 2019-20 due to increase in long term
liabilities in connection with recognition of right of
use assets.
Pro t & loss: Over the years, uctuation in sale
volumes and prices of products which depends
on international prices, resulted in varying sales
and pro ts during the years. Increase in inventory
gains resulted in favorable performance in the year
2020-21.
METHODS/ASSUMPTIONS USED TO
COMPILE THE INDICATORS:
The Company’s performance is effectively
re ected through Key Operating and Financial
Data, which is regularly reviewed by the
management to better gauge the Company’s
performance.
Pro tability ratios are the nancial benchmarks,
which are used by stakeholders to measure and
evaluate the ability of a Company to generate
pro t relative to its revenue.
Liquidity ratios are used to determine Company’s
ability to pay its obligations and re ects how
working capital is being managed over the years.
Activity ratios indicates how ef ciently the
Company is leveraging its assets to generate
revenues and cash.
Earnings per share measures the earnings of the
Company against the total outstanding shares and
dividend per share re ects dividend declared by
Company for every outstanding ordinary share.
Market price per share is the measure of
perception of the Company in the market. The
difference between book value and Market value
shows investors con dence on scrip.
RATIONAL FOR MAJOR CAPITAL
EXPENDITURES
Major capital expenditure has been incurred
for establishing bulk oil storage terminals and
construction of retail outlets, rational for the same
has been discussed in detail in Directors’ report for
the year ended June 30, 2021.
12. 131
ATTOCK PETROLEUM LIMITED
In year 2020-21, Economic Value Added (EVA) of Rs 1,880 million (Rs 18.89 per share) represents the
returns above the cost of capital, resulting from increase in Net pro t by 388% as compared to 2019-20.
STATEMENT
OF ECONOMIC
VALUE ADDED
STATEMENT OF FREE CASH FLOW
Description
2020-21 2019-20
Rs (‘000) Rs (‘000)
Net Pro t After Tax 4,919,632 1,008,294
Cost of Equity Finance (3,039,904) (2,920,395)
Economic Value Added 1,879,728 (1,912,101)
Economic Value Added Per share (Rupees) 18.89 (19.21)
Description
2020-21 2019-20
Rs (‘000) Rs (‘000)
Cash Flow From Operating Activities 5,631,875 7,414,512
Less : Capital Expenditures and Lease Liabilities Paid (2,555,847) (2,674,355)
Free Cash Flow 3,076,028 4,740,157
Composition of Cash Flow From Operations
45% 55% 36% 64%
Free Cash Flow Capital Expenditures and Lease Liabilities Paid
2019-20
2020-21
In the year 2020-21, Free cash ow decreased by 35% as compared to 2019-20 mainly due to increase in
Stock in trade as per operational requirements.
13. 132 ANNUAL REPORT 2021
Particulars
2020-21
Rs (‘000)
Education and Scholarship 5,262
Health care and Environment 721
Community Welfare 3,983
Total * 9,965
* Includes through Company’s trust
ANALYSIS OF
PERFORMANCE
AGAINST TARGETS
STATEMENT
OF CHARITY
ACCOUNT
Targetsforyear2020-21weresetdownkeepinginviewthechallengestoglobaleconomyingeneral
and oil industry in particular effecting demand caused by COVID-19 pandemic.
Gross pro t increased by 67% as compared to target mainly due to signi cant inventory gains
on account of increase in oil price. Furthermore, ef cient purchase of imported product, better
margins and intelligent decision-making led to increase in gross pro t.
Operating pro t increased by 149% due to increase in gross pro t, other income and impairment
reversal on nancial assets.
Net pro t increased by 165% due to the reasons mentioned above.
14. 133
ATTOCK PETROLEUM LIMITED
Net sales increased in fourth quarter resulting from peak in seasonal demand of High Speed Diesel (HSD)
and higher prices of petroleum products whereas net sales was lowest in second quarter due to lower
prices and demand of petroleum products.
Gross pro t and net pro t remained on higher side in rst and third quarter resulting from decrease in
cost of sales due to favorable uctuation in Oil prices whereas gross pro t and net pro t remained lowest
during second quarter due to increase in cost of products sold.
Total Fourth Quarter Third Quarter Second Quarter First Quarter
Rs (‘000) Rs (‘000) Rs (‘000) Rs (‘000) Rs (‘000)
Pro t & Loss Items
Net Sales 188,645,375 52,946,656 45,728,424 44,855,247 45,115,048
Gross Pro t 9,981,941 2,314,755 2,907,058 1,700,198 3,059,930
Pro t Before Taxation 6,939,058 1,787,789 2,156,543 862,046 2,132,680
Provision for Taxation (2,019,426) (532,197) (638,798) (201,207) (647,224)
Net Pro t 4,919,632 1,255,592 1,517,745 660,839 1,485,456
Earnings Per share (Rupees) 49.43 12.61 15.25 6.64 14.92
2020-21
Rupees
in
Million
First Quarter Second Quarter Third Quarter Fourth Quarter
Net Profit
Gross Profit
500
1000
1500
2000
2500
3000
3500
in results of interim reports with
the nal accounts
ANALYSIS OF
VARIATION
15. 134 ANNUAL REPORT 2021
2020-21 2019-20
Rs in thousand % Rs in thousand %
Gross revenue and other income 224,811,561 239,835,040
Cost of sales and operating expenses (144,336,461) (167,203,065)
Total value added 80,475,100 72,631,975
DISTRIBUTION
Employee remuneration: 1,643,692 2.04 1,174,996 1.62
Government as:
Company taxation 2,019,426 2.51 494,792 0.68
Sales tax, duties and levies 69,755,183 86.68 68,661,766 94.53
WPPF and WWF 508,825 0.63 117,922 0.16
Shareholders as:
Dividends 2,687,386 3.34 895,795 1.23
Bonus share - - - -
Society as:
Donation - - - -
Providers of nance as:
Financial Charges 1,339 0.00 756 0.00
Retained in business:
Depreciation 1,627,003 2.02 1,173,449 1.62
Net earnings 2,232,246 2.78 112,499 0.15
80,475,100 100.00 72,631,975 100.00
Government Shareholders Retained in business Employee remuneration Provider of nance Society
2019-20
2020-21
1.23% 1.62%
1.77%
95.38%
4.80%
3.34% 2.04%
89.82%
STATEMENT OF
VALUE ADDED