SlideShare a Scribd company logo
1 of 127
Download to read offline
Growth
investments
We are executing a EUR
60 million growth investment
program, which further imp-
roves our ability to supply
products with higher added
value to our customers.
Market Driven
Product Leader
Our journey towards our
vision to be a Market Driven
Product Leader is coming
along steadily.
The start of a new era
Thanks to determined work carried out across the organization in
recent years, we now have a solid foundation to build our future
success on. We are targeting growth through product leadership
and aim to take Suominen to a whole new level.
Report
2015
Annual
Suominen in brief / How we create value / Year 2015 / Business / Sustainability / Governance / Financial Statements
Contents
Suominen in brief .....................................................................	 3
How we create value ...............................................................	 5
Value chain ..................................................................................	6
Value Creation Model ...............................................................	8
Strategy .........................................................................................	10
Year 2015 .....................................................................................	 11
From the President & CEO ......................................................	12
Strategy execution – key events .............................................	15
Key figures ....................................................................................	16
Business ........................................................................................	 17
Operating environment ............................................................	18
Convenience business area ....................................................	23
Care business area .....................................................................	25
Growth investment program ..................................................	27
Sustainability ...............................................................................	 29
Sustainability strategy ................................................................	30
Social responsibility ...................................................................	32
Environmental responsibility ...................................................	35
Economic responsibility ...........................................................	37
Governance ................................................................................	 38
Corporate Governance Statement ........................................	39
Letter from the Chair of Personnel and
Remuneration Committee .....................................................	45
Remuneration Statement .........................................................	46
Board of Directors ......................................................................	50
Corporate Executive Team ......................................................	51
Financial Statements ................................................................	 52
Report by the Board of Directors ..........................................	52
Financial statements ..................................................................	61
Consolidated financial statements ...................................	62
Parent company financial statements .............................	114
Proposal by the Board of Directors
for distribution of funds .......................................................	124
Auditor’s report ...........................................................................	125
Information for shareholders...................................................	126
Suominen in brief / How we create value / Year 2015 / Business / Sustainability / Governance / Financial Statements
Sustainability
Year 2015
How we create value
Business
2 / 127
Suominen Corporation Annual Report 2015
Suominen in brief / How we create value / Year 2015 / Business / Sustainability / Governance / Financial Statements
Suominen
in brief
Suominen manufactures nonwovens as
roll goods for wipes and for hygiene prod-
ucts and medical applications. Suominen
is the global market leader in nonwovens
for wipes. The company employs over 600
people in Europe and in the Americas. The
Suominen share (SUY1V) is listed on the Nas-
daq Helsinki Stock Exchange.
Every year, Suominen
produces enough nonwovens
to cover more than 11 million
tennis courts.
Wiping products made of Suominen’s non-
wovens include, for instance, wet wipes for
personal hygiene and baby care, as well as
for household and workplace wiping. The
company’s hygiene product applications
include, for example, sanitary pads, diapers
and adult incontinence products. Surgical
drapes and swabs are examples of the medi-
cal applications.
Suominen’s locations
47	 Paulínia
	 BRAZIL
111	Nakkila
15	 Helsinki, Head office
	FINLAND
40	Cressa
98	Mozzate
	 ITALY
66	 Alicante
	 SPAIN
35	 Windsor Locks
105	Green Bay
117	Bethune
	 USA
Suominen in brief / How we create value / Year 2015 / Business / Sustainability / Governance / Financial Statements
2	Lyon
	 France
3 / 127
Suominen Corporation Annual Report 2015
Suominen in brief / How we create value / Year 2015 / Business / Sustainability / Governance / Financial StatementsSuominen in brief / How we create value / Year 2015 / Business / Sustainability / Governance / Financial Statements
Convenience
accounted for 93% of
Suominen’s net sales.
93 %
Suominen as a company
•	 The global market leader in
	 nonwovens for wipes, 9th
largest
	 of all nonwovens suppliers
•	 Two business areas:
	 Convenience and Care
•	 The Convenience business area
	 offers high value-added nonwovens 	
	 for a range of wiping applications.
•	 The Care business area provides 	
	 high-performance nonwovens for
	 use in hygiene and medical products.
Five reasons to invest in Suominen
1.	 Our production plants are located
	 on three continents, in key market
	 areas close to our customers.
2.	 We operate in growing markets.
3.	 Our customer relationships are
	 often global and long-term
	 – more than 10 years on average.
4.	 We have a clear vision and an
	 ambitious strategy to achieve it
	 – with a promising track record.
5.	 Our dividend policy is to distribute 	
	 approximately 30% of our profit for
	 the period in annual dividends.
Care accounted for 7%
of Suominen’s net sales.
7 %
Our dividend policy is to
distribute approximately
30% of our profit for the
period in annual dividends.
~30 %
Read more
> Business section
Read more at suominen.fi
> About us
> Investors
w
4 / 127
Suominen Corporation Annual Report 2015
Suominen in brief / How we create value / Year 2015 / Business / Sustainability / Governance / Financial Statements
How we create value
Our purpose is to make nonwovens continuously better for people.
At the same time, Suominen creates value through its operations for all
its stakeholders – e.g., customers, employees and shareholders. 15.9%
Return on
invested capital
(ROI) in 2015
End user
The end user of
Suominen’s nonwovens
can be either a consumer
or a professional.
Understanding the end user
– whether a consumer or a
professional – is at the heart
of Suominen’s strategy.
Suominen in brief / How we create value / Year 2015 / Business / Sustainability / Governance / Financial Statements 5 / 127
Suominen Corporation Annual Report 2015
Suominen in brief / How we create value / Year 2015 / Business / Sustainability / Governance / Financial Statements
Suominen’s value chain
Nonwovens
manufacturer,
Suominen
Brand
owner
Retailer
Consumer
Converter,
e.g., wet wipe
manufacturer
Fiber
producerPrimary
production
The divestments executed in the last few
years have clarified Suominen’s position in
the value chain. Today, Suominen is a 100%
nonwovens manufacturer and is located
midway in the value chain, between fiber
producers and end-product manufacturers
(converters) and brand owners.
Although Suominen operates business-
to-business, understanding the end user –
whether a consumer or a professional using
a product made of nonwovens – is at the
heart of our strategy. We cannot achieve our
vision to be a Market Driven Product Leader
without being able to proactively forecast
what our customers and end users will need
in the future.
Value chain
Suominen is a 100%
nonwovens manufacturer
100 %
Suominen in brief / How we create value / Year 2015 / Business / Sustainability / Governance / Financial Statements 6 / 127
Suominen Corporation Annual Report 2015
Suominen in brief / How we create value / Year 2015 / Business / Sustainability / Governance / Financial Statements
We Love Wipes aims to increase consumer awareness of
disposable nonwoven products by providing brand-free
information on the wide range of products, their different
end-use applications and various features – all in a fun and
entertaining way. And since the dialogue is two-way, We
Love Wipes provides Suominen with valuable information
about consumer needs and, in turn, enables us to de-
velop new nonwoven products with higher added value.
In 2015, Suominen boosted its utilization of consumer
data in product development and customer cooperation.
Focused, in-depth information collected through We Love
Wipes is a valuable asset for us and, therefore, we will con-
We Love Wipes, Suominen’s digital consumer dialogue
program launched back in 2013, continued in 2015.
Nowadays, the We Love Wipes community consists of
nearly 25,000 followers who are not afraid to share their
thoughts on and experiences with nonwovens products.
tinue deepening our consumer understanding in order
to find opportunities, support product development
projects and, ultimately, bring more value to our cus-
tomers.
Follow We Love Wipes
on Twitter @welovewipes and on Facebook
or see www.welovewipes.com
Case
Valuable information
through We Love Wipes
Suominen in brief / How we create value / Year 2015 / Business / Sustainability / Governance / Financial Statements 7 / 127
Suominen Corporation Annual Report 2015
Suominen in brief / How we create value / Year 2015 / Business / Sustainability / Governance / Financial Statements
Funding
• Cash flow from operations
(EUR 27.3 million)
• Total liabilities (EUR 166.0 million)
• Hybrid bond and equity
(EUR 125.7 million)
Natural resources
• Water (5,542,291 m3
)
• Raw materials (138,215 tons)
Wood-based
Oil-based
• Energy (1,683,166 GJ)
Natural gas
Grid electricity
Steam
People
• Over 600 employees
• Employee training (EUR 122,902)
Intellectual capabilities
• Suominen brand
• The Suominen Way
• R&D
• Patents
• Professional & leadership capabilities
• ICT systems
Social relationships
• Customer relations
• R&D cooperation with stakeholders
• Consumer dialogue
• Suppliers
• Manufacturing partners
• Local communities
• Professional networks
Manufacturing platform
• Eight production plants
• Geographically and technically
broad manufacturing base
Customers
• Accelerated business
• Improved product performance
• Suominen brand value
• Customer satisfaction
Employees
• Wages and salaries (EUR 34.8 million)
• Professional development
• Striving for non-discrimination
and equal opportunities
• Safe workplace (AFR 8.29)
Partners
• Payments (EUR 322.3 million)
• Business growth
• Ethical business
Shareholders
• Funds paid (EUR 0.01 per share)
• Market value increase (53% in 2015)
Environment
• Waste and emissions load from
operations and end-products
• Compostable and dispersible
end-products
• No untreated water
Society
• More convenient lifestyle
• Improved hygiene
• Contribution to reducing the
number of infections
• Corporate income taxes paid
(EUR 8.3 million)
• Employment
Products & solutions
• Nonwovens for wipes,
hygiene products and
medical applications
• Product development
(Six new branded products in 2015)
Brands
• We Love Wipes
• Product brands
Waste & emissions
• Direct and indirect greenhouse
gas emissions (140,774 tons)
• Waste to landfill (916 tons)
• Treated water from operations
Vision:
Market Driven Product Leader
Strategy:
1.	 Deliver superior value in thoughtfully
selected market applications
2.	 Drive proactive key account manage-
ment for mutual value creation
3.	 Execute demand-driven supply chain
4.	 Evolve culture and capabilities to
build a strong product company
Our purpose is to make nonwovens
continuously better for people.
Emerging global middle class
Aging population
Population growth
Rising healthcare expenditure
Growing consciousness of health
Legislation
Resources Strategy and operating environment Outputs Impacts
Value Creation Model
Information concerning year 2015 in brackets.
Suominen in brief / How we create value / Year 2015 / Business / Sustainability / Governance / Financial Statements 8 / 127
Suominen Corporation Annual Report 2015
Suominen in brief / How we create value / Year 2015 / Business / Sustainability / Governance / Financial Statements
How does the Model work?
Suominen’s Value Creation Model depicts
our whole value creation process: what kind
of resources we utilize in executing our strat-
egy, what are the outputs and, ultimately,
the impacts of our business activities. The
Model reflects Suominen’s intent to gradu-
ally progress towards so-called integrated
reporting scheme.
The Value Creation Model is basically our
business model in a nutshell, which means
that only the most essential matters are
listed. Still, not all listed matters bear equal
importance, nor is their respective relevance
presented in the model. That’s why the mod-
el should be considered primarily as a whole.
In the Value Creation Model, Resources
are what we utilize in our business activities.
The Strategy section describes the heart
of Suominen’s business together with some
of the external drivers, such as megatrends,
that may have an impact on our operating
environment.
Outputsarewhatcomesoutofourbusiness
activities. Impacts describe how our business
activities and our outputs affect the world
around us.
Suominen in brief / How we create value / Year 2015 / Business / Sustainability / Governance / Financial Statements 9 / 127
Suominen Corporation Annual Report 2015
Suominen in brief / How we create value / Year 2015 / Business / Sustainability / Governance / Financial Statements
Vision – where?
Strategy – how?
Financial targets
• Deliver superior value in thoughtfully selected market applications
• Drive proactive key account management for mutual value creation
• Execute demand-driven supply chain
• Evolve culture and capabilities to build a strong product company
Market Driven
Product Leader
• Organic net sales growth at a rate that
	 exceeds the industry average (approx. 3%)
• A return on investment of more than 12%
• A gearing ratio between 40% and 80%
Purpose – why? Our purpose is to make nonwovens continuously better for people
Vision – where?
Our vision, to be a Market
Driven Product Leader, re-
flects where Suominen is
headed and what we want
to be at the end of this strat-
egy period.
Strategy – how?
Our strategy defines how
Suominen will achieve its vi-
sion and the targets set for
this strategy period. In the
execution of the strategy,
we will focus on develop-
ing four key areas.
If we succeed in the ex-
ecution of our strategy,
Strategy 2015–2017
Read more at
suominen.fi
> About Us / Strategy
w
Read more
> Business section
> From the President & CEO
Suominen’s net sales will
amount to approximately
EUR 500 million by the end
of 2017.
Purpose – why?
Suominen’s purpose is to
make nonwovens continu-
ously better for people. It is
the reason for our existence
and the foundation of eve-
rything we do at Suominen.
It tells us what we actually
work for. Therefore, it is also
a fundamental part of our
strategies – the previous,
current and next one as well.
Suominen in brief / How we create value / Year 2015 / Business / Sustainability / Governance / Financial Statements 10 / 127
Suominen Corporation Annual Report 2015
Suominen in brief / How we create value / Year 2015 / Business / Sustainability / Governance / Financial StatementsSuominen in brief / How we create value / Year 2015 / Business / Sustainability / Governance / Financial Statements
60 Estimated value of
Suominen’s growth
investment program
Year 2015
After a successful turnaround, Suominen is moving forward and aiming for
growth. The positive trend in Suominen’s financial development continued in
2015 and, as our investments in production technology and improvements in
product development capability and capacity demonstrate, the implementation
of our strategy is progressing as scheduled.
EUR
million
Darryl Fournier
Plant Manager,
Bethune, SC,
USA
The Bethune investment
is the most significant project
in Suominen’s growth
investment program.
11 / 127
Suominen Corporation Annual Report 2015
Suominen in brief / How we create value / Year 2015 / Business / Sustainability / Governance / Financial Statements
Nina Kopola
President & CEO
Year 2015 marked the start of a new era at
Suominen. Thanks to determined work car-
ried out across the organization in recent
years, we have turned the business around
and now have a solid foundation to build
our future success on. As stated in our strat-
egy for 2015–2017, we are targeting growth
through product leadership and, indeed, aim
to take Suominen to a whole new level.
Favorable development
on three continents
In light of the consumer confidence indices,
the operating environment remained quite
From the President & CEO
Becoming a Market
Driven Product Leader
Suominen in brief / How we create value / Year 2015 / Business / Sustainability / Governance / Financial Statements 12 / 127
Suominen Corporation Annual Report 2015
Suominen in brief / How we create value / Year 2015 / Business / Sustainability / Governance / Financial Statements
healthy in our main market areas of Europe
and North America. In South America, in Bra-
zil in particular, the brisk economic growth
seen in recent years took a downward turn.
This has not damaged our business in the
area, however, since demand for nonwo-
ven products is not very cyclical. As of the
acquisition of the Paulínia plant in Brazil in
early 2014, we have progressed in the South
American markets as planned.
Profitability improved, dividend
proposal EUR 0.02 per share
Suominen’s financial development in 2015
corresponded with our positive outlook
statement issued on October 2015, even
though the last quarter of the year fell short
of expectations. In 2015, our net sales grew
by 10.5% to EUR 444.0 million, supported
by the strengthening of the US dollar. Our
operating profit margin increased to 7.0%.
Our cash flow from operations remained
strong, as we expected, at EUR 27.3 million.
Suominen’s net profit for 2015 amounted to
EUR 17.0 million, corresponding to earnings
per share of EUR 0.06.
The Board of Directors of
Suominen proposes to the Annual
General Meeting a dividend of
EUR 0.02 per share to be paid for
the financial year 2015.
The proposal is in line with the dividend
policy issued by the Board of Directors in
the fall of 2014.
As the financial figures demonstrate,
Suominen’s turnaround has been successful.
It has also been recognized by the investor
community: At the end of 2015, Suominen’s
market capitalization amounted to EUR 312
million and Nasdaq Helsinki transferred
Suominen from the Small Cap segment to
Mid Cap as of 4 January 2016.
Strategy execution:
solid progress on all fronts
I am very delighted with Suominen team’s
ability to take significant steps to imple-
ment the growth strategy during 2015. Our
strategy includes four focus areas – supe-
rior product offering, proactive key account
management, demand-driven supply chain,
and strong corporate culture and capabilities
– and we have executed important activities
within each of them.
If I were to select a few highlights from
the past year, I would naturally bring forth the
determined progress in our EUR 60 million
growth investment program and the persis-
tent work done to enhance the product de-
velopment process.
Largest organic investment in Suominen’s
history to be implemented in Bethune
Our growth investment program was, in fact,
launched already in late 2014 with the an-
nouncement of three initiatives at our plants
in Paulínia, Brazil; Alicante, Spain, and Nak-
kila, Finland, with a total value of some EUR
4 million. At Paulínia and Alicante, we made
improvements to existing lines, allowing us
to broaden our product offering to non-
wovens with higher added value, such as
nonwovens for medical applications. At the
Nakkila plant, we restarted a production line
that was closed down in 2012, thus enabling
us to meet the improved demand in the Eu-
ropean market.
And the good news continued into Janu-
ary 2015, when we disclosed the single larg-
est initiative in the entire growth investment
program: a plan to build a new production
line in North America.
The decision was made
to install the new production line,
with a total value of close to
EUR 50 million, at our Bethune
plant in South Carolina, USA.
With this investment, Suominen will take
wetlaid technology to a whole new level in
the nonwovens industry. The new manu-
facturing line will be tailor-made, based on
our unique technological expertise, enabling
us to supply our customers with exclusive,
best-in-class nonwoven products. This is
perfectly in line with our strategic intent to
achieve product leadership.
In September 2015, we decided to raise
the total value of the growth investment pro-
gram to EUR 60 million from the original
range of EUR 30–50 million, thanks to the
Suominen in brief / How we create value / Year 2015 / Business / Sustainability / Governance / Financial Statements 13 / 127
Suominen Corporation Annual Report 2015
Suominen in brief / How we create value / Year 2015 / Business / Sustainability / Governance / Financial Statements
promising growth prospects identified in
nonwovens with higher added value.
Suominen Innovation
Machine up and running
During 2015, we made numerous efforts to
improve our product development process.
We enhanced our product development ca-
pabilities by building the Suominen Innova-
tion Machine – a full product development
process with a strong focus on front-end in-
novations and a formal Stage-and-Gate pro-
cedure to ensure that ideas are transformed
into commercial products as efficiently as
possible. On the other hand, the fairly strict
Stage-and-Gate procedure allows us also
to “fail fast” in product development – that
is, to terminate development projects early
enough if set criteria are not met. Having a
firm process for terminating projects with
an uncertain outlook enables us to allocate
resources to those initiatives that have more
promising opportunities for success.
In addition to enhancing our capabilities,
we improved our product development ca-
pacity by making several important recruit-
ments to the Product Development team.
We estimate that our
strong focus on R&D will be
reflected also in R&D spending,
which is forecasted to increase
above 1% of our net sales
(0.8% in 2015).
The efforts made in Suominen’s product
development started to bear fruit already in
2015. Suominen launched a total of six new
branded products in the market: five in our
emerging Care business area and one in
Convenience. The launches reflect our de-
termination to grow the business and make
our product leadership vision a reality.
Suominen implements blind hiring
process as a forerunner in the industry
As stated in our sustainability strategy, we are
focusing our sustainability activities on three
areas: product leadership, sustainable opera-
tions and responsible value chain. We have
initiated activities under all three themes, and
this work continues in 2016.
In 2015, Suominen launched an impor-
tant initiative to promote diversity and equal
opportunities in the company.
We have clearly expressed in our Code
of Conduct that at Suominen, we will not
discriminate against anyone for any reason
and have committed to act as a fair employer
in all circumstances.
As a concrete measure, we wanted to find
ways to ensure that – often unconscious –
biases do not affect the hiring process at
Suominen.
We decided to pilot so-called
blind hiring in fall of 2015.
In blind hiring, the applicant’s name and
other personal data are hidden, and the re-
cruiter can focus on the relevant factors,
such as the candidate’s experience and ex-
pertise; not, for example, on their gender
or ethnic origin. The pilot recruitment was
successful and we aim to have blind hiring
as the default approach in recruiting across
Suominen in 2016. I see this as a prime ex-
ample of our pragmatic, results-oriented ap-
proach to sustainability.
To those behind our success
The end of 2015 also wraps up the first leg
of our three-year strategy period. Suominen
made great progress and we continue to
climb towards our vision of being a Market
Driven Product Leader. Making this ambi-
tious vision come true will definitely chal-
lenge us at Suominen in many ways in the
years to come, but I am confident that with
our determined and talented team of ex-
perts, it is well within our reach.
I send my sincere thanks to the entire
Suominen team for your great commit-
ment and can-do attitude. I would also like
to warmly thank our customers, business
partners and shareholders for their sustained
confidence in us and our endeavors.
We at Suominen are continuing towards
our vision and we warmly welcome you to
join us on this journey.
Nina Kopola
President & CEO
Suominen in brief / How we create value / Year 2015 / Business / Sustainability / Governance / Financial Statements 14 / 127
Suominen Corporation Annual Report 2015
Suominen in brief / How we create value / Year 2015 / Business / Sustainability / Governance / Financial Statements
Year of steadfast strategy execution
16 January Suominen
launc­hed FIBRELLA®
Lite
on the global hygiene mar-
ket. It combines traditional-
ly incompatible nonwoven
features – such as softness,
strength and light weight –
in one material.
28 January As the
forerunner in the nonwo-
vens industry, Suominen
introduced HYDRASPUN®
Dispersible Plus, the next-
generation nonwoven for
the growing market of
flushable applications.
30 January As a key step
in its growth investment
program, Suominen started
a planning process for an
investment in a new wetlaid
production line. The invest-
Year of steadfast strategy execution
All Suominen’s releases published in 2015
can be found at www.suominen.fi.
w
ment will be the single larg-
est initiative in Suominen’s
growth investment program.
3 March Suominen intro-
duced FIBRELLA®
Perf to
the emerging South Ameri-
can market of medical
nonwovens. The product is
suitable for both traditional
and advanced wound care
as well as for surgical ap-
plications.
19 March The Annual
General Meeting of
Suominen decided, among
other things, to distribute
a total of EUR 2.5 million
in funds to Suominen’s
shareholders. This was
the first time Suominen’s
shareholders were paid
funds since 2010.
27 May Suominen con-
firmed the plan to invest in
a new production line at
its Bethune plant in South
Carolina, USA. In the first
phase, the new line will
focus on nonwovens for
household, workplace and
flushable wipes.
1 September Suominen
decided to extend its
growth investment pro-
gram to EUR 60 million.
Originally, the total value of
the program was estimated
to be in the range of EUR
30–50 million. The value of
the investment in the USA
was specified to be close
to EUR 50 million.
6 October Ernesto Levy
was appointed Senior
Vice President, Conveni-
ence business area and a
member of Suominen’s
Corporate Executive Team.
Thanks to his background
in leading consumer brand
companies, Mr. Levy brings
complementary com-
petencies to Suominen’s
leadership team.
26 October Suominen
specified its guidance
regarding the growth of
operating profit. Suominen
stated that its operating
profit from continuing
operations excluding non-
recurring items for 2015
would improve markedly
from the level of 2014.
27 October Suominen
launched the FIBRELLA®
Move nonwoven, a state-
ment product raising the
bar of expectations for
materials used in feminine
care and other absorbent
hygiene applications.
16 November Suominen
launched FIBRELLA®
Zorb
and FIBRELLA®
Zorb+
nonwoven products for
use in critical surgical care
applications in operating
rooms and hospitals, bring-
ing high value-added ben-
efits to both Suominen’s
customers and patients.
In 2015, Suominen
focused on execut-
ing its EUR 60 mil-
lion growth invest-
ment program and
introducing new
nonwoven products
with higher added
value in its portfolio.
Suominen in brief / How we create value / Year 2015 / Business / Sustainability / Governance / Financial Statements 15 / 127
Suominen Corporation Annual Report 2015
Suominen in brief / How we create value / Year 2015 / Business / Sustainability / Governance / Financial Statements
Key figures
2015 2014 2013
Net sales, EUR million 444.0 401.8 373.7
Operating profit excl. non-recurring items, EUR million 31.2 26.9 19.4
Profit for the period, EUR million 17.0 10.2 5.7
Earnings per share, EUR 0.06 0.04 0.02
Cash flow from operations, EUR million 27.3 37.1 21.3
Cash flow per share, EUR 0.11 0.15 0.09
2015 2014 2013
Gross capital expenditure, EUR million 23.7 7.1 4.4
Equity ratio, % 43.2 41.2 32.9
Equity per share, EUR 0.50 0.44 0.32
Gearing, % 25.9 34.7 96.2
Return on invested capital (ROI), % 15.9 15.7 12.4
Average personnel 614 591 550
Financial targets
Growth
Suominen aims to increase its
net sales organically at a rate that
exceeds the average growth rate of
the industry (approximately 3%).
Profitability
Suominen aims to improve its
relative profitability. The target level of
the company’s return on investment
(ROI) is to be above 12%.
Capital structure
Suominen aims to have a solid capital
structure with a gearing ratio principally
between 40% and 80%.
Orange lines indicate the target level.
Figures refer to continuing operations unless otherwise stated.
Suominen in brief / How we create value / Year 2015 / Business / Sustainability / Governance / Financial Statements
10%
8%
6%
4%
2%
0%
Net sales,
EUR million
500 –
400 –
300 –
200 –
100 –
0 –
13 14 15
Organic growth %
373.7
401.8
444.0
Operating profit excl.
non-recurring items,
EUR million
35 –
30 –
25 –
20 –
15 –
10 –
5 –
0 –
13 14 15
19.4
26.9
31.2
Equity ratio, %
50 –
40 –
30 –
20 –
10 –
0 –
13 14 15
32.9
41.2
43.2
Equity per share, EUR
0.60 –
0.50 –
0.40 –
0.30 –
0.20 –
0.10 –
0.00 –
13 14 15
0.32
0.44
0.50
Return on invested
capital (ROI), %
20 –
15 –
10 –
5 –
0 –
13 14 15
12.4
15.7 15.9
Average personnel
700 –
600 –
500 –
400 –
300 –
200 –
100 –
0 –
13 14 15
550
591 614
Gearing, %
120 –
100 –
80 –
60 –
40 –
20 –
0 –
13 14 15
96.2
34.7
25.9
Profit for the period
and earnings per share,
EUR million EUR
20 –
15 –
10 –
5 –
0 –
0,06
0,04
0,02
0
13 14 15
Earnings per share, EUR
5.7
10.2
17.0
Gross capital expenditure,
EUR million
25 –
20 –
15 –
10 –
5 –
0 –
13 14 15
4.4
7.1
23.7
Cash flow from operations
and cash flow per share,
EUR million
40 –
35 –
30 –
25 –
20 –
15 –
10 –
5 –
0 –
13 14 15
0.16
0.14
0.12
0.10
0.08
0.06
0.04
0.02
0
Cash flow per share, EUR
21.3
37.1
27.3
16 / 127
Suominen Corporation Annual Report 2015
Suominen in brief / How we create value / Year 2015 / Business / Sustainability / Governance / Financial Statements
444.0EUR
million
Net sales
in 2015
Marjo Kuisma
Product Manager,
Hygiene
In nonwovens for wipes,
we are the global market
leader, while in the medi-
cal and hygiene markets,
Suominen is a challenger.
Business
Suominen has two business areas: Convenience and Care.
Although the scope of their operations might be different today, they
nevertheless share many megatrends, raw materials, technologies and
employee capabilities. Moreover, the product features may often be
similar – after all, nearly all our products eventually touch human skin.
Suominen in brief / How we create value / Year 2015 / Business / Sustainability / Governance / Financial Statements 17 / 127
Suominen Corporation Annual Report 2015
Suominen in brief / How we create value / Year 2015 / Business / Sustainability / Governance / Financial Statements
The global nonwovens market totals
approximately 26 billion euros. It is a huge
market but, on the other hand, a very frag-
mented one, since nonwovens are used in
a vast number of applications.
Suominen has chosen three market
segments where it operates:
1. Wiping 2. Medical 3. Hygiene
Suominen is the ninth-largest of all non-
wovens suppliers. In nonwovens for wipes,
we are the global market leader, while in the
medical and hygiene markets, Suominen is
a challenger.
These three market segments are not
very cyclical in nature, which separates them
from, for example, the automotive and build-
ing segments of the nonwovens market.
Of the large hygiene market, it is worth
noting that approximately one fifth of it is
within our reach. Suominen concentrates
only on producing carefully selected non-
woven components with higher added value
for hygiene products.
Demand for nonwovens for wiping, medi-
cal and hygiene applications is driven by the
same megatrends, which are discussed in
more detail below. The same raw materials,
Operating environment
technologies and employee capabilities are
utilized in all three market segments, and the
features required of the products in these
segments are often quite similar. Nearly all
Suominen’s products eventually touch hu-
man skin.
Suominen’s main market areas are Europe
and North America. We also have a foothold
in the growing South American markets. In
these areas, demand for nonwovens used in
wipes and in hygiene and medical products
is increasing at an annual rate of some 3% in
Suominen’s selected segments. Exceeding
this average growth rate organically is one
of the financial targets of our strategy for
2015–2017.
Other
27%
Upholstery
10%
Building/
roofing
7%
Filtration
9%
Floor
coverings
6%
Automotive
5%
Key competitors
•	 Kimberly-Clark
•	 Berry Plastics (ex-PGI)
•	 Fiberweb
•	 First Quality Nonwovens
•	 Pegas Nonwovens
Hygiene 25%
Key competitors
•	 Kimberly-Clark
•	 Ahlstrom
•	 Freudenberg
•	 DuPont
•	 First Quality Nonwovens
Medical 3%
Wiping
8%
Suominen in brief / How we create value / Year 2015 / Business / Sustainability / Governance / Financial Statements
Global nonwovens
market totals approx.
EUR 26 billion
Others ~50%
Half of the market fragmented
to smaller players
•	 Kimberly-Clark
•	 Jacom Holm / Sontara
•	 Sandler
•	 Berry Plastics (ex-PGI)
Key competitors ~30%
Wiping
market totals approx.
EUR 2.1 billion
Suominen
~20%
18 / 127
Suominen Corporation Annual Report 2015
Suominen in brief / How we create value / Year 2015 / Business / Sustainability / Governance / Financial Statements
In Asia and Africa, annual growth in the
nonwovens markets averages 7 to 8%. One
might ask, why is Suominen not operating
on those market areas as well? The answer
is: Because extending our geographical
reach to new areas is not in our focus during
this strategy period. We know that successful
business in those areas requires both a local
footprint and focus. Our focus is currently on
our existing geographical markets and on
organic growth, i.e. growth achieved without
acquisitions.
Growth in demand for
nonwovens depends mostly
on consumer demand.
Consumer demand is a combination of
the general economic situation and consum-
ers’ confidence in the development of their
personal finances. However, demand for fast-
moving consumer goods – that is, end-prod-
ucts for which most of Suominen’s products
are used – is not very cyclical in nature.
Annual forecasted growth rates of demand for nonwovens
used in wipes and in hygiene and medical products
	 Suominen’s market areas
+2 %
+2–6 %
+8 %
+7 %
+7 %
Suominen in brief / How we create value / Year 2015 / Business / Sustainability / Governance / Financial Statements 19 / 127
Suominen Corporation Annual Report 2015
Suominen in brief / How we create value / Year 2015 / Business / Sustainability / Governance / Financial Statements
Suominen has operated on the Brazilian market since
the acquisition of the Paulínia plant in Brazil in early
2014. The development of our business there has been
favorable all along.
Brazil – and South America in general – is still an emerging
market for nonwovens. While baby care is the principal
end-use category for wiping nonwovens today, other
wiping applications as well as medical nonwovens are
expected to gain market share in the near future.
In general, even though the Brazilian economy was
on a downward trajectory through 2015, we did not
see this in our local business. This makes Brazil a good
example illustrating that the general economic situation
doesn’t always tell the whole story about the demand
for nonwovens. Once consumers adopt a nonwoven
convenience product, a baby wipe for example, they will
not easily abandon it. All in all, having a modern produc-
tion plant in Brazil serving the entire South American
continent is an essential asset for Suominen.
Case
Favorable
development
in Brazil
Suominen in brief / How we create value / Year 2015 / Business / Sustainability / Governance / Financial Statements 20 / 127
Suominen Corporation Annual Report 2015
Suominen in brief / How we create value / Year 2015 / Business / Sustainability / Governance / Financial Statements
Megatrends change the world
– and the business
Megatrends are global changes that pro-
foundly transform societies over a long
period of time. Many of them are bol-
stering our business and consequently
boosting our growth forecasts, thanks to
their impact on consumer behavior.
They include:
•	 Population growth
•	 Growing global middle class
•	 Aging population
•	 Rising healthcare expenditure
•	 Increasing consciousness
	 of health and well-being
There is a direct correlation between the
rise in the standard of living and, for example,
demand for hygiene products. According to
various industry sources, an increase in gross
domestic product (GDP) to only approxi-
mately USD 1,000 per capita could spark
demand for disposable sanitary napkins.
When the GDP rises to roughly USD 4,000
per capita, demand extends to disposable
diapers and, with further increases, to other
daily hygiene and convenience products.
Demand for
nonwovens
increases as
the standard
of living
climbs higher
GDP
per capita
USD
Feminine care
products
1,000 +
Disposable
diapers
4,000 +
Baby
wipes
7,000 +
Household
wipes
14,000 +
Incontinence
products
10,000 +
Suominen in brief / How we create value / Year 2015 / Business / Sustainability / Governance / Financial Statements 21 / 127
Suominen Corporation Annual Report 2015
Suominen in brief / How we create value / Year 2015 / Business / Sustainability / Governance / Financial Statements
The global middle class, the segment of
the population with an annual income of
between USD 3,000–20,000, is set to be-
come the consumer group with the highest
purchasing power in the world in the near
future. It has been estimated that by 2020,
2.1 billion people will make up the global
middle class.
The rise in the standard of living combined
with evolving lifestyles will be reflected in the
consumer behavior of the prospering mid-
dle class. In addition to essential commodi-
ties, the consumption of this demographic
will center around solutions that make daily
routines easier and less time-consuming.
The use of disposable household wipes
and beauty care wipes are examples of this
phenomenon.
With the aging of the population and
changing healthcare models, new needs
are emerging and demand for nonwovens
used in, for example, medical applications
and incontinence products is increasing.
By 2050,
people over the age of 60
will make up slightly more
than 20% of the global
population.*
In 2000, this demographic accounted for
only 10% of the population.
The average age of the population is in-
creasing especially in industrialized coun-
tries. At the same time, the aging population
is staying active for longer, which increases
the need for, for example, incontinence
products. On the other hand, the need to
find cost-effective solutions to combat hos-
pital-acquired infections and various pan-
demics is also contributing to the increase
in demand for nonwovens.
Aging, pandemics and changing health-
care models are reflected in the rising health-
care expenditure. On the other hand, cash
flows related to healthcare are increasing as
a result of consumers’ interest in enhancing
their well-being and health. The overall ex-
penditure in healthcare is expected to dou-
ble between 2010 and 2020.
* UN report: World Population Ageing 1950–2050.
2015 20202010
USD
7.3
billion
USD
10.3
billion
USD
14.7
billion
Global
middle
class
Affluent
potentials
Elite
2.1 3.40.5
USD
11.5
trillion
USD
4.1
trillion
USD
13.1
trillion
billion people
Global expenditure
on health
Estimated aggregate
demand in 2020
People over 65 years
2015 20202010
522
million
599
million
712
million
+4.4 USD
billion
+113 million
28.7USD
trillion
Suominen in brief / How we create value / Year 2015 / Business / Sustainability / Governance / Financial Statements 22 / 127
Suominen Corporation Annual Report 2015
Suominen in brief / How we create value / Year 2015 / Business / Sustainability / Governance / Financial Statements
Suominen is the global market leader in non-
wovens for wipes. The applications for our
nonwovens for wipes are:
•	 Baby care (40% of Suominen’s total
	 net sales in 2015)
•	 Personal care, including flushable 	
	 products (22%)
•	 Household care (17%)
•	 Workplace applications, e.g., in
	 healthcare and food service (11%).
The customers of Convenience include
global consumer brands, manufacturers of
private labels and regional nonwoven convert-
ers. Our customer relationships are typically
very long, on average more than ten years.
Convenience in 2015
The net sales of the Convenience busi-
ness area totaled EUR 411.5 million in 2015
(EUR 369.4 million in 2014). The 11% net sales
growth was mostly due to the strengthening
of the US dollar compared to the euro.
2015 was a year of growth investments for
Suominen as we had initiatives underway at
several production plants. The investment
will benefit both business areas.
•	 We added capacity in Nakkila by 	
	 restarting a production line that
	 was shut down in 2012.
•	 We invested in new capabilities
	 in our production lines in Alicante
	 and Paulínia in order to expand our 	
	 product offering.
•	 The major investment in a new
	 wetlaid production line in Bethune
	 was kicked off in fall of 2015.
These investments demonstrate our
commitment to continued consumer-driv-
en innovation in order to become a Market
Driven Product Leader. For more information
on the investments, please take a look at the
Growth investment program section.
We also stepped up our pace in driving
proactive key account management, just like
Suominen’s strategy suggests. For example,
we organized the first ever Suominen Sym-
posium for our European customers. This
product-oriented event focused on innova-
tion and leadership in nonwovens and was
only the first in our series of similar initiatives
worldwide.
In 2015, we launched HYDRASPUN®
Dis-
persible Plus in the global wipes market, taking
flushable nonwovens to a whole new level.
This is a good example of Suominen’s market-
driven innovation, which, for its part, is crucial
as we leverage the growing markets. As the
best flushable nonwoven product available to-
day, HYDRASPUN®
Dispersible Plus responds
to worldwide regulatory changes calling for
products that will not clog waste-water sys-
tems. It is yet another product in our portfolio
of flushable substrates that we have been de-
veloping as pioneers in the industry.
In fact, it was our people
who invented flushable
nonwovens and introduced
them to the wiping world
already in the 1990s.
Convenience outlook
The main market areas for Convenience
are North America and Europe, and we
also have a foothold in the promising South
American market, thanks to the acquisition
of the Paulínia plant in Brazil in early 2014.
The outlook for the Convenience busi-
ness area is auspicious, as demand for non-
wovens used in wiping products is projected
to increase in all market areas.
Convenience business area
The Convenience business area offers high value-added nonwovens for a range
of wiping applications and for travel and catering products. In 2015, the business
area accounted for 93% of Suominen’s total net sales.
Net sales in 2015,
Convenience411.5 EUR
million
Suominen in brief / How we create value / Year 2015 / Business / Sustainability / Governance / Financial Statements 23 / 127
Suominen Corporation Annual Report 2015
Suominen in brief / How we create value / Year 2015 / Business / Sustainability / Governance / Financial Statements
The forecasted growth varies, however,
across applications. For instance, the growth
rate in nonwovens for baby wipes is around
2% in our main market areas, reflecting the
relative maturity of these markets. On the
other hand, the forecasted growth rates in
nonwovens for flushable wipes, for example,
are as high as 9% in the same geographical
areas.
Growth rates may vary widely also across
market areas. This is visibly illustrated in non-
wovens for household wipes, as the growth
rate for the application is projected to be 2% in
Europe, but 7% in North America. The variation
in estimated growth rates indicates, among
other things, that the market for disposable
household wipes is still emerging in Europe.
The conditions for growth are favorable,
as the appreciation of a healthy lifestyle,
well-being and a high level of personal hy-
giene, as well as efforts to achieve everyday
comfort and convenience are global meg-
atrends that are gaining momentum.
For the Convenience
business area, the name of the
game is higher added value
for customers.
In line with Suominen’s strategy, Conveni-
ence will continue to seek growth especially
in applications where our product leadership
is established and where we have the oppor-
tunity to create higher added value. We trust
in our capabilities of profound consumer un-
derstanding, value-adding key account man-
agement and innovation, which, combined
with our global manufacturing footprint and
supply chain, will help us bring even better
products and knowledge to the market. In
the near future, our focus will be on boost-
ing our product development as well as en-
hancing and harmonizing our services and
internal processes.
North America Europe South America
Baby wiping 2% 2% 5%
Personal care wiping 6% 6% *
Household wiping 7% 2% *
Workplace wiping 5% 3% *
Flushable wiping 7% 9% *
Travel & catering products 5% 5% *
* Commercially small amounts supplied
Suominen in brief / How we create value / Year 2015 / Business / Sustainability / Governance / Financial Statements
The growth rates for the applications of
Suominen’s products in the main market areas
24 / 127
Suominen Corporation Annual Report 2015
Suominen in brief / How we create value / Year 2015 / Business / Sustainability / Governance / Financial Statements
The main end-use applications for
Suominen’s nonwovens for hygiene prod-
ucts are:
•	 Baby diapers
•	 Feminine hygiene products
•	 Adult incontinence products
The main end-use applications for medical
products include:
•	 Wound care applications
•	 Orthopedic care applications
•	 Surgical drape components
•	 Drug delivery components
In hygiene and medical pro-
ducts, nonwovens most often act
as components of end products.
For example, feminine care products can
consist of several layers of different materi-
als, with nonwovens being just one of them.
Customers of the Care business area in-
clude global consumer brands, manufactur-
ers of medical and hygiene products and
regional nonwoven converters.
Care in 2015
The net sales of the Care business area to-
taled EUR 32.4 million in 2015 (EUR 32.3 mil-
lion in 2014). In 2015, Care’s sales suffered due
to a large customer having non-Suominen-
related operational issues. This is the main
reason behind the flat sales growth in 2015.
However, there was more good news
than bad news in 2015: Care significantly
expanded its global customer base during
2015, launched five new branded products
and leveraged our global platform through
investments at our plants in Alicante, Spain
and Paulínia, Brazil. What is more, market
growth in hygiene and medical markets re-
mained positive. We are confident that these
aspects will give us positive momentum in
years to come.
Care outlook
The main market areas for Care are North
America and Europe. The investment made
at Suominen’s plant in Brazil in 2015 also
enables the business area to supply medi-
cal and hygiene products in South America.
Solid growth in demand is
forecasted to continue at Care’s
target markets.
In North America, demand for nonwovens
for medical products is projected to grow
roughly 5%, while in Europe the estimated
annual growth rate is around 3%. These
growth forecasts are supported by the current
global health and well-being megatrends: an
increase in the number of pandemics and
hospital-acquired infections, as well as the
challenges and changing operating models
faced by the healthcare sector.
The growth prospects for hygiene appli-
cations are driven by demographic factors
such as population growth, the increase in
income in developing countries and the ag-
ing of the population in developed coun-
tries. In nonwovens for hygiene products,
annual market growth in North America and
Europe is close to 4%.
The goal for the Care business area is
to achieve substantial growth. This will be
sought by concentrating on two areas: firstly,
on expanding our product portfolio and,
secondly, on nurturing our customers, be-
cause developing business relationships can
take time in medical and hygiene markets.
Care business area
The Care business area provides high-performance nonwovens for use
in hygiene and medical products. In 2015, the business area accounted
for 7% of Suominen’s net sales.
Net sales in 2015,
Care
32.4 EUR
million
Suominen in brief / How we create value / Year 2015 / Business / Sustainability / Governance / Financial Statements 25 / 127
Suominen Corporation Annual Report 2015
Suominen in brief / How we create value / Year 2015 / Business / Sustainability / Governance / Financial Statements
During 2015, the Care business area launched five new
branded products within the FIBRELLA®
product family.
Three of them are for medical and two for hygiene ap-
plications. All these new products support Suominen’s
strategic goal of developing and introducing high value-
added nonwovens with unique features, which make
them particularly interesting for very specific applications.
For example, FIBRELLA®
Move is a major step forward in
fluid acquisition and fluid management and it raises the
bar for materials in the construction of feminine care
products as well as for other absorbent hygiene applica-
tions. It enhances wearer comfort and body fit, and at
the same time gives convertors a new nonwoven that
easily runs on high-speed converting lines and is highly
compatible with other components.
FIBRELLA®
Perf is another good example, as it repre-
sents everything required of a best-in-class wound-
care product: it is breathable, skin-friendly, low-linting
and very absorbent. These features make it equally
applicable to surgical laminates and apparel. There
is also another interesting aspect of FIBRELLA®
Perf:
since it is the first nonwoven product Suominen
manufactures for Care business area in Paulínia, Brazil,
it opens up the South American medical markets to us.
Case
Five new branded
products launched
in 2015
Suominen in brief / How we create value / Year 2015 / Business / Sustainability / Governance / Financial Statements 26 / 127
Suominen Corporation Annual Report 2015
Suominen in brief / How we create value / Year 2015 / Business / Sustainability / Governance / Financial Statements
In December 2014, Suominen launched a
growth investment program to execute its
strategy for 2015–2017. At the time of the
launch, the value of the program was esti-
mated at EUR 30–50 million in total, but was
later raised to approximately EUR 60 million
due to the promising growth prospects in
high value-adding nonwovens applications.
Intensifying the growth
investment program supports
our strategic target of achieving
above-industry-average
growth in net sales.
Growth investment program
Plant
Estimated
value
Installed
during
Bethune
approx.
EUR 50 million
estimated
H2/2016
Alicante
approx.
EUR 4 million 2015Nakkila
Paulínia
To be
confirmed
approx.
EUR 6 million
Suominen’s investments in a nutshell
~50 EUR
million
Nakkila, Finland
Alicante, Spain
Paulínia, Brazil
Bethune, USA
Suominen in brief / How we create value / Year 2015 / Business / Sustainability / Governance / Financial Statements
EUR
million
~4
27 / 127
Suominen Corporation Annual Report 2015
Suominen in brief / How we create value / Year 2015 / Business / Sustainability / Governance / Financial Statements
The investment program is helping
Suominen to transform its product port-
folio; in other words, to increase the share
of products with higher added value. This
will enhance our ability to supply superior
products to our customers and, ultimately,
to end users.
The program benefits both the Conveni-
ence and Care business areas: it will further
strengthen Suominen’s leading position in
wiping markets and provide us with a clearly
improved opportunity to grow the Care busi-
ness area.
At the end of 2015, the investment pro-
gram covered four of Suominen’s produc-
tion plants.
Clear rationale for
choosing the Bethune plant
In early 2015, we announced our plans to
invest in a new wetlaid production line in
order to implement our growth strategy. As
the planning advanced, Suominen’s existing
plant in Bethune, SC, USA, was chosen as the
location of the new production line.
We selected the Bethune plant for several
strategic and financial reasons:
1.	 Bethune is located in North America, 	
	 where demand for high value-adding 	
	 nonwovens has both developed
	 favorably historically and has
	 attractive growth forecasts.
2.	 The Bethune plant is ideally located in 	
	 the Carolinas, the nonwovens hub
	 of North America, and is favorably 	
	 located from the logistical standpoint
	 of serving our customers and 		
	 managing our raw materials.
3.	 The plant already has ongoing
	 operations, highly skilled staff and
	 considerable infrastructure already
	 in place for expansion.
The Bethune investment
is the most significant project
in Suominen’s growth
investment program.
The new production line is essential for the
execution of Suominen’s growth strategy, for
it will serve several high value-adding end-use
applications. It will be tailor-made, based on
our unique nonwovens technology expertise,
and will take wetlaid technology to a whole
new level in the nonwovens industry.
The total value of the Bethune investment,
including both equipment and facilities, will
be close to EUR 50 million. The investment is
significant for Suominen both financially and
strategically, but, since it is expected to create
at least 25 jobs in Bethune, it is also vital to
the local community.
The new production line is expected to
be installed during the second half of 2016.
Three investment projects in
Europe and South America
In Alicante, Spain, we executed a production
line modification. The modification further
improves production reliability at the Alicante
plant and expands its product offering to non-
wovens for household and workplace wipes
and also for medical products.
The Alicante investment is expected to
open up new opportunities for Suominen
in the European market.
In Nakkila, Finland, a production line that
was shut down in 2012 was restarted in
March 2015. The improved demand in the
European market and Suominen’s strategic
objective to grow encouraged us to re-eval-
uate the situation.
The line restart at Nakkila also had an ef-
fect on Suominen’s personnel, with 13 new
employees being recruited.
In Paulínia, Brazil, we invested in produc-
tion technology that makes it easier for us to
supply nonwovens for, e.g., medical applica-
tions in South America. The upgraded tech-
nology additionally enables us to manufac-
ture more differentiated nonwovens, which
is vital in the growing South American wipes
market.
Installations of all three investments were
completed on schedule in 2015.
Read more
> How we create value
Read more at suominen.fi
> Investorsw
Suominen in brief / How we create value / Year 2015 / Business / Sustainability / Governance / Financial Statements 28 / 127
Suominen Corporation Annual Report 2015
Suominen in brief / How we create value / Year 2015 / Business / Sustainability / Governance / Financial Statements
Sustainability
Sustainability stems from the business and ultimately supports the business.
It cannot be reduced to reporting or charity activities. Instead, it involves,
e.g., developing more responsible products, which our customers and end
users crave. That is the way we see it. 5 %
Reduction in GHG
emissions in 2015
Pinja Taittonen
Assistant Business
Controller
Our purpose is to make
nonwovens continuously
better for people. That is
the basis of sustainability
at Suominen.
Suominen in brief / How we create value / Year 2015 / Business / Sustainability / Governance / Financial Statements 29 / 127
Suominen Corporation Annual Report 2015
Suominen in brief / How we create value / Year 2015 / Business / Sustainability / Governance / Financial Statements
At Suominen, sustainability means that we
take also environmental and social matters
into account in our decision-making. Our
sustainability strategy – the first of its kind
at Suominen – was composed at the end
of 2014 to support our business targets. It
defines precisely where we should target
our efforts and resources. Sustainability was
not, however, a new concept for us. Still,
this was the first time we clearly laid down
its strategic importance and specified which
themes are the most crucial to us and our
stakeholders.
In practice, the sustainability strategy
crystallizes our focus areas in promoting
sustainable development, as well as our key
projects for the strategy period 2015–2017.
The focus areas of sustainability
for Suominen, determined through
a materiality analysis, are:
1.	 Reaching product leadership
2.	 Operating sustainably across
	 the company
3.	 Fostering responsibility through
	 the value chain
During 2015, we kicked off
three key projects to implement
the sustainability strategy:
1.	 Product Sustainability Review
2.	 Non-Discrimination and Equal
	 Opportunities Program
3.	 Supplier Code of Conduct
However, as Suominen’s purpose is to
make nonwovens continuously better for
people, it is worth keeping in mind that
sustainability is not present only in specific
projects or programs. In fact, almost the op-
posite is true: sustainability is a day-to-day
matter that is concretized, for example, in the
development of more responsible products
and in all interaction with our stakeholders.
Focus areas
of sustainability
at Suominen
Operating
sustainably across
the company
Reaching
the product
leadership
Fostering
responsibility through
the value chain
Sustainability
strategy
Suominen in brief / How we create value / Year 2015 / Business / Sustainability / Governance / Financial Statements 30 / 127
Suominen Corporation Annual Report 2015
Suominen in brief / How we create value / Year 2015 / Business / Sustainability / Governance / Financial Statements
Stepping up the sustainability
of nonwovens
Having a sustainable product offering is one
of the core elements of Suominen’s sustain-
ability strategy, since all three focus areas of
the strategy are directly or indirectly related
to products. This means that Suominen’s
products are always safe and fit for the
purpose, renewable raw materials are used
more often, and we strive to meet all sustain-
ability requirements set by our customers
and end users.
In 2015,
we launched a distinct
product sustainability project,
which was based on a holistic,
three-part concept of
sustainability.
This involved reviewing selected case
products in our offering, based on all the
dimensions of sustainability. The first phase
of the project, examining the sustainability
of the case products, was completed at the
end of 2015. As a result, we now have a
better-than-ever understanding of what our
customers, end users and legislators may re-
quire from Suominen’s products in terms of
sustainability and how our product portfolio
currently meets expectations. The next step
is to plan and prioritize the identified cross-
functional development measures and put
the plan into action.
Sustainability reporting at Suominen
Suominen’s Annual Report 2015 examines
sustainability from the social, environmental
and financial perspectives of responsibility.
We report on our sustainability work every
year in the Annual Report.
Health, safety and environmental data is
collected from Suominen’s production units.
In accordance with the materiality principle,
locations that do not have production opera-
tions are not included in the data.
The graphics in the Sustainability sec-
tion present historical data as of 2013. All
of the graphs reflect Suominen’s continuing
business.
The Windsor Locks plant in CT, USA, is
utilized by both Suominen and Ahlstrom
Corporation. Where the Windsor Locks plant
is concerned, only the resources used by
Suominen are taken into account in the en-
vironmental figures. In the safety indicators,
personnel who have worked on Suominen’s
production lines but are not on Suominen’s
payroll are excluded.
We continuously develop our sustainabil-
ity reporting with the goal of open, meaning-
ful and equal stakeholder communication.
Suominen in brief / How we create value / Year 2015 / Business / Sustainability / Governance / Financial Statements 31 / 127
Suominen Corporation Annual Report 2015
Suominen in brief / How we create value / Year 2015 / Business / Sustainability / Governance / Financial Statements
In 2015, the significance of the social di-
mension of sustainability rose higher on
Suominen’s agenda as a result of the chosen
strategic emphasis and, thanks to the mate-
riality analysis, the increased understanding
of which themes of social responsibility are
essential to us.
Suominen is committed to offering its
employees a fair, safe and healthy work
environment. This is the bread and butter
of our social responsibility, but, of course,
there’s more to it than that. To boost our
social responsibility efforts, we launched a
Non-Discrimination and Equal Opportuni-
ties Program as part of our strategic target
to further promote sustainable operations
across the company.
Developing our employees’ capabilities
and promoting motivation and a commit-
ment to our common goals is a prerequisite
for successful strategy execution. In 2015,
Suominen spent EUR 122,902 (EUR 250,607
in 2014) in personnel training.
Personnel training costs are
investments in the company’s
future success
Only healthy employees are capable
employees. That is why Suominen strives
to improve employees’ working ability and
well-being. Last year, absences due to illness
amounted to 2.2% of total working hours
(2.4% in 2014).
Social responsibility
Suominen in brief / How we create value / Year 2015 / Business / Sustainability / Governance / Financial Statements
Eyes on equal pay
As part of the strategic Non-Discrimination
and Equal Opportunities Program, Suominen
conducted internal research on pay equity
between men and women in 2015. The
research involved all salaried employees
globally, i.e. 277 people in total. Employees
with hourly wages were excluded from the
research because of the comparability issues
between employees.
*100 = salaried employee average, indexed
Salaries at Suominen, indexed* All Female Male
0
100
200
300
400
500
Steer Manage Execute All
347
389
326
156 149 160
60 64 59
97105100
Personnel training costs, EUR
13 14 15
0
50,000
100,000
150,000
200,000
250,000
300,000
106,125
122,902
250,607
Sick absences,
% of total working hours
13 14 15
0.0
0.5
1.0
1.5
2.0
3.0
2.2
2.8
2.4
32 / 127
Suominen Corporation Annual Report 2015
Suominen in brief / How we create value / Year 2015 / Business / Sustainability / Governance / Financial Statements
We are committed to the
“equal pay for equal contribution”
principle.
We gained valuable information on the
current situation through the research and,
much to our delight, we discovered that the
overall situation is fairly good. We found out
that the gender pay gap varied somewhat
from country to country due to structural
reasons. For example, at certain plants wom-
en and men are not equally represented in
all functions and on all organizational lev-
els, which makes valid comparison difficult.
Our conclusion was that the root cause of
gender pay gaps at Suominen is structural
imbalance, rather than men and women be-
ing paid unequally for the same work. We
will monitor the gender pay gaps and are
committed to taking corrective measures
whenever necessary.
Disappointments in safety rates
In 2015, we continued to target zero lost-
time accidents but, unfortunately, our safety
rates weakened from the record-low level of
the previous year.
As part of the Non-Discrimination and Equal
Opportunities Program, we kicked-off a so-
called Blind Hiring Pilot Project in 2015 to see
if this could serve as a method of promoting
diversity and ensuring equal opportunities
when applying for a job at Suominen. Al-
though we knew that most of the personal
data of the applicants, e.g., full name, gender
and ethnicity, is irrelevant to Suominen, we
were aware that such data could uncon-
sciously bias the recruitment process. This
led Suominen to test out blind hiring – that
is, leaving the personal data of the applicants
hidden in the process as fully as possible.
Blind hiring was piloted in late 2015 in the
recruitment of an Assistant Business Con-
troller in our Helsinki office. First, we de-
fined a few pivotal selection criteria that
were objective, quantifiable and based on
the job description. An external recruitment
consultant assessed all applications using
Case
Sustainability strategy
put into practice in blind hiring
these criteria and selected the first group of
candidates. The hiring manager at Suominen
then narrowed the group down to six can-
didates based on their applications and ré-
sumés, with any personal data hidden. This
ensured that the applicants were assessed
only on their merits, and their identities were
revealed to the hiring manager only in the
interview phase.
The pilot was successful, and the blind hiring
process also brought efficiency, clarity and
structure to the hiring process. Suominen
aims to have blind hiring as the default ap-
proach in recruiting across the company. The
principle is meant to be utilized in all new
recruitment, including top management.
Read more at suominen.fi
> What’s new / Hiring manager’s blind date
w
Suominen in brief / How we create value / Year 2015 / Business / Sustainability / Governance / Financial Statements 33 / 127
Suominen Corporation Annual Report 2015
Suominen in brief / How we create value / Year 2015 / Business / Sustainability / Governance / Financial Statements
Suominen’s eight
plants recorded a total
of nine lost-time accidents.
That is nine too many.
We develop occupational safety accord-
ing to the principle of continuous improve-
ment. In improving safety, Suominen places
particular emphasis on influencing attitudes,
behavior, and operating models and on
building a culture of work safety. Safety
monitoring is part of the daily activities of
our production plants.
Our Accident Frequency Rate (AFR) in-
creased to 8.29 in 2015 (1.83 in 2014). We
did not identify one single reason why the
rate went up and, therefore, Suominen main-
tains its focus on people’s safety behavior,
as in most of the cases the root cause of an
accident is unsafe behavior. In addition, we
are paying more and more attention to be-
ing proactive when it comes to preventing
accidents. This has led us to, among other
things, introduce and monitor some new in-
dicators, such as days without professional
medical intervention (PMI).
Behavior-Based Safety program
The Behavior-Based Safety (BBS) program
kept rolling for the second year in 2015 and,
during the year, the program was imple-
mented at all remaining Suominen plants.
BBS emphasizes the individual’s responsibil-
ity in occupational safety, takes the human
factor into account, and focuses on influenc-
ing the attitude and motivation of individuals.
The Behavior-Based
Safety program is our way to
achieve a new level in safety.
BBS is implemented through Safety Walks.
In a Safety Walk, a trained employee walks
through the plant premises, identifying both
safe and unsafe behaviors and conditions,
and then engages in an open conversation
with the employees. Safety Walks are based
on the notion that safety is everyone’s re-
sponsibility. They create a safety partnership
between the observer and the observed indi-
vidual, focus people’s attention and actions
on their own daily safety behavior as well
as on the safety behavior of those around
them.
By the end of 2015, a total of 196 Suomin-
en employees had participated in Safety
Walk training. A total of 8,611 Safety Walks
were performed and altogether 3,508 safe
acts and conditions, and 3,524 unsafe be-
haviors and conditions were identified dur-
ing the walks.
Lost time accidents (LTA)
Accident severity
rate (ASR)
13 14 15
0.0
0.1
0.2
0.3
0.4
0.5
Accident frequency
rate (AFR)
13 14 15
0
2
4
6
8
10
0.48
9.00
8.29
1.83
0.37
0.04
13 14 15
0
2
4
6
8
10 99
2
Suominen in brief / How we create value / Year 2015 / Business / Sustainability / Governance / Financial Statements 34 / 127
Suominen Corporation Annual Report 2015
Suominen in brief / How we create value / Year 2015 / Business / Sustainability / Governance / Financial Statements
Suominen strives to reduce the environ-
mental load of its operations and minimize
the environmental impacts of its products
throughout their life cycle. In 2015, we es-
pecially sought to improve our energy and
water efficiency.
Suominen’s environmental
responsibility stems from our
purpose “to make nonwovens
continuously better
for people”.
Suominen is committed to considering
the environmental impacts of its opera-
tions in accordance with the International
Chamber of Commerce’s (ICC) principles of
sustainable development. We have identified
that our environmental impacts are primar-
ily related to the raw materials, energy and
water used in production, and to the waste
generated during the production process.
We prioritize the continuous improvement
and streamlining of our operations, and
foster the principle of reusing and recycling
materials.
Raw materials as important as ever
Since roughly 60–70% of Suominen’s expens-
es consist of raw materials, they play a promi-
nent role in our business. In 2015, Suominen
purchased 138,215 tons of fiber raw mate-
rial (138,519 tons in 2014), most of it being
viscose, pulp, polypropylene and polyester.
48.2% of Suominen’s raw materials originated
from renewable resources.
Energy and water efficiency in focus
Improving our energy and water efficiency
is something we especially focused on dur-
ing 2015. In energy efficiency, the target was
to achieve a 2% reduction in consumption,
while in water efficiency the goal was set at
a 12% consumption decrease in 2015.
Suominen’s energy consumption, 12.78
GJ/t, decreased from the level of 2014
Environmental responsibility
(13.02 GJ/t). The targeted reduction of 2%
was nearly met, as we managed to achieve a
reduction of 1.9%. Our work towards energy
efficiency does not, however, end here, for
we will continue our efforts to reduce our
energy consumption also in the future.
21.9% of the energy
Suominen consumed in 2015
came from renewable sources.
Our water efficiency improved in 2015, as
consumption fell to 42.08 m³/t from 43.01
m³/t in 2014. However, the decrease fell
short of our target. One of the identified rea-
sons for this is that the water consumption
measurement system at our plant in Windsor
Locks, CT, USA, is based on estimates, as
the facility is also utilized by Ahlstrom Cor-
poration. We are working on improving the
measurement accuracy of our specific water
consumption at that plant and, hence, will
have flow meters installed during 2016 in
Energy consumption by source
in 2015 (in total 1,683,166 GJ)
Natural gas 43%
Grid - electrical
power 40%
Steam 17%
Suominen in brief / How we create value / Year 2015 / Business / Sustainability / Governance / Financial Statements
Energy consumption and
energy efficiency
12,65
12,95
12,85
12,75
13,05
13 14 15
0
400,000
800,000
1,200,000
1,600,000
2,000,000
GJ GJ/ton of product
1,572,013
1,644,398
1,683,166
Raw material usage in 2015
(in total 138,215 tons)
Viscose 26%
Pulp 20%
Polypropylene* 23%
Polyester 26%
Other 6%
*Including sourced PP Spunbond
35 / 127
Suominen Corporation Annual Report 2015
Suominen in brief / How we create value / Year 2015 / Business / Sustainability / Governance / Financial Statements
00
30
20
10
40
50
0.012
0.008
0.004
0.016
0.020
0
0.72
0.48
0.24
0.96
1.20
order to show factual consumption and
improvements. The Windsor Locks plant
alone represents around 70% of Suominen’s
water consumption, due to the wetlaid pro-
duction technology utilized at the plant.
Suominen’s production plants
do not discharge a single drop of
untreated water.
Thanks to our continuous efforts to im-
prove our water-treatment systems, all the
water used in Suominen’s operations is as
clean or cleaner than it was when taken into
our process. That’s why we can say that we
don’t have any untreated water among our
outputs – only treated water.
A proud moment in 2015 was when
Suominen’s plant in Green Bay, WI, USA,
achieved the Gold Award in recognition of
full compliance with Federal, State and local
waste-water operations and discharge stand-
ards and requirements for four years in a row.
Choices for lower emissions
Last year, Suominen focused efforts on en-
hancing the measurement of its greenhouse
gas emissions. This was our planned first
step in reducing emissions as effectively as
possible in the future, because it is only by
knowing where emissions stem from that
we can take corrective actions.
In 2015, Suominen’s total greenhouse
gas emissions (direct, scope 1, and indirect,
scope 2) fell to 1.07 t/t of CO2
equivalent,
down from 1.12 t/t in 2014.
Suominen has purposely chosen to pur-
chase energy from lower-carbon-emission
sources and, as a result, the total indirect
CO2
emissions (scope 2) were 10.4% lower
in 2015 than the average in the countries
where we operate.
Waste volumes kept going down
After the massive 60% reduction in 2014, we
managed to further decrease the amount of
landfill waste to 6.96 kg/t (7.03 kg/t in 2014).
Suominen in brief / How we create value / Year 2015 / Business / Sustainability / Governance / Financial Statements
Water intake by source in 2015
(in total 5,542,291 m3
)
Surface water 72%
Municipal water
supplies 19%
Ground water 9%
Water consumption
and water efficiency
13 14 15
1,000,000
0
2,000,000
3,000,000
4,000,000
5,000,000
6,000,000
Waste to landfill
13 14 15
0
500
1,000
1,500
2,000
2,500
Greenhouse gas emissions*
13 14 15
0
30,000
60,000
90,000
120,000
150,000
*including direct and indirect emissions
tons tons/ton of product
tons tons/ton of productm3 m3/ton of product
2278
114,679
888
141,493
916
140,774
4,860,948
5,431,730
5,542,291
36 / 127
Suominen Corporation Annual Report 2015
Suominen in brief / How we create value / Year 2015 / Business / Sustainability / Governance / Financial Statements
Suominen wants to be a good corporate
citizen. We comply with local laws and regu-
lations and follow good corporate govern-
ance and other generally accepted business
practices. We strive to carry out our business
activities according to the expectations of
society and our stakeholders wherever we
operate.
Suominen’s turnaround into
a company aiming for growth
has been successful.
We are economically vital and we intend
to keep it that way. As the development of
our operating profit – from EUR 25.9 million
in 2014 to EUR 31.8 million in 2015 – sug-
gests, progress has been made in profitabil-
ity. Last year, our profitability was impacted
by both internal work, such as maintaining
cost-consciousness, and by external effects,
such as exchange rates. Our internal work
on profitability will continue also in the fu-
ture. Good profitability and a strong financial
position are prerequisites for meeting our fi-
nancial obligations to our various stakehold-
ers and contributing to increasing general
economic well-being.
From a financial perspective, the EUR
60 million growth investment program was
probably the biggest piece of news from
Suominen in 2015. The most significant ini-
tiative in the program – the investment in a
new state-of-the art production line at the
Bethune plant in SC, USA – is also the largest
investment in organic growth in Suominen’s
history, with an approximate value of EUR 50
million. The growth investment program is
significant not only for Suominen, but also
for the local communities, since the invest-
ments create jobs. In Bethune, we will create
at least 25 new jobs by the end of 2016 and
in Nakkila, Finland, 13 new employees were
recruited in 2015, thanks to the re-opening
of a production line.
Stakeholder Direct financial impact in 2015
Customers Net sales EUR 444.0 million
Suominen’s major customers include, e.g., global
consumer brands and private label manufacturers.
Employees Wages and salaries EUR 34.8 million
Suominen employed over 600 people in Europe and
in North and South America in 2015.
Partners Materials and services EUR 322.3 million
Suominen purchases raw materials and other products and
services from local and international business partners.
Society Corporate income taxes paid EUR 8.3 million
Suominen is a significant employer in the communities where
we operate, which makes us a promoter of general well-being.
Financiers Net financial expenses EUR 5.3 million
Shareholders
EUR 0.01 per share fund distribution, approx.
EUR 2.5 million in total, from the financial year 2014.
On 31 December 2015, Suominen had 4,818 shareholders.
Read more
> Business section
Read more at suominen.fi
> Sustainability
> Sustainability / Code of Conduct
w
Economic responsibility
Suominen in brief / How we create value / Year 2015 / Business / Sustainability / Governance / Financial Statements 37 / 127
Suominen Corporation Annual Report 2015
Suominen in brief / How we create value / Year 2015 / Business / Sustainability / Governance / Financial Statements
Corporate Governance
The Corporate Governance section of the Annual Report provides a
comprehensive review on Suominen’s governance and remuneration.
As a new feature in our reporting, a letter from the Chair of the
Personnel and Remuneration Committee has been included. 4,818 Number of Suominen
shareholders at the end
of 2015.
The supreme
decision-making body of
Suominen is the General
Meeting of Shareholders.
Suominen in brief / How we create value / Year 2015 / Business / Sustainability / Governance / Financial Statements
Shareholders and market
value in 2015
5000
4750
4250
3750
4500
4000 225
275
250
200
325
300
350
/20151 2 3 4 5 6 7 8 9 10 11 12
Market value, EUR million
Number of shareholders
In 2015,
the Board of
Directors convened
18 times.
EUR millionShareholders
38 / 127
Suominen Corporation Annual Report 2015
Suominen in brief / How we create value / Year 2015 / Business / Sustainability / Governance / Financial StatementsSuominen in brief / How we create value / Year 2015 / Business / Sustainability / Governance / Financial Statements
Corporate Governance Statement
of Suominen Corporation for 2015
In financial year 2015, Suominen Corpora-
tion (hereinafter “Suominen”) complied with
the Finnish Corporate Governance Code
2010 (hereinafter “Code”) issued by the Se-
curities Market Association. Suominen com-
plies with the Finnish Corporate Governance
Code 2015, effective as of 1 January 2016,
for the first time in the financial year starting
1 January 2016.
The Corporate Governance Statement
(hereinafter Statement), required by the
Code, Chapter 7, Section 7 of the Securities
Markets Act, and Section 7 of the Ministry of
Finance’s Decree on the Regular Duty of Dis-
closure of an Issuer of a Security, is published
as a separate statement in connection with
the Report by the Board of Directors. The
Statement is in accordance with the Code’s
Recommendation 54. In addition, selected
requirements set in the Corporate Govern-
ance Code 2015 have been taken into ac-
count in this Statement, even though they
will be effective only in financial year 2016.
The Statement can also be viewed on
Suominen’s website, www.suominen.fi.
The Audit Committee and the Board of
Directors of Suominen Corporation have
reviewed the Statement. The Statement will
not be updated during the financial year, but
up-to-date information on its various topics
is available on Suominen’s website.
The Finnish Corporate Governance Code
2010 for listed companies as well as the new
Finnish Corporate Governance Code 2015
are available on the website of the Securities
Market Association, www.cgfinland.fi.
Suominen Group
Responsibility for Suominen Group’s business
operations is held by the constitutional bod-
ies required by the Finnish Companies Act:
the General Meeting of Shareholders, which
elects the members of the Board of Directors;
and the President and CEO, who is appointed
by the Board of Directors.
The Group’s supreme decision-making
body is the General Meeting of Sharehold-
ers, where shareholders exercise their deci-
sion-making power. The Board of Directors
is responsible for the company’s manage-
ment and its appropriate organization. As
the Group’s parent company, Suominen
Corporation is responsible for the Group’s
management, accounting and financing,
product development and management
of intellectual property, human resources,
ICT, as well as communications and inves-
tor relations.
While Suominen has two business areas,
Convenience and Care, the company has
only one operating segment.
Shareholder’s Nomination Board of
Suominen Corporation
Suominen’s Annual General Meeting of 26
March 2013 resolved to establish a perma-
nent Shareholders’ Nomination Board ac-
cording to a proposal by the Board of Direc-
tors. The task of the Nomination Board is to
prepare and present to the Annual General
Meeting and, if necessary, to an Extraordi-
nary General Meeting, a proposal on the
remuneration of the members of the Board
of Directors, a proposal on the number of
members of the Board of Directors and a
proposal on the members of the Board of Di-
rectors. In addition, the task of the Nomina-
tion Board is to seek candidates as potential
board members.
The Nomination Board shall consist of
four (4) members, three of which shall be
appointed by the company’s three largest
shareholders, who shall appoint one member
each. The Chair of the company’s Board of
Directors shall serve as the fourth member.
The Nomination Board is established to
exist and serve until the General Meeting of
the company decides otherwise. The mem-
bers shall be nominated annually and their
term of office shall end when new mem-
bers are nominated to replace them. The
members of the Nomination Board shall be
independent of the company, and a per-
son belonging to the company’s operative
management cannot be a member of the
Nomination Board.
The representatives appointed by the
company’s three largest shareholders form
Suominen’s permanent Nomination Board.
The shareholders entitled to appoint mem-
bers to the Nomination Board during finan-
cial year 2015 were determined on the basis
of the registered holdings in the company’s
shareholder register on 1 September 2014,
on 7 October 2014 and on 1 September
2015.
39 / 127
Suominen Corporation Annual Report 2015
Suominen in brief / How we create value / Year 2015 / Business / Sustainability / Governance / Financial Statements
From 1 January to 1 September 2015, the
members of the Nomination Board were:
-	 Thomas Ahlström, Managing Director
	 of Antti Ahlström Perilliset Oy and
	 member of the Board of Directors
	 of Ahlström Capital
-	 Timo Ritakallio, President and
	 CEO of Ilmarinen Mutual Pension 	
	 Insurance Company
-	 Reima Rytsölä, Executive Vice-
	 President, Investments of Varma
	 Mutual Pension Insurance Company
-	 Jorma Eloranta, Chair of Suominen’s
	 Board of Directors.
As of 2 September 2015, the members of
the Nomination Board were:
-	 Thomas Ahlström, Managing Director
	 of Antti Ahlström Perilliset Oy and
	 member of the Board of Directors of
	 Ahlström Capital
-	 Mikko Mursula, Chief Investment
	 Officer of Ilmarinen Mutual Pension
	 Insurance Company
-	 Reima Rytsölä, Executive Vice-
	 President, Investments of Varma
	 Mutual Pension Insurance Company
-	 Jorma Eloranta, Chair of Suominen’s
	 Board of Directors.
In 2015, the Nomination Board convened
two times. The attendance rate at the meet-
ings was 100%.
Board of Directors
Composition in 2015
Until the Annual General Meeting of 2015,
Mr. Jorma Eloranta (Chair), Mr. Risto Ant-
tonen (Deputy Chair), Ms. Suvi Hintsanen, Mr.
Hannu Kasurinen and Ms. Jaana Tuominen
formed the Board of Directors of Suominen.
The Annual General Meeting held on 19
March 2015 re-elected Mr. Risto Anttonen, Mr.
Jorma Eloranta, Mr. Hannu Kasurinen and Ms.
Jaana Tuominen as members of the Board of
Directors. Additionally, Mr. Andreas Ahlström
and Ms. Laura Raitio were elected as new
members. The term of office of the members
of the Board of Directors ends at the close of
the Annual General Meeting 2016.
Biographical details of the members are
as follows:
Jorma Eloranta, b. 1951, M. Sc. (Tech.), Dr.
Sc. (Tech.) h.c., Chair of the Board
Risto Anttonen, b. 1949, B. Sc. (Econ.),
Deputy Chair of the Board
Andreas Ahlström, b. 1976, M. Sc.
(Econ. and Business Adm.), Investment
Manager, Ahlström Capital Oy
Suvi Hintsanen, b. 1967, M. Sc. (Econ.),
Head of Cash Management and Trade
Finance, Pohjola Bank plc (member of the
Board of Directors until 19 March 2015)
Hannu Kasurinen, b. 1963,
M. Sc. (Econ.), Senior Vice President,
Head of Carton Board Business Unit, Stora
Enso Corporation
Laura Raitio, b. 1962, Licentiate of Tech-
nology (Forest Products), CEO, Diacor
terveyspalvelut Oy
Jaana Tuominen, b. 1960, M. Sc. (Chem.
Eng.), CEO, Paulig Group
Tasks and responsibilities
The Board of Directors is responsible for the
administration and appropriate organization
of Suominen’s operations. The Board is re-
sponsible for making decisions on matters
that are likely to have a major impact on the
company’s operations. The Board convenes
according to an annual meeting plan. The
main duties of the Board include:
•	 deciding on the company’s corporate
	 structure and organization
•	 nominating and dismissing the
	 President & CEO
•	 deciding on the salaries, bonuses, and
	 other benefits paid to the President &
	 CEO and his/her immediate
	subordinates
•	 deciding on the company’s salary and
	 incentive scheme
•	 considering and approving annual
	 accounts, reports by the Board of
	 Directors, financial statement releases,
	 and interim reports
•	 monitoring and supervising the
	 Group’s performance and ensuring
	 the effectiveness of its management
•	 approving the company’s operating
	 policies (financing policy, insurance
	 and risk management policy, and
	 principles for corporate governance)
•	 deciding on the acquisition and
	 assignment of fixed assets
•	 deciding on strategically and
	 financially significant investments,
	 acquisitions, divestments, or other
	arrangements
•	 deciding on financial borrowings and
	 pledging securities
•	 considering and approving strategies
	 and action plans
•	 establishing a dividend policy and
	 confirming the company’s targets.
Suominen in brief / How we create value / Year 2015 / Business / Sustainability / Governance / Financial Statements 40 / 127
Suominen Corporation Annual Report 2015
Suominen in brief / How we create value / Year 2015 / Business / Sustainability / Governance / Financial Statements
The Board of Directors is elected by the Gen-
eral Meeting of Shareholders. It consists of
at least three and at most seven members.
Meeting practice
The Board of Directors convenes under the
direction of the Chair or, if the Chair is un-
able to attend, the Deputy Chair. Principally,
the matters are presented by the President
& CEO.
In 2015, the Board of Directors convened
18 times, of which 9 times per capsulam.
The average attendance rate at meetings
was 99%. The participation of each individual
member is presented in the table below.
of the company, and at least one member
must be independent of the company’s sig-
nificant shareholders.
From 1 January 2015 until 19 March 2015,
until the constitutive meeting of the Board,
the Audit Committee consisted of Hannu
Kasurinen as Chair and Suvi Hintsanen and
Jaana Tuominen as members. In its constitu-
tive meeting on 19 March 2015, the Board of
Directors elected Hannu Kasurinen as Chair
and Andreas Ahlström and Laura Raitio as
members of the Audit Committee.
In 2015, the Audit Committee convened
four times. The attendance rate at the meet-
ings was 100%. The participation of each in-
dividual member is presented in the table
below.Name Participation
Jorma Eloranta Chair 18/18
Risto Anttonen Deputy Chair 18/18
Andreas Ahlström
Member as of
19 March 2015 14/14
Suvi Hintsanen
Member until
19 March 2015 4/4
Hannu Kasurinen Member 18/18
Laura Raitio
Member as of
19 March 2015 13/14
Jaana Tuominen Member 18/18
Name Participation
Hannu Kasurinen Chair 4/4
Andreas Ahlström
Member as of
19 March 2015 3/3
Suvi Hintsanen
Member until
19 March 2015 1/1
Laura Raitio
Member as of
19 March 2015 3/3
Jaana Tuominen
Member until
19 March 2015 1/1
Evaluation of independence
The Board of Directors has evaluated the in-
dependence of its members. All members
are independent of the company and its
significant shareholders, with the exception
of Andreas Ahlström, who is dependent on
a significant shareholder. In financial year
2015, Andreas Ahlström acted as Investment
Manager at Ahlström Capital Oy. The larg-
est shareholder of Suominen, AC Invest Two
B.V., is a group company of Ahlström Capital.
Self-evaluation
The Board of Directors reviews its opera-
tions and procedures through an annual
self-assessment. 
Board committees
Audit Committee
The main tasks of the Audit Committee re-
late to ensuring the company’s good gov-
ernance, accounting and financial reporting,
internal control systems and monitoring of
third-party auditing. The Audit Committee
prepares for the Board matters that fall under
its areas of responsibilities, but it does not
have independent decision-making pow-
ers unless the Board resolves otherwise on
certain matters.
The Chair and members of the commit-
tee are elected annually at the Board’s con-
stitutive meeting. At least three members are
elected to the committee. The members of
the Audit Committee must be independent
Personnel and Remuneration Committee
The Personnel and Remuneration Com-
mittee will prepare the remuneration and
appointment matters concerning the com-
pany’s President & CEO and other members
of senior management, as well as principles
and procedures related to the remuneration
of the company’s employees. The Commit-
tee will prepare for the Board matters that
fall under its areas of responsibilities, but it
does not have independent decision-making
powers unless the Board resolves otherwise
on individual matters.
The Chair and members of the commit-
tee will be elected annually at the Board’s
constitutive meeting. Until 19 March 2015,
the minimum number of committee mem-
bers was two, which deviated from recom-
mendation 22 of the Code 2010, which
states that Board committees must have at
least three members. Suominen’s Board of
Directors states that, taking into considera-
tion the number of members of the Board
and the scope and nature of the company’s
business operations, the Personnel and
Remuneration Committee was able to ef-
fectively handle the matters assigned to it
even with only two members. As of 19 March
2015, the Committee has consisted of three
members. The majority of the members of
the Personnel and Remuneration Commit-
Suominen in brief / How we create value / Year 2015 / Business / Sustainability / Governance / Financial Statements 41 / 127
Suominen Corporation Annual Report 2015
Suominen in brief / How we create value / Year 2015 / Business / Sustainability / Governance / Financial Statements
tee must be independent of the company.
The President & CEO or a member of the
company’s or Group’s management may not
be a member of the Personnel and Remu-
neration Committee.
From 1 January 2015 until 19 March 2015,
until the constitutive meeting of the Board
of Directors, the members of the Personnel
and Remuneration Committee were Jorma
Eloranta (Chair) and Risto Anttonen. In its
constitutive meeting held on 19 March 2015,
the Board of Directors elected Jorma Elor-
anta as the Chair of the Personnel and Re-
muneration Committee and Risto Anttonen
and Jaana Tuominen as members.
In 2015, the Personnel and Remunera-
tion Committee convened three times. The
attendance rate at the meetings was 100%.
The participation of each individual member
is presented in the table below.
Technology, the CIO, the Vice President of
Marketing & Product Management, the Vice
President of Sourcing, and the Vice President
of Corporate Communications & Investor
Relations.
Insider management
From 1 January to 30 November 2015
Suominen Group observed the guidelines
for insiders issued by the NASDAQ OMX
Helsinki Ltd on 1 July 2013, and as of 1
December 2015, the new Nasdaq Helsinki
Guidelines for Insiders.
The members of the Board of Directors,
the President & CEO and the Principal Audi-
tor are included in the company’s public in-
sider register. The public register is available
at Suominen’s website via the online service
provided by Euroclear Finland Ltd.
The company also maintains a com-
pany-specific register of non-public insid-
ers. Permanent insiders listed here include
the members of the Corporate Executive
Team and certain other employees of the
company, who by virtue of their position
or responsibilities regularly receive insider
information. A project-specific insider reg-
ister is maintained to cover persons that are
involved with the planning and preparation
of significant projects dealing with insider
information.
President & CEO and the Group
management
The President & CEO of Suominen Corpora-
tion is appointed by the Board of Directors.
The President & CEO is responsible for day-
to-day operations in accordance with the
Companies Act and guidelines and instruc-
tions provided by the Board of Directors. The
President & CEO is responsible for ensuring
that the company’s accounting practices
comply with the law and that its assets are
reliably managed. The President & CEO
acts as the Chair of the Corporate Execu-
tive Team and as the immediate supervisor
of the Team’s members.
Ms. Nina Kopola, b. 1960, M.Sc. (Chemi-
cal Eng.), Technology Licentiate acts as the
President & CEO of Suominen Corporation.
The President & CEO is supported by the
Corporate Executive Team and Corporate
Leadership Team. In 2015, the Corporate Ex-
ecutive Team comprised, in addition to the
President & CEO who acts as its Chair, the
Senior Vice Presidents of the business areas,
the Senior Vice Presidents of Operations, the
Senior Vice President, CFO, and the Senior
Vice President of Human Resources.
The Corporate Leadership Team compris-
es, in addition to the members of the Cor-
porate Executive Team, the Vice President
of R&D, the Vice President of Investments &
The Senior Vice President, CFO, is respon-
sible for Suominen’s insider management.
Insiders are not allowed to trade in se-
curities issued by the company for a period
beginning at the end of a financial period
or a financial year and ending with the pub-
lication of the interim report or financial
statement release for the period or financial
year in question (closed window). In case
an insider aims to trade with the company’s
shares, a trading scheme concerning the ac-
quisition or transfer of the company’s shares
must be employed. Trading scheme must
be submitted to the person responsible for
insider issues for his/her approval and for
storage prior to initiating trading with the
company’s shares.
Auditing
Until 19 March 2015, PricewaterhouseCoop-
ers Oy, Authorised Public Accountants, act-
ed as auditor of the company, with Heikki
Lassila, Authorised Public Accountant, as the
principal auditor.
The Annual General Meeting held on
19 March 2015 elected Ernst & Young Oy,
Authorised Public Accountants, as auditor
of the company, with Kristina Sandin, Au-
thorised Public Accountant, as the principal
auditor.
Name Participation
Jorma Eloranta Chair 3/3
Risto Anttonen Member 3/3
Jaana Tuominen
Member as of
19 March 2015 2/2
Suominen in brief / How we create value / Year 2015 / Business / Sustainability / Governance / Financial Statements 42 / 127
Suominen Corporation Annual Report 2015

More Related Content

Similar to Suominen Corporation Annual Report 2015

Capital Markets Day 2015, Nina Kopola, President & CEO on Nov 11
Capital Markets Day 2015, Nina Kopola, President & CEO on Nov 11Capital Markets Day 2015, Nina Kopola, President & CEO on Nov 11
Capital Markets Day 2015, Nina Kopola, President & CEO on Nov 11Suominen Corporation
 
Review by the President & CEO, Suominen Corporation's Annual General Meeting ...
Review by the President & CEO, Suominen Corporation's Annual General Meeting ...Review by the President & CEO, Suominen Corporation's Annual General Meeting ...
Review by the President & CEO, Suominen Corporation's Annual General Meeting ...Suominen Corporation
 
Suominen's Annual General Meeting 2015
Suominen's Annual General Meeting 2015Suominen's Annual General Meeting 2015
Suominen's Annual General Meeting 2015Suominen Corporation
 
Suominen at Small Mid Cap Forum at Zürich, Switzerland on 5 September 2017
Suominen at Small Mid Cap Forum at Zürich, Switzerland on 5 September 2017Suominen at Small Mid Cap Forum at Zürich, Switzerland on 5 September 2017
Suominen at Small Mid Cap Forum at Zürich, Switzerland on 5 September 2017Suominen Corporation
 
Unilever introduction
Unilever introductionUnilever introduction
Unilever introductionFiverr
 
During your weekly trip to the grocery store, you purchase bread, .docx
During your weekly trip to the grocery store, you purchase bread, .docxDuring your weekly trip to the grocery store, you purchase bread, .docx
During your weekly trip to the grocery store, you purchase bread, .docxsagarlesley
 
Review by the President & CEO, Suominen Corporation's Annual General Meeting ...
Review by the President & CEO, Suominen Corporation's Annual General Meeting ...Review by the President & CEO, Suominen Corporation's Annual General Meeting ...
Review by the President & CEO, Suominen Corporation's Annual General Meeting ...Suominen Corporation
 
BNP Paribas Cardif - 2014 Business Report
BNP Paribas Cardif - 2014 Business ReportBNP Paribas Cardif - 2014 Business Report
BNP Paribas Cardif - 2014 Business ReportBNP Paribas Cardif
 
Suominen at Avanza Bank's Börsdag on 18 May 2016
Suominen at Avanza Bank's Börsdag on 18 May 2016Suominen at Avanza Bank's Börsdag on 18 May 2016
Suominen at Avanza Bank's Börsdag on 18 May 2016Suominen Corporation
 
Nina Kopola: Suominen's Changemaker strategy 2017–2021. Suominen CMD 2017.
Nina Kopola: Suominen's Changemaker strategy 2017–2021. Suominen CMD 2017.Nina Kopola: Suominen's Changemaker strategy 2017–2021. Suominen CMD 2017.
Nina Kopola: Suominen's Changemaker strategy 2017–2021. Suominen CMD 2017.Suominen Corporation
 
Capital Markets Day, Ernesto Levy, SVP Convenience on Nov 11
Capital Markets Day, Ernesto Levy, SVP Convenience on Nov 11Capital Markets Day, Ernesto Levy, SVP Convenience on Nov 11
Capital Markets Day, Ernesto Levy, SVP Convenience on Nov 11Suominen Corporation
 
Review by the President & CEO, Suominen Corporation's Annual General Meeting ...
Review by the President & CEO, Suominen Corporation's Annual General Meeting ...Review by the President & CEO, Suominen Corporation's Annual General Meeting ...
Review by the President & CEO, Suominen Corporation's Annual General Meeting ...Suominen Corporation
 
Groupe SEB - Business and Sustainable Development report 2016
Groupe SEB - Business and Sustainable Development report 2016Groupe SEB - Business and Sustainable Development report 2016
Groupe SEB - Business and Sustainable Development report 2016Groupe SEB
 
ABID HUSSAIN SINDHU. M14BBA036. Customer Behavior
ABID HUSSAIN SINDHU. M14BBA036. Customer BehaviorABID HUSSAIN SINDHU. M14BBA036. Customer Behavior
ABID HUSSAIN SINDHU. M14BBA036. Customer Behavior564251
 
Case Study Synlait Milk is an innovative dairy processing company th.pdf
Case Study Synlait Milk is an innovative dairy processing company th.pdfCase Study Synlait Milk is an innovative dairy processing company th.pdf
Case Study Synlait Milk is an innovative dairy processing company th.pdfeyeonsecuritysystems
 
February 21 Nestlé fy11 roadshow transcript (f)
February 21 Nestlé fy11 roadshow transcript (f)February 21 Nestlé fy11 roadshow transcript (f)
February 21 Nestlé fy11 roadshow transcript (f)Nestlé SA
 

Similar to Suominen Corporation Annual Report 2015 (20)

Capital Markets Day 2015, Nina Kopola, President & CEO on Nov 11
Capital Markets Day 2015, Nina Kopola, President & CEO on Nov 11Capital Markets Day 2015, Nina Kopola, President & CEO on Nov 11
Capital Markets Day 2015, Nina Kopola, President & CEO on Nov 11
 
Review by the President & CEO, Suominen Corporation's Annual General Meeting ...
Review by the President & CEO, Suominen Corporation's Annual General Meeting ...Review by the President & CEO, Suominen Corporation's Annual General Meeting ...
Review by the President & CEO, Suominen Corporation's Annual General Meeting ...
 
Suominen's Annual General Meeting 2015
Suominen's Annual General Meeting 2015Suominen's Annual General Meeting 2015
Suominen's Annual General Meeting 2015
 
Suominen at Small Mid Cap Forum at Zürich, Switzerland on 5 September 2017
Suominen at Small Mid Cap Forum at Zürich, Switzerland on 5 September 2017Suominen at Small Mid Cap Forum at Zürich, Switzerland on 5 September 2017
Suominen at Small Mid Cap Forum at Zürich, Switzerland on 5 September 2017
 
GROWTH STRATEGY OF UNILEVER IN EMERGING MARKETS
GROWTH STRATEGY OF UNILEVER IN EMERGING MARKETSGROWTH STRATEGY OF UNILEVER IN EMERGING MARKETS
GROWTH STRATEGY OF UNILEVER IN EMERGING MARKETS
 
Unilever introduction
Unilever introductionUnilever introduction
Unilever introduction
 
During your weekly trip to the grocery store, you purchase bread, .docx
During your weekly trip to the grocery store, you purchase bread, .docxDuring your weekly trip to the grocery store, you purchase bread, .docx
During your weekly trip to the grocery store, you purchase bread, .docx
 
Review by the President & CEO, Suominen Corporation's Annual General Meeting ...
Review by the President & CEO, Suominen Corporation's Annual General Meeting ...Review by the President & CEO, Suominen Corporation's Annual General Meeting ...
Review by the President & CEO, Suominen Corporation's Annual General Meeting ...
 
BNP Paribas Cardif - 2014 Business Report
BNP Paribas Cardif - 2014 Business ReportBNP Paribas Cardif - 2014 Business Report
BNP Paribas Cardif - 2014 Business Report
 
Unilever
UnileverUnilever
Unilever
 
Suominen at Avanza Bank's Börsdag on 18 May 2016
Suominen at Avanza Bank's Börsdag on 18 May 2016Suominen at Avanza Bank's Börsdag on 18 May 2016
Suominen at Avanza Bank's Börsdag on 18 May 2016
 
Nina Kopola: Suominen's Changemaker strategy 2017–2021. Suominen CMD 2017.
Nina Kopola: Suominen's Changemaker strategy 2017–2021. Suominen CMD 2017.Nina Kopola: Suominen's Changemaker strategy 2017–2021. Suominen CMD 2017.
Nina Kopola: Suominen's Changemaker strategy 2017–2021. Suominen CMD 2017.
 
Capital Markets Day, Ernesto Levy, SVP Convenience on Nov 11
Capital Markets Day, Ernesto Levy, SVP Convenience on Nov 11Capital Markets Day, Ernesto Levy, SVP Convenience on Nov 11
Capital Markets Day, Ernesto Levy, SVP Convenience on Nov 11
 
Review by the President & CEO, Suominen Corporation's Annual General Meeting ...
Review by the President & CEO, Suominen Corporation's Annual General Meeting ...Review by the President & CEO, Suominen Corporation's Annual General Meeting ...
Review by the President & CEO, Suominen Corporation's Annual General Meeting ...
 
Groupe SEB - Business and Sustainable Development report 2016
Groupe SEB - Business and Sustainable Development report 2016Groupe SEB - Business and Sustainable Development report 2016
Groupe SEB - Business and Sustainable Development report 2016
 
ABID HUSSAIN SINDHU. M14BBA036. Customer Behavior
ABID HUSSAIN SINDHU. M14BBA036. Customer BehaviorABID HUSSAIN SINDHU. M14BBA036. Customer Behavior
ABID HUSSAIN SINDHU. M14BBA036. Customer Behavior
 
Case Study Synlait Milk is an innovative dairy processing company th.pdf
Case Study Synlait Milk is an innovative dairy processing company th.pdfCase Study Synlait Milk is an innovative dairy processing company th.pdf
Case Study Synlait Milk is an innovative dairy processing company th.pdf
 
February 21 Nestlé fy11 roadshow transcript (f)
February 21 Nestlé fy11 roadshow transcript (f)February 21 Nestlé fy11 roadshow transcript (f)
February 21 Nestlé fy11 roadshow transcript (f)
 
Colgate ppt
Colgate pptColgate ppt
Colgate ppt
 
Annual report 2014
Annual report 2014Annual report 2014
Annual report 2014
 

More from Suominen Corporation

Suominen Corporation results Q3/2018
Suominen Corporation results Q3/2018Suominen Corporation results Q3/2018
Suominen Corporation results Q3/2018Suominen Corporation
 
Suominen Oyj:n tulosesitys Q3 2018
Suominen Oyj:n tulosesitys Q3 2018Suominen Oyj:n tulosesitys Q3 2018
Suominen Oyj:n tulosesitys Q3 2018Suominen Corporation
 
Suominen Corporation results Q2 2018
Suominen Corporation results Q2 2018Suominen Corporation results Q2 2018
Suominen Corporation results Q2 2018Suominen Corporation
 
Suominen Oyj:n tulosesitys Q2 2018
Suominen Oyj:n tulosesitys Q2 2018Suominen Oyj:n tulosesitys Q2 2018
Suominen Oyj:n tulosesitys Q2 2018Suominen Corporation
 
Suominen Corporation results Q1 2018
Suominen Corporation results Q1 2018Suominen Corporation results Q1 2018
Suominen Corporation results Q1 2018Suominen Corporation
 
Suominen Oyj:n tulosesitys Q1 2018
Suominen Oyj:n tulosesitys Q1 2018Suominen Oyj:n tulosesitys Q1 2018
Suominen Oyj:n tulosesitys Q1 2018Suominen Corporation
 
Suominen at Pörssi-ilta in Turku on 20 March 2018
Suominen at Pörssi-ilta in Turku on 20 March 2018Suominen at Pörssi-ilta in Turku on 20 March 2018
Suominen at Pörssi-ilta in Turku on 20 March 2018Suominen Corporation
 
Toimitusjohtajan katsaus, Suominen Oyj:n yhtiökokous 2018
Toimitusjohtajan katsaus, Suominen Oyj:n yhtiökokous 2018Toimitusjohtajan katsaus, Suominen Oyj:n yhtiökokous 2018
Toimitusjohtajan katsaus, Suominen Oyj:n yhtiökokous 2018Suominen Corporation
 
Suominen at Pörssiaamu in Helsinki, Finland, on 1 March 2018
Suominen at Pörssiaamu in Helsinki, Finland, on 1 March 2018 Suominen at Pörssiaamu in Helsinki, Finland, on 1 March 2018
Suominen at Pörssiaamu in Helsinki, Finland, on 1 March 2018 Suominen Corporation
 
Suominen at European Midcap Event in Frankfurt on 6 February 2018
Suominen at European Midcap Event in Frankfurt on 6 February 2018Suominen at European Midcap Event in Frankfurt on 6 February 2018
Suominen at European Midcap Event in Frankfurt on 6 February 2018Suominen Corporation
 
Suominen Oyj:n tulosesitys Q4 ja FY 2017
Suominen Oyj:n tulosesitys Q4 ja FY 2017Suominen Oyj:n tulosesitys Q4 ja FY 2017
Suominen Oyj:n tulosesitys Q4 ja FY 2017Suominen Corporation
 
Suominen Corporation results Q4 and FY 2017
Suominen Corporation results Q4 and FY 2017Suominen Corporation results Q4 and FY 2017
Suominen Corporation results Q4 and FY 2017Suominen Corporation
 
Suominen @ Yhtiöilta, Helsinki 21.11.2017
Suominen @ Yhtiöilta, Helsinki 21.11.2017Suominen @ Yhtiöilta, Helsinki 21.11.2017
Suominen @ Yhtiöilta, Helsinki 21.11.2017Suominen Corporation
 
Suominen @ Pörssi-ilta, Tampere 31.10.2017
Suominen @ Pörssi-ilta, Tampere 31.10.2017Suominen @ Pörssi-ilta, Tampere 31.10.2017
Suominen @ Pörssi-ilta, Tampere 31.10.2017Suominen Corporation
 
Suominen Corporation results Q3 2017
Suominen Corporation results Q3 2017Suominen Corporation results Q3 2017
Suominen Corporation results Q3 2017Suominen Corporation
 
Suominen Oyj:n tulosesitys Q3 2017
Suominen Oyj:n tulosesitys Q3 2017Suominen Oyj:n tulosesitys Q3 2017
Suominen Oyj:n tulosesitys Q3 2017Suominen Corporation
 
Suominen at Small Mid Cap Forum in London, on 26 September 2017
Suominen at Small Mid Cap Forum in London, on 26 September 2017Suominen at Small Mid Cap Forum in London, on 26 September 2017
Suominen at Small Mid Cap Forum in London, on 26 September 2017Suominen Corporation
 
Suominen Oyj:n tulosesitys Q2 2017
Suominen Oyj:n tulosesitys Q2 2017Suominen Oyj:n tulosesitys Q2 2017
Suominen Oyj:n tulosesitys Q2 2017Suominen Corporation
 
Suominen Corporation results Q2 2017
Suominen Corporation results Q2 2017Suominen Corporation results Q2 2017
Suominen Corporation results Q2 2017Suominen Corporation
 
Suominen Oyj:n puolivuosikatsaus 1.1.-30.6.2017
Suominen Oyj:n puolivuosikatsaus 1.1.-30.6.2017Suominen Oyj:n puolivuosikatsaus 1.1.-30.6.2017
Suominen Oyj:n puolivuosikatsaus 1.1.-30.6.2017Suominen Corporation
 

More from Suominen Corporation (20)

Suominen Corporation results Q3/2018
Suominen Corporation results Q3/2018Suominen Corporation results Q3/2018
Suominen Corporation results Q3/2018
 
Suominen Oyj:n tulosesitys Q3 2018
Suominen Oyj:n tulosesitys Q3 2018Suominen Oyj:n tulosesitys Q3 2018
Suominen Oyj:n tulosesitys Q3 2018
 
Suominen Corporation results Q2 2018
Suominen Corporation results Q2 2018Suominen Corporation results Q2 2018
Suominen Corporation results Q2 2018
 
Suominen Oyj:n tulosesitys Q2 2018
Suominen Oyj:n tulosesitys Q2 2018Suominen Oyj:n tulosesitys Q2 2018
Suominen Oyj:n tulosesitys Q2 2018
 
Suominen Corporation results Q1 2018
Suominen Corporation results Q1 2018Suominen Corporation results Q1 2018
Suominen Corporation results Q1 2018
 
Suominen Oyj:n tulosesitys Q1 2018
Suominen Oyj:n tulosesitys Q1 2018Suominen Oyj:n tulosesitys Q1 2018
Suominen Oyj:n tulosesitys Q1 2018
 
Suominen at Pörssi-ilta in Turku on 20 March 2018
Suominen at Pörssi-ilta in Turku on 20 March 2018Suominen at Pörssi-ilta in Turku on 20 March 2018
Suominen at Pörssi-ilta in Turku on 20 March 2018
 
Toimitusjohtajan katsaus, Suominen Oyj:n yhtiökokous 2018
Toimitusjohtajan katsaus, Suominen Oyj:n yhtiökokous 2018Toimitusjohtajan katsaus, Suominen Oyj:n yhtiökokous 2018
Toimitusjohtajan katsaus, Suominen Oyj:n yhtiökokous 2018
 
Suominen at Pörssiaamu in Helsinki, Finland, on 1 March 2018
Suominen at Pörssiaamu in Helsinki, Finland, on 1 March 2018 Suominen at Pörssiaamu in Helsinki, Finland, on 1 March 2018
Suominen at Pörssiaamu in Helsinki, Finland, on 1 March 2018
 
Suominen at European Midcap Event in Frankfurt on 6 February 2018
Suominen at European Midcap Event in Frankfurt on 6 February 2018Suominen at European Midcap Event in Frankfurt on 6 February 2018
Suominen at European Midcap Event in Frankfurt on 6 February 2018
 
Suominen Oyj:n tulosesitys Q4 ja FY 2017
Suominen Oyj:n tulosesitys Q4 ja FY 2017Suominen Oyj:n tulosesitys Q4 ja FY 2017
Suominen Oyj:n tulosesitys Q4 ja FY 2017
 
Suominen Corporation results Q4 and FY 2017
Suominen Corporation results Q4 and FY 2017Suominen Corporation results Q4 and FY 2017
Suominen Corporation results Q4 and FY 2017
 
Suominen @ Yhtiöilta, Helsinki 21.11.2017
Suominen @ Yhtiöilta, Helsinki 21.11.2017Suominen @ Yhtiöilta, Helsinki 21.11.2017
Suominen @ Yhtiöilta, Helsinki 21.11.2017
 
Suominen @ Pörssi-ilta, Tampere 31.10.2017
Suominen @ Pörssi-ilta, Tampere 31.10.2017Suominen @ Pörssi-ilta, Tampere 31.10.2017
Suominen @ Pörssi-ilta, Tampere 31.10.2017
 
Suominen Corporation results Q3 2017
Suominen Corporation results Q3 2017Suominen Corporation results Q3 2017
Suominen Corporation results Q3 2017
 
Suominen Oyj:n tulosesitys Q3 2017
Suominen Oyj:n tulosesitys Q3 2017Suominen Oyj:n tulosesitys Q3 2017
Suominen Oyj:n tulosesitys Q3 2017
 
Suominen at Small Mid Cap Forum in London, on 26 September 2017
Suominen at Small Mid Cap Forum in London, on 26 September 2017Suominen at Small Mid Cap Forum in London, on 26 September 2017
Suominen at Small Mid Cap Forum in London, on 26 September 2017
 
Suominen Oyj:n tulosesitys Q2 2017
Suominen Oyj:n tulosesitys Q2 2017Suominen Oyj:n tulosesitys Q2 2017
Suominen Oyj:n tulosesitys Q2 2017
 
Suominen Corporation results Q2 2017
Suominen Corporation results Q2 2017Suominen Corporation results Q2 2017
Suominen Corporation results Q2 2017
 
Suominen Oyj:n puolivuosikatsaus 1.1.-30.6.2017
Suominen Oyj:n puolivuosikatsaus 1.1.-30.6.2017Suominen Oyj:n puolivuosikatsaus 1.1.-30.6.2017
Suominen Oyj:n puolivuosikatsaus 1.1.-30.6.2017
 

Recently uploaded

VIP 7001035870 Find & Meet Hyderabad Call Girls Shamirpet high-profile Call Girl
VIP 7001035870 Find & Meet Hyderabad Call Girls Shamirpet high-profile Call GirlVIP 7001035870 Find & Meet Hyderabad Call Girls Shamirpet high-profile Call Girl
VIP 7001035870 Find & Meet Hyderabad Call Girls Shamirpet high-profile Call Girladitipandeya
 
High Profile Call Girls Kolkata Trisha 🤌 8250192130 🚀 Vip Call Girls Kolkata
High Profile Call Girls Kolkata Trisha 🤌  8250192130 🚀 Vip Call Girls KolkataHigh Profile Call Girls Kolkata Trisha 🤌  8250192130 🚀 Vip Call Girls Kolkata
High Profile Call Girls Kolkata Trisha 🤌 8250192130 🚀 Vip Call Girls Kolkataanamikaraghav4
 
✂️ 👅 Independent Goregaon Escorts With Room Vashi Call Girls 💃 9004004663
✂️ 👅 Independent Goregaon Escorts With Room Vashi Call Girls 💃 9004004663✂️ 👅 Independent Goregaon Escorts With Room Vashi Call Girls 💃 9004004663
✂️ 👅 Independent Goregaon Escorts With Room Vashi Call Girls 💃 9004004663Call Girls Mumbai
 
VIP Kolkata Call Girl Entally 👉 8250192130 Available With Room
VIP Kolkata Call Girl Entally 👉 8250192130  Available With RoomVIP Kolkata Call Girl Entally 👉 8250192130  Available With Room
VIP Kolkata Call Girl Entally 👉 8250192130 Available With Roomdivyansh0kumar0
 
如何办理北卡罗来纳大学教堂山分校毕业证(文凭)UNC学位证书
如何办理北卡罗来纳大学教堂山分校毕业证(文凭)UNC学位证书如何办理北卡罗来纳大学教堂山分校毕业证(文凭)UNC学位证书
如何办理北卡罗来纳大学教堂山分校毕业证(文凭)UNC学位证书Fir La
 
Russian Call Girls Kolkata Amaira 🤌 8250192130 🚀 Vip Call Girls Kolkata
Russian Call Girls Kolkata Amaira 🤌  8250192130 🚀 Vip Call Girls KolkataRussian Call Girls Kolkata Amaira 🤌  8250192130 🚀 Vip Call Girls Kolkata
Russian Call Girls Kolkata Amaira 🤌 8250192130 🚀 Vip Call Girls Kolkataanamikaraghav4
 
Short-, Mid-, and Long-term gxxoals.pptx
Short-, Mid-, and Long-term gxxoals.pptxShort-, Mid-, and Long-term gxxoals.pptx
Short-, Mid-, and Long-term gxxoals.pptxHenryBriggs2
 
《加州大学圣克鲁兹分校学位证书复制》Q微信741003700美国学历疑难问题指南|挂科被加州大学圣克鲁兹分校劝退没有毕业证怎么办?《UCSC毕业证购买|加...
《加州大学圣克鲁兹分校学位证书复制》Q微信741003700美国学历疑难问题指南|挂科被加州大学圣克鲁兹分校劝退没有毕业证怎么办?《UCSC毕业证购买|加...《加州大学圣克鲁兹分校学位证书复制》Q微信741003700美国学历疑难问题指南|挂科被加州大学圣克鲁兹分校劝退没有毕业证怎么办?《UCSC毕业证购买|加...
《加州大学圣克鲁兹分校学位证书复制》Q微信741003700美国学历疑难问题指南|挂科被加州大学圣克鲁兹分校劝退没有毕业证怎么办?《UCSC毕业证购买|加...wyqazy
 
slideshare Call girls Noida Escorts 9999965857 henakhan
slideshare Call girls Noida Escorts 9999965857 henakhanslideshare Call girls Noida Escorts 9999965857 henakhan
slideshare Call girls Noida Escorts 9999965857 henakhanhanshkumar9870
 
OKC Thunder Reveal Game 2 Playoff T Shirts
OKC Thunder Reveal Game 2 Playoff T ShirtsOKC Thunder Reveal Game 2 Playoff T Shirts
OKC Thunder Reveal Game 2 Playoff T Shirtsrahman018755
 
VIP Kolkata Call Girls Bidhannagar 8250192130 Available With Room
VIP Kolkata Call Girls Bidhannagar 8250192130 Available With RoomVIP Kolkata Call Girls Bidhannagar 8250192130 Available With Room
VIP Kolkata Call Girls Bidhannagar 8250192130 Available With Roomrran7532
 

Recently uploaded (20)

VIP 7001035870 Find & Meet Hyderabad Call Girls Shamirpet high-profile Call Girl
VIP 7001035870 Find & Meet Hyderabad Call Girls Shamirpet high-profile Call GirlVIP 7001035870 Find & Meet Hyderabad Call Girls Shamirpet high-profile Call Girl
VIP 7001035870 Find & Meet Hyderabad Call Girls Shamirpet high-profile Call Girl
 
High Profile Call Girls Kolkata Trisha 🤌 8250192130 🚀 Vip Call Girls Kolkata
High Profile Call Girls Kolkata Trisha 🤌  8250192130 🚀 Vip Call Girls KolkataHigh Profile Call Girls Kolkata Trisha 🤌  8250192130 🚀 Vip Call Girls Kolkata
High Profile Call Girls Kolkata Trisha 🤌 8250192130 🚀 Vip Call Girls Kolkata
 
Russian Call Girls Rohini Sector 22 💓 Delhi 9999965857 @Sabina Modi VVIP MODE...
Russian Call Girls Rohini Sector 22 💓 Delhi 9999965857 @Sabina Modi VVIP MODE...Russian Call Girls Rohini Sector 22 💓 Delhi 9999965857 @Sabina Modi VVIP MODE...
Russian Call Girls Rohini Sector 22 💓 Delhi 9999965857 @Sabina Modi VVIP MODE...
 
✂️ 👅 Independent Goregaon Escorts With Room Vashi Call Girls 💃 9004004663
✂️ 👅 Independent Goregaon Escorts With Room Vashi Call Girls 💃 9004004663✂️ 👅 Independent Goregaon Escorts With Room Vashi Call Girls 💃 9004004663
✂️ 👅 Independent Goregaon Escorts With Room Vashi Call Girls 💃 9004004663
 
VIP Kolkata Call Girl Entally 👉 8250192130 Available With Room
VIP Kolkata Call Girl Entally 👉 8250192130  Available With RoomVIP Kolkata Call Girl Entally 👉 8250192130  Available With Room
VIP Kolkata Call Girl Entally 👉 8250192130 Available With Room
 
Call Girls 🫤 Nehru Place ➡️ 9999965857 ➡️ Delhi 🫦 Russian Escorts FULL ENJOY
Call Girls 🫤 Nehru Place ➡️ 9999965857  ➡️ Delhi 🫦  Russian Escorts FULL ENJOYCall Girls 🫤 Nehru Place ➡️ 9999965857  ➡️ Delhi 🫦  Russian Escorts FULL ENJOY
Call Girls 🫤 Nehru Place ➡️ 9999965857 ➡️ Delhi 🫦 Russian Escorts FULL ENJOY
 
Rohini Sector 17 Call Girls Delhi 9999965857 @Sabina Saikh No Advance
Rohini Sector 17 Call Girls Delhi 9999965857 @Sabina Saikh No AdvanceRohini Sector 17 Call Girls Delhi 9999965857 @Sabina Saikh No Advance
Rohini Sector 17 Call Girls Delhi 9999965857 @Sabina Saikh No Advance
 
Escort Service Call Girls In Shalimar Bagh, 99530°56974 Delhi NCR
Escort Service Call Girls In Shalimar Bagh, 99530°56974 Delhi NCREscort Service Call Girls In Shalimar Bagh, 99530°56974 Delhi NCR
Escort Service Call Girls In Shalimar Bagh, 99530°56974 Delhi NCR
 
如何办理北卡罗来纳大学教堂山分校毕业证(文凭)UNC学位证书
如何办理北卡罗来纳大学教堂山分校毕业证(文凭)UNC学位证书如何办理北卡罗来纳大学教堂山分校毕业证(文凭)UNC学位证书
如何办理北卡罗来纳大学教堂山分校毕业证(文凭)UNC学位证书
 
Preet Vihar (Delhi) 9953330565 Escorts, Call Girls Services
Preet Vihar (Delhi) 9953330565 Escorts, Call Girls ServicesPreet Vihar (Delhi) 9953330565 Escorts, Call Girls Services
Preet Vihar (Delhi) 9953330565 Escorts, Call Girls Services
 
Russian Call Girls Kolkata Amaira 🤌 8250192130 🚀 Vip Call Girls Kolkata
Russian Call Girls Kolkata Amaira 🤌  8250192130 🚀 Vip Call Girls KolkataRussian Call Girls Kolkata Amaira 🤌  8250192130 🚀 Vip Call Girls Kolkata
Russian Call Girls Kolkata Amaira 🤌 8250192130 🚀 Vip Call Girls Kolkata
 
Short-, Mid-, and Long-term gxxoals.pptx
Short-, Mid-, and Long-term gxxoals.pptxShort-, Mid-, and Long-term gxxoals.pptx
Short-, Mid-, and Long-term gxxoals.pptx
 
《加州大学圣克鲁兹分校学位证书复制》Q微信741003700美国学历疑难问题指南|挂科被加州大学圣克鲁兹分校劝退没有毕业证怎么办?《UCSC毕业证购买|加...
《加州大学圣克鲁兹分校学位证书复制》Q微信741003700美国学历疑难问题指南|挂科被加州大学圣克鲁兹分校劝退没有毕业证怎么办?《UCSC毕业证购买|加...《加州大学圣克鲁兹分校学位证书复制》Q微信741003700美国学历疑难问题指南|挂科被加州大学圣克鲁兹分校劝退没有毕业证怎么办?《UCSC毕业证购买|加...
《加州大学圣克鲁兹分校学位证书复制》Q微信741003700美国学历疑难问题指南|挂科被加州大学圣克鲁兹分校劝退没有毕业证怎么办?《UCSC毕业证购买|加...
 
Model Call Girl in Uttam Nagar Delhi reach out to us at 🔝9953056974🔝
Model Call Girl in Uttam Nagar Delhi reach out to us at 🔝9953056974🔝Model Call Girl in Uttam Nagar Delhi reach out to us at 🔝9953056974🔝
Model Call Girl in Uttam Nagar Delhi reach out to us at 🔝9953056974🔝
 
Falcon Invoice Discounting - Best Platform
Falcon Invoice Discounting - Best PlatformFalcon Invoice Discounting - Best Platform
Falcon Invoice Discounting - Best Platform
 
slideshare Call girls Noida Escorts 9999965857 henakhan
slideshare Call girls Noida Escorts 9999965857 henakhanslideshare Call girls Noida Escorts 9999965857 henakhan
slideshare Call girls Noida Escorts 9999965857 henakhan
 
Model Call Girl in Udyog Vihar Delhi reach out to us at 🔝9953056974🔝
Model Call Girl in Udyog Vihar Delhi reach out to us at 🔝9953056974🔝Model Call Girl in Udyog Vihar Delhi reach out to us at 🔝9953056974🔝
Model Call Girl in Udyog Vihar Delhi reach out to us at 🔝9953056974🔝
 
Call Girls In Vasant Kunj 📱 9999965857 🤩 Delhi 🫦 HOT AND SEXY VVIP 🍎 SERVICE
Call Girls In Vasant Kunj 📱  9999965857  🤩 Delhi 🫦 HOT AND SEXY VVIP 🍎 SERVICECall Girls In Vasant Kunj 📱  9999965857  🤩 Delhi 🫦 HOT AND SEXY VVIP 🍎 SERVICE
Call Girls In Vasant Kunj 📱 9999965857 🤩 Delhi 🫦 HOT AND SEXY VVIP 🍎 SERVICE
 
OKC Thunder Reveal Game 2 Playoff T Shirts
OKC Thunder Reveal Game 2 Playoff T ShirtsOKC Thunder Reveal Game 2 Playoff T Shirts
OKC Thunder Reveal Game 2 Playoff T Shirts
 
VIP Kolkata Call Girls Bidhannagar 8250192130 Available With Room
VIP Kolkata Call Girls Bidhannagar 8250192130 Available With RoomVIP Kolkata Call Girls Bidhannagar 8250192130 Available With Room
VIP Kolkata Call Girls Bidhannagar 8250192130 Available With Room
 

Suominen Corporation Annual Report 2015

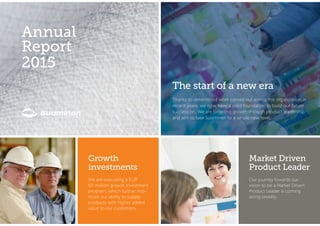
  • 1. Growth investments We are executing a EUR 60 million growth investment program, which further imp- roves our ability to supply products with higher added value to our customers. Market Driven Product Leader Our journey towards our vision to be a Market Driven Product Leader is coming along steadily. The start of a new era Thanks to determined work carried out across the organization in recent years, we now have a solid foundation to build our future success on. We are targeting growth through product leadership and aim to take Suominen to a whole new level. Report 2015 Annual
  • 2. Suominen in brief / How we create value / Year 2015 / Business / Sustainability / Governance / Financial Statements Contents Suominen in brief ..................................................................... 3 How we create value ............................................................... 5 Value chain .................................................................................. 6 Value Creation Model ............................................................... 8 Strategy ......................................................................................... 10 Year 2015 ..................................................................................... 11 From the President & CEO ...................................................... 12 Strategy execution – key events ............................................. 15 Key figures .................................................................................... 16 Business ........................................................................................ 17 Operating environment ............................................................ 18 Convenience business area .................................................... 23 Care business area ..................................................................... 25 Growth investment program .................................................. 27 Sustainability ............................................................................... 29 Sustainability strategy ................................................................ 30 Social responsibility ................................................................... 32 Environmental responsibility ................................................... 35 Economic responsibility ........................................................... 37 Governance ................................................................................ 38 Corporate Governance Statement ........................................ 39 Letter from the Chair of Personnel and Remuneration Committee ..................................................... 45 Remuneration Statement ......................................................... 46 Board of Directors ...................................................................... 50 Corporate Executive Team ...................................................... 51 Financial Statements ................................................................ 52 Report by the Board of Directors .......................................... 52 Financial statements .................................................................. 61 Consolidated financial statements ................................... 62 Parent company financial statements ............................. 114 Proposal by the Board of Directors for distribution of funds ....................................................... 124 Auditor’s report ........................................................................... 125 Information for shareholders................................................... 126 Suominen in brief / How we create value / Year 2015 / Business / Sustainability / Governance / Financial Statements Sustainability Year 2015 How we create value Business 2 / 127 Suominen Corporation Annual Report 2015
  • 3. Suominen in brief / How we create value / Year 2015 / Business / Sustainability / Governance / Financial Statements Suominen in brief Suominen manufactures nonwovens as roll goods for wipes and for hygiene prod- ucts and medical applications. Suominen is the global market leader in nonwovens for wipes. The company employs over 600 people in Europe and in the Americas. The Suominen share (SUY1V) is listed on the Nas- daq Helsinki Stock Exchange. Every year, Suominen produces enough nonwovens to cover more than 11 million tennis courts. Wiping products made of Suominen’s non- wovens include, for instance, wet wipes for personal hygiene and baby care, as well as for household and workplace wiping. The company’s hygiene product applications include, for example, sanitary pads, diapers and adult incontinence products. Surgical drapes and swabs are examples of the medi- cal applications. Suominen’s locations 47 Paulínia BRAZIL 111 Nakkila 15 Helsinki, Head office FINLAND 40 Cressa 98 Mozzate ITALY 66 Alicante SPAIN 35 Windsor Locks 105 Green Bay 117 Bethune USA Suominen in brief / How we create value / Year 2015 / Business / Sustainability / Governance / Financial Statements 2 Lyon France 3 / 127 Suominen Corporation Annual Report 2015
  • 4. Suominen in brief / How we create value / Year 2015 / Business / Sustainability / Governance / Financial StatementsSuominen in brief / How we create value / Year 2015 / Business / Sustainability / Governance / Financial Statements Convenience accounted for 93% of Suominen’s net sales. 93 % Suominen as a company • The global market leader in nonwovens for wipes, 9th largest of all nonwovens suppliers • Two business areas: Convenience and Care • The Convenience business area offers high value-added nonwovens for a range of wiping applications. • The Care business area provides high-performance nonwovens for use in hygiene and medical products. Five reasons to invest in Suominen 1. Our production plants are located on three continents, in key market areas close to our customers. 2. We operate in growing markets. 3. Our customer relationships are often global and long-term – more than 10 years on average. 4. We have a clear vision and an ambitious strategy to achieve it – with a promising track record. 5. Our dividend policy is to distribute approximately 30% of our profit for the period in annual dividends. Care accounted for 7% of Suominen’s net sales. 7 % Our dividend policy is to distribute approximately 30% of our profit for the period in annual dividends. ~30 % Read more > Business section Read more at suominen.fi > About us > Investors w 4 / 127 Suominen Corporation Annual Report 2015
  • 5. Suominen in brief / How we create value / Year 2015 / Business / Sustainability / Governance / Financial Statements How we create value Our purpose is to make nonwovens continuously better for people. At the same time, Suominen creates value through its operations for all its stakeholders – e.g., customers, employees and shareholders. 15.9% Return on invested capital (ROI) in 2015 End user The end user of Suominen’s nonwovens can be either a consumer or a professional. Understanding the end user – whether a consumer or a professional – is at the heart of Suominen’s strategy. Suominen in brief / How we create value / Year 2015 / Business / Sustainability / Governance / Financial Statements 5 / 127 Suominen Corporation Annual Report 2015
  • 6. Suominen in brief / How we create value / Year 2015 / Business / Sustainability / Governance / Financial Statements Suominen’s value chain Nonwovens manufacturer, Suominen Brand owner Retailer Consumer Converter, e.g., wet wipe manufacturer Fiber producerPrimary production The divestments executed in the last few years have clarified Suominen’s position in the value chain. Today, Suominen is a 100% nonwovens manufacturer and is located midway in the value chain, between fiber producers and end-product manufacturers (converters) and brand owners. Although Suominen operates business- to-business, understanding the end user – whether a consumer or a professional using a product made of nonwovens – is at the heart of our strategy. We cannot achieve our vision to be a Market Driven Product Leader without being able to proactively forecast what our customers and end users will need in the future. Value chain Suominen is a 100% nonwovens manufacturer 100 % Suominen in brief / How we create value / Year 2015 / Business / Sustainability / Governance / Financial Statements 6 / 127 Suominen Corporation Annual Report 2015
  • 7. Suominen in brief / How we create value / Year 2015 / Business / Sustainability / Governance / Financial Statements We Love Wipes aims to increase consumer awareness of disposable nonwoven products by providing brand-free information on the wide range of products, their different end-use applications and various features – all in a fun and entertaining way. And since the dialogue is two-way, We Love Wipes provides Suominen with valuable information about consumer needs and, in turn, enables us to de- velop new nonwoven products with higher added value. In 2015, Suominen boosted its utilization of consumer data in product development and customer cooperation. Focused, in-depth information collected through We Love Wipes is a valuable asset for us and, therefore, we will con- We Love Wipes, Suominen’s digital consumer dialogue program launched back in 2013, continued in 2015. Nowadays, the We Love Wipes community consists of nearly 25,000 followers who are not afraid to share their thoughts on and experiences with nonwovens products. tinue deepening our consumer understanding in order to find opportunities, support product development projects and, ultimately, bring more value to our cus- tomers. Follow We Love Wipes on Twitter @welovewipes and on Facebook or see www.welovewipes.com Case Valuable information through We Love Wipes Suominen in brief / How we create value / Year 2015 / Business / Sustainability / Governance / Financial Statements 7 / 127 Suominen Corporation Annual Report 2015
  • 8. Suominen in brief / How we create value / Year 2015 / Business / Sustainability / Governance / Financial Statements Funding • Cash flow from operations (EUR 27.3 million) • Total liabilities (EUR 166.0 million) • Hybrid bond and equity (EUR 125.7 million) Natural resources • Water (5,542,291 m3 ) • Raw materials (138,215 tons) Wood-based Oil-based • Energy (1,683,166 GJ) Natural gas Grid electricity Steam People • Over 600 employees • Employee training (EUR 122,902) Intellectual capabilities • Suominen brand • The Suominen Way • R&D • Patents • Professional & leadership capabilities • ICT systems Social relationships • Customer relations • R&D cooperation with stakeholders • Consumer dialogue • Suppliers • Manufacturing partners • Local communities • Professional networks Manufacturing platform • Eight production plants • Geographically and technically broad manufacturing base Customers • Accelerated business • Improved product performance • Suominen brand value • Customer satisfaction Employees • Wages and salaries (EUR 34.8 million) • Professional development • Striving for non-discrimination and equal opportunities • Safe workplace (AFR 8.29) Partners • Payments (EUR 322.3 million) • Business growth • Ethical business Shareholders • Funds paid (EUR 0.01 per share) • Market value increase (53% in 2015) Environment • Waste and emissions load from operations and end-products • Compostable and dispersible end-products • No untreated water Society • More convenient lifestyle • Improved hygiene • Contribution to reducing the number of infections • Corporate income taxes paid (EUR 8.3 million) • Employment Products & solutions • Nonwovens for wipes, hygiene products and medical applications • Product development (Six new branded products in 2015) Brands • We Love Wipes • Product brands Waste & emissions • Direct and indirect greenhouse gas emissions (140,774 tons) • Waste to landfill (916 tons) • Treated water from operations Vision: Market Driven Product Leader Strategy: 1. Deliver superior value in thoughtfully selected market applications 2. Drive proactive key account manage- ment for mutual value creation 3. Execute demand-driven supply chain 4. Evolve culture and capabilities to build a strong product company Our purpose is to make nonwovens continuously better for people. Emerging global middle class Aging population Population growth Rising healthcare expenditure Growing consciousness of health Legislation Resources Strategy and operating environment Outputs Impacts Value Creation Model Information concerning year 2015 in brackets. Suominen in brief / How we create value / Year 2015 / Business / Sustainability / Governance / Financial Statements 8 / 127 Suominen Corporation Annual Report 2015
  • 9. Suominen in brief / How we create value / Year 2015 / Business / Sustainability / Governance / Financial Statements How does the Model work? Suominen’s Value Creation Model depicts our whole value creation process: what kind of resources we utilize in executing our strat- egy, what are the outputs and, ultimately, the impacts of our business activities. The Model reflects Suominen’s intent to gradu- ally progress towards so-called integrated reporting scheme. The Value Creation Model is basically our business model in a nutshell, which means that only the most essential matters are listed. Still, not all listed matters bear equal importance, nor is their respective relevance presented in the model. That’s why the mod- el should be considered primarily as a whole. In the Value Creation Model, Resources are what we utilize in our business activities. The Strategy section describes the heart of Suominen’s business together with some of the external drivers, such as megatrends, that may have an impact on our operating environment. Outputsarewhatcomesoutofourbusiness activities. Impacts describe how our business activities and our outputs affect the world around us. Suominen in brief / How we create value / Year 2015 / Business / Sustainability / Governance / Financial Statements 9 / 127 Suominen Corporation Annual Report 2015
  • 10. Suominen in brief / How we create value / Year 2015 / Business / Sustainability / Governance / Financial Statements Vision – where? Strategy – how? Financial targets • Deliver superior value in thoughtfully selected market applications • Drive proactive key account management for mutual value creation • Execute demand-driven supply chain • Evolve culture and capabilities to build a strong product company Market Driven Product Leader • Organic net sales growth at a rate that exceeds the industry average (approx. 3%) • A return on investment of more than 12% • A gearing ratio between 40% and 80% Purpose – why? Our purpose is to make nonwovens continuously better for people Vision – where? Our vision, to be a Market Driven Product Leader, re- flects where Suominen is headed and what we want to be at the end of this strat- egy period. Strategy – how? Our strategy defines how Suominen will achieve its vi- sion and the targets set for this strategy period. In the execution of the strategy, we will focus on develop- ing four key areas. If we succeed in the ex- ecution of our strategy, Strategy 2015–2017 Read more at suominen.fi > About Us / Strategy w Read more > Business section > From the President & CEO Suominen’s net sales will amount to approximately EUR 500 million by the end of 2017. Purpose – why? Suominen’s purpose is to make nonwovens continu- ously better for people. It is the reason for our existence and the foundation of eve- rything we do at Suominen. It tells us what we actually work for. Therefore, it is also a fundamental part of our strategies – the previous, current and next one as well. Suominen in brief / How we create value / Year 2015 / Business / Sustainability / Governance / Financial Statements 10 / 127 Suominen Corporation Annual Report 2015
  • 11. Suominen in brief / How we create value / Year 2015 / Business / Sustainability / Governance / Financial StatementsSuominen in brief / How we create value / Year 2015 / Business / Sustainability / Governance / Financial Statements 60 Estimated value of Suominen’s growth investment program Year 2015 After a successful turnaround, Suominen is moving forward and aiming for growth. The positive trend in Suominen’s financial development continued in 2015 and, as our investments in production technology and improvements in product development capability and capacity demonstrate, the implementation of our strategy is progressing as scheduled. EUR million Darryl Fournier Plant Manager, Bethune, SC, USA The Bethune investment is the most significant project in Suominen’s growth investment program. 11 / 127 Suominen Corporation Annual Report 2015
  • 12. Suominen in brief / How we create value / Year 2015 / Business / Sustainability / Governance / Financial Statements Nina Kopola President & CEO Year 2015 marked the start of a new era at Suominen. Thanks to determined work car- ried out across the organization in recent years, we have turned the business around and now have a solid foundation to build our future success on. As stated in our strat- egy for 2015–2017, we are targeting growth through product leadership and, indeed, aim to take Suominen to a whole new level. Favorable development on three continents In light of the consumer confidence indices, the operating environment remained quite From the President & CEO Becoming a Market Driven Product Leader Suominen in brief / How we create value / Year 2015 / Business / Sustainability / Governance / Financial Statements 12 / 127 Suominen Corporation Annual Report 2015
  • 13. Suominen in brief / How we create value / Year 2015 / Business / Sustainability / Governance / Financial Statements healthy in our main market areas of Europe and North America. In South America, in Bra- zil in particular, the brisk economic growth seen in recent years took a downward turn. This has not damaged our business in the area, however, since demand for nonwo- ven products is not very cyclical. As of the acquisition of the Paulínia plant in Brazil in early 2014, we have progressed in the South American markets as planned. Profitability improved, dividend proposal EUR 0.02 per share Suominen’s financial development in 2015 corresponded with our positive outlook statement issued on October 2015, even though the last quarter of the year fell short of expectations. In 2015, our net sales grew by 10.5% to EUR 444.0 million, supported by the strengthening of the US dollar. Our operating profit margin increased to 7.0%. Our cash flow from operations remained strong, as we expected, at EUR 27.3 million. Suominen’s net profit for 2015 amounted to EUR 17.0 million, corresponding to earnings per share of EUR 0.06. The Board of Directors of Suominen proposes to the Annual General Meeting a dividend of EUR 0.02 per share to be paid for the financial year 2015. The proposal is in line with the dividend policy issued by the Board of Directors in the fall of 2014. As the financial figures demonstrate, Suominen’s turnaround has been successful. It has also been recognized by the investor community: At the end of 2015, Suominen’s market capitalization amounted to EUR 312 million and Nasdaq Helsinki transferred Suominen from the Small Cap segment to Mid Cap as of 4 January 2016. Strategy execution: solid progress on all fronts I am very delighted with Suominen team’s ability to take significant steps to imple- ment the growth strategy during 2015. Our strategy includes four focus areas – supe- rior product offering, proactive key account management, demand-driven supply chain, and strong corporate culture and capabilities – and we have executed important activities within each of them. If I were to select a few highlights from the past year, I would naturally bring forth the determined progress in our EUR 60 million growth investment program and the persis- tent work done to enhance the product de- velopment process. Largest organic investment in Suominen’s history to be implemented in Bethune Our growth investment program was, in fact, launched already in late 2014 with the an- nouncement of three initiatives at our plants in Paulínia, Brazil; Alicante, Spain, and Nak- kila, Finland, with a total value of some EUR 4 million. At Paulínia and Alicante, we made improvements to existing lines, allowing us to broaden our product offering to non- wovens with higher added value, such as nonwovens for medical applications. At the Nakkila plant, we restarted a production line that was closed down in 2012, thus enabling us to meet the improved demand in the Eu- ropean market. And the good news continued into Janu- ary 2015, when we disclosed the single larg- est initiative in the entire growth investment program: a plan to build a new production line in North America. The decision was made to install the new production line, with a total value of close to EUR 50 million, at our Bethune plant in South Carolina, USA. With this investment, Suominen will take wetlaid technology to a whole new level in the nonwovens industry. The new manu- facturing line will be tailor-made, based on our unique technological expertise, enabling us to supply our customers with exclusive, best-in-class nonwoven products. This is perfectly in line with our strategic intent to achieve product leadership. In September 2015, we decided to raise the total value of the growth investment pro- gram to EUR 60 million from the original range of EUR 30–50 million, thanks to the Suominen in brief / How we create value / Year 2015 / Business / Sustainability / Governance / Financial Statements 13 / 127 Suominen Corporation Annual Report 2015
  • 14. Suominen in brief / How we create value / Year 2015 / Business / Sustainability / Governance / Financial Statements promising growth prospects identified in nonwovens with higher added value. Suominen Innovation Machine up and running During 2015, we made numerous efforts to improve our product development process. We enhanced our product development ca- pabilities by building the Suominen Innova- tion Machine – a full product development process with a strong focus on front-end in- novations and a formal Stage-and-Gate pro- cedure to ensure that ideas are transformed into commercial products as efficiently as possible. On the other hand, the fairly strict Stage-and-Gate procedure allows us also to “fail fast” in product development – that is, to terminate development projects early enough if set criteria are not met. Having a firm process for terminating projects with an uncertain outlook enables us to allocate resources to those initiatives that have more promising opportunities for success. In addition to enhancing our capabilities, we improved our product development ca- pacity by making several important recruit- ments to the Product Development team. We estimate that our strong focus on R&D will be reflected also in R&D spending, which is forecasted to increase above 1% of our net sales (0.8% in 2015). The efforts made in Suominen’s product development started to bear fruit already in 2015. Suominen launched a total of six new branded products in the market: five in our emerging Care business area and one in Convenience. The launches reflect our de- termination to grow the business and make our product leadership vision a reality. Suominen implements blind hiring process as a forerunner in the industry As stated in our sustainability strategy, we are focusing our sustainability activities on three areas: product leadership, sustainable opera- tions and responsible value chain. We have initiated activities under all three themes, and this work continues in 2016. In 2015, Suominen launched an impor- tant initiative to promote diversity and equal opportunities in the company. We have clearly expressed in our Code of Conduct that at Suominen, we will not discriminate against anyone for any reason and have committed to act as a fair employer in all circumstances. As a concrete measure, we wanted to find ways to ensure that – often unconscious – biases do not affect the hiring process at Suominen. We decided to pilot so-called blind hiring in fall of 2015. In blind hiring, the applicant’s name and other personal data are hidden, and the re- cruiter can focus on the relevant factors, such as the candidate’s experience and ex- pertise; not, for example, on their gender or ethnic origin. The pilot recruitment was successful and we aim to have blind hiring as the default approach in recruiting across Suominen in 2016. I see this as a prime ex- ample of our pragmatic, results-oriented ap- proach to sustainability. To those behind our success The end of 2015 also wraps up the first leg of our three-year strategy period. Suominen made great progress and we continue to climb towards our vision of being a Market Driven Product Leader. Making this ambi- tious vision come true will definitely chal- lenge us at Suominen in many ways in the years to come, but I am confident that with our determined and talented team of ex- perts, it is well within our reach. I send my sincere thanks to the entire Suominen team for your great commit- ment and can-do attitude. I would also like to warmly thank our customers, business partners and shareholders for their sustained confidence in us and our endeavors. We at Suominen are continuing towards our vision and we warmly welcome you to join us on this journey. Nina Kopola President & CEO Suominen in brief / How we create value / Year 2015 / Business / Sustainability / Governance / Financial Statements 14 / 127 Suominen Corporation Annual Report 2015
  • 15. Suominen in brief / How we create value / Year 2015 / Business / Sustainability / Governance / Financial Statements Year of steadfast strategy execution 16 January Suominen launc­hed FIBRELLA® Lite on the global hygiene mar- ket. It combines traditional- ly incompatible nonwoven features – such as softness, strength and light weight – in one material. 28 January As the forerunner in the nonwo- vens industry, Suominen introduced HYDRASPUN® Dispersible Plus, the next- generation nonwoven for the growing market of flushable applications. 30 January As a key step in its growth investment program, Suominen started a planning process for an investment in a new wetlaid production line. The invest- Year of steadfast strategy execution All Suominen’s releases published in 2015 can be found at www.suominen.fi. w ment will be the single larg- est initiative in Suominen’s growth investment program. 3 March Suominen intro- duced FIBRELLA® Perf to the emerging South Ameri- can market of medical nonwovens. The product is suitable for both traditional and advanced wound care as well as for surgical ap- plications. 19 March The Annual General Meeting of Suominen decided, among other things, to distribute a total of EUR 2.5 million in funds to Suominen’s shareholders. This was the first time Suominen’s shareholders were paid funds since 2010. 27 May Suominen con- firmed the plan to invest in a new production line at its Bethune plant in South Carolina, USA. In the first phase, the new line will focus on nonwovens for household, workplace and flushable wipes. 1 September Suominen decided to extend its growth investment pro- gram to EUR 60 million. Originally, the total value of the program was estimated to be in the range of EUR 30–50 million. The value of the investment in the USA was specified to be close to EUR 50 million. 6 October Ernesto Levy was appointed Senior Vice President, Conveni- ence business area and a member of Suominen’s Corporate Executive Team. Thanks to his background in leading consumer brand companies, Mr. Levy brings complementary com- petencies to Suominen’s leadership team. 26 October Suominen specified its guidance regarding the growth of operating profit. Suominen stated that its operating profit from continuing operations excluding non- recurring items for 2015 would improve markedly from the level of 2014. 27 October Suominen launched the FIBRELLA® Move nonwoven, a state- ment product raising the bar of expectations for materials used in feminine care and other absorbent hygiene applications. 16 November Suominen launched FIBRELLA® Zorb and FIBRELLA® Zorb+ nonwoven products for use in critical surgical care applications in operating rooms and hospitals, bring- ing high value-added ben- efits to both Suominen’s customers and patients. In 2015, Suominen focused on execut- ing its EUR 60 mil- lion growth invest- ment program and introducing new nonwoven products with higher added value in its portfolio. Suominen in brief / How we create value / Year 2015 / Business / Sustainability / Governance / Financial Statements 15 / 127 Suominen Corporation Annual Report 2015
  • 16. Suominen in brief / How we create value / Year 2015 / Business / Sustainability / Governance / Financial Statements Key figures 2015 2014 2013 Net sales, EUR million 444.0 401.8 373.7 Operating profit excl. non-recurring items, EUR million 31.2 26.9 19.4 Profit for the period, EUR million 17.0 10.2 5.7 Earnings per share, EUR 0.06 0.04 0.02 Cash flow from operations, EUR million 27.3 37.1 21.3 Cash flow per share, EUR 0.11 0.15 0.09 2015 2014 2013 Gross capital expenditure, EUR million 23.7 7.1 4.4 Equity ratio, % 43.2 41.2 32.9 Equity per share, EUR 0.50 0.44 0.32 Gearing, % 25.9 34.7 96.2 Return on invested capital (ROI), % 15.9 15.7 12.4 Average personnel 614 591 550 Financial targets Growth Suominen aims to increase its net sales organically at a rate that exceeds the average growth rate of the industry (approximately 3%). Profitability Suominen aims to improve its relative profitability. The target level of the company’s return on investment (ROI) is to be above 12%. Capital structure Suominen aims to have a solid capital structure with a gearing ratio principally between 40% and 80%. Orange lines indicate the target level. Figures refer to continuing operations unless otherwise stated. Suominen in brief / How we create value / Year 2015 / Business / Sustainability / Governance / Financial Statements 10% 8% 6% 4% 2% 0% Net sales, EUR million 500 – 400 – 300 – 200 – 100 – 0 – 13 14 15 Organic growth % 373.7 401.8 444.0 Operating profit excl. non-recurring items, EUR million 35 – 30 – 25 – 20 – 15 – 10 – 5 – 0 – 13 14 15 19.4 26.9 31.2 Equity ratio, % 50 – 40 – 30 – 20 – 10 – 0 – 13 14 15 32.9 41.2 43.2 Equity per share, EUR 0.60 – 0.50 – 0.40 – 0.30 – 0.20 – 0.10 – 0.00 – 13 14 15 0.32 0.44 0.50 Return on invested capital (ROI), % 20 – 15 – 10 – 5 – 0 – 13 14 15 12.4 15.7 15.9 Average personnel 700 – 600 – 500 – 400 – 300 – 200 – 100 – 0 – 13 14 15 550 591 614 Gearing, % 120 – 100 – 80 – 60 – 40 – 20 – 0 – 13 14 15 96.2 34.7 25.9 Profit for the period and earnings per share, EUR million EUR 20 – 15 – 10 – 5 – 0 – 0,06 0,04 0,02 0 13 14 15 Earnings per share, EUR 5.7 10.2 17.0 Gross capital expenditure, EUR million 25 – 20 – 15 – 10 – 5 – 0 – 13 14 15 4.4 7.1 23.7 Cash flow from operations and cash flow per share, EUR million 40 – 35 – 30 – 25 – 20 – 15 – 10 – 5 – 0 – 13 14 15 0.16 0.14 0.12 0.10 0.08 0.06 0.04 0.02 0 Cash flow per share, EUR 21.3 37.1 27.3 16 / 127 Suominen Corporation Annual Report 2015
  • 17. Suominen in brief / How we create value / Year 2015 / Business / Sustainability / Governance / Financial Statements 444.0EUR million Net sales in 2015 Marjo Kuisma Product Manager, Hygiene In nonwovens for wipes, we are the global market leader, while in the medi- cal and hygiene markets, Suominen is a challenger. Business Suominen has two business areas: Convenience and Care. Although the scope of their operations might be different today, they nevertheless share many megatrends, raw materials, technologies and employee capabilities. Moreover, the product features may often be similar – after all, nearly all our products eventually touch human skin. Suominen in brief / How we create value / Year 2015 / Business / Sustainability / Governance / Financial Statements 17 / 127 Suominen Corporation Annual Report 2015
  • 18. Suominen in brief / How we create value / Year 2015 / Business / Sustainability / Governance / Financial Statements The global nonwovens market totals approximately 26 billion euros. It is a huge market but, on the other hand, a very frag- mented one, since nonwovens are used in a vast number of applications. Suominen has chosen three market segments where it operates: 1. Wiping 2. Medical 3. Hygiene Suominen is the ninth-largest of all non- wovens suppliers. In nonwovens for wipes, we are the global market leader, while in the medical and hygiene markets, Suominen is a challenger. These three market segments are not very cyclical in nature, which separates them from, for example, the automotive and build- ing segments of the nonwovens market. Of the large hygiene market, it is worth noting that approximately one fifth of it is within our reach. Suominen concentrates only on producing carefully selected non- woven components with higher added value for hygiene products. Demand for nonwovens for wiping, medi- cal and hygiene applications is driven by the same megatrends, which are discussed in more detail below. The same raw materials, Operating environment technologies and employee capabilities are utilized in all three market segments, and the features required of the products in these segments are often quite similar. Nearly all Suominen’s products eventually touch hu- man skin. Suominen’s main market areas are Europe and North America. We also have a foothold in the growing South American markets. In these areas, demand for nonwovens used in wipes and in hygiene and medical products is increasing at an annual rate of some 3% in Suominen’s selected segments. Exceeding this average growth rate organically is one of the financial targets of our strategy for 2015–2017. Other 27% Upholstery 10% Building/ roofing 7% Filtration 9% Floor coverings 6% Automotive 5% Key competitors • Kimberly-Clark • Berry Plastics (ex-PGI) • Fiberweb • First Quality Nonwovens • Pegas Nonwovens Hygiene 25% Key competitors • Kimberly-Clark • Ahlstrom • Freudenberg • DuPont • First Quality Nonwovens Medical 3% Wiping 8% Suominen in brief / How we create value / Year 2015 / Business / Sustainability / Governance / Financial Statements Global nonwovens market totals approx. EUR 26 billion Others ~50% Half of the market fragmented to smaller players • Kimberly-Clark • Jacom Holm / Sontara • Sandler • Berry Plastics (ex-PGI) Key competitors ~30% Wiping market totals approx. EUR 2.1 billion Suominen ~20% 18 / 127 Suominen Corporation Annual Report 2015
  • 19. Suominen in brief / How we create value / Year 2015 / Business / Sustainability / Governance / Financial Statements In Asia and Africa, annual growth in the nonwovens markets averages 7 to 8%. One might ask, why is Suominen not operating on those market areas as well? The answer is: Because extending our geographical reach to new areas is not in our focus during this strategy period. We know that successful business in those areas requires both a local footprint and focus. Our focus is currently on our existing geographical markets and on organic growth, i.e. growth achieved without acquisitions. Growth in demand for nonwovens depends mostly on consumer demand. Consumer demand is a combination of the general economic situation and consum- ers’ confidence in the development of their personal finances. However, demand for fast- moving consumer goods – that is, end-prod- ucts for which most of Suominen’s products are used – is not very cyclical in nature. Annual forecasted growth rates of demand for nonwovens used in wipes and in hygiene and medical products Suominen’s market areas +2 % +2–6 % +8 % +7 % +7 % Suominen in brief / How we create value / Year 2015 / Business / Sustainability / Governance / Financial Statements 19 / 127 Suominen Corporation Annual Report 2015
  • 20. Suominen in brief / How we create value / Year 2015 / Business / Sustainability / Governance / Financial Statements Suominen has operated on the Brazilian market since the acquisition of the Paulínia plant in Brazil in early 2014. The development of our business there has been favorable all along. Brazil – and South America in general – is still an emerging market for nonwovens. While baby care is the principal end-use category for wiping nonwovens today, other wiping applications as well as medical nonwovens are expected to gain market share in the near future. In general, even though the Brazilian economy was on a downward trajectory through 2015, we did not see this in our local business. This makes Brazil a good example illustrating that the general economic situation doesn’t always tell the whole story about the demand for nonwovens. Once consumers adopt a nonwoven convenience product, a baby wipe for example, they will not easily abandon it. All in all, having a modern produc- tion plant in Brazil serving the entire South American continent is an essential asset for Suominen. Case Favorable development in Brazil Suominen in brief / How we create value / Year 2015 / Business / Sustainability / Governance / Financial Statements 20 / 127 Suominen Corporation Annual Report 2015
  • 21. Suominen in brief / How we create value / Year 2015 / Business / Sustainability / Governance / Financial Statements Megatrends change the world – and the business Megatrends are global changes that pro- foundly transform societies over a long period of time. Many of them are bol- stering our business and consequently boosting our growth forecasts, thanks to their impact on consumer behavior. They include: • Population growth • Growing global middle class • Aging population • Rising healthcare expenditure • Increasing consciousness of health and well-being There is a direct correlation between the rise in the standard of living and, for example, demand for hygiene products. According to various industry sources, an increase in gross domestic product (GDP) to only approxi- mately USD 1,000 per capita could spark demand for disposable sanitary napkins. When the GDP rises to roughly USD 4,000 per capita, demand extends to disposable diapers and, with further increases, to other daily hygiene and convenience products. Demand for nonwovens increases as the standard of living climbs higher GDP per capita USD Feminine care products 1,000 + Disposable diapers 4,000 + Baby wipes 7,000 + Household wipes 14,000 + Incontinence products 10,000 + Suominen in brief / How we create value / Year 2015 / Business / Sustainability / Governance / Financial Statements 21 / 127 Suominen Corporation Annual Report 2015
  • 22. Suominen in brief / How we create value / Year 2015 / Business / Sustainability / Governance / Financial Statements The global middle class, the segment of the population with an annual income of between USD 3,000–20,000, is set to be- come the consumer group with the highest purchasing power in the world in the near future. It has been estimated that by 2020, 2.1 billion people will make up the global middle class. The rise in the standard of living combined with evolving lifestyles will be reflected in the consumer behavior of the prospering mid- dle class. In addition to essential commodi- ties, the consumption of this demographic will center around solutions that make daily routines easier and less time-consuming. The use of disposable household wipes and beauty care wipes are examples of this phenomenon. With the aging of the population and changing healthcare models, new needs are emerging and demand for nonwovens used in, for example, medical applications and incontinence products is increasing. By 2050, people over the age of 60 will make up slightly more than 20% of the global population.* In 2000, this demographic accounted for only 10% of the population. The average age of the population is in- creasing especially in industrialized coun- tries. At the same time, the aging population is staying active for longer, which increases the need for, for example, incontinence products. On the other hand, the need to find cost-effective solutions to combat hos- pital-acquired infections and various pan- demics is also contributing to the increase in demand for nonwovens. Aging, pandemics and changing health- care models are reflected in the rising health- care expenditure. On the other hand, cash flows related to healthcare are increasing as a result of consumers’ interest in enhancing their well-being and health. The overall ex- penditure in healthcare is expected to dou- ble between 2010 and 2020. * UN report: World Population Ageing 1950–2050. 2015 20202010 USD 7.3 billion USD 10.3 billion USD 14.7 billion Global middle class Affluent potentials Elite 2.1 3.40.5 USD 11.5 trillion USD 4.1 trillion USD 13.1 trillion billion people Global expenditure on health Estimated aggregate demand in 2020 People over 65 years 2015 20202010 522 million 599 million 712 million +4.4 USD billion +113 million 28.7USD trillion Suominen in brief / How we create value / Year 2015 / Business / Sustainability / Governance / Financial Statements 22 / 127 Suominen Corporation Annual Report 2015
  • 23. Suominen in brief / How we create value / Year 2015 / Business / Sustainability / Governance / Financial Statements Suominen is the global market leader in non- wovens for wipes. The applications for our nonwovens for wipes are: • Baby care (40% of Suominen’s total net sales in 2015) • Personal care, including flushable products (22%) • Household care (17%) • Workplace applications, e.g., in healthcare and food service (11%). The customers of Convenience include global consumer brands, manufacturers of private labels and regional nonwoven convert- ers. Our customer relationships are typically very long, on average more than ten years. Convenience in 2015 The net sales of the Convenience busi- ness area totaled EUR 411.5 million in 2015 (EUR 369.4 million in 2014). The 11% net sales growth was mostly due to the strengthening of the US dollar compared to the euro. 2015 was a year of growth investments for Suominen as we had initiatives underway at several production plants. The investment will benefit both business areas. • We added capacity in Nakkila by restarting a production line that was shut down in 2012. • We invested in new capabilities in our production lines in Alicante and Paulínia in order to expand our product offering. • The major investment in a new wetlaid production line in Bethune was kicked off in fall of 2015. These investments demonstrate our commitment to continued consumer-driv- en innovation in order to become a Market Driven Product Leader. For more information on the investments, please take a look at the Growth investment program section. We also stepped up our pace in driving proactive key account management, just like Suominen’s strategy suggests. For example, we organized the first ever Suominen Sym- posium for our European customers. This product-oriented event focused on innova- tion and leadership in nonwovens and was only the first in our series of similar initiatives worldwide. In 2015, we launched HYDRASPUN® Dis- persible Plus in the global wipes market, taking flushable nonwovens to a whole new level. This is a good example of Suominen’s market- driven innovation, which, for its part, is crucial as we leverage the growing markets. As the best flushable nonwoven product available to- day, HYDRASPUN® Dispersible Plus responds to worldwide regulatory changes calling for products that will not clog waste-water sys- tems. It is yet another product in our portfolio of flushable substrates that we have been de- veloping as pioneers in the industry. In fact, it was our people who invented flushable nonwovens and introduced them to the wiping world already in the 1990s. Convenience outlook The main market areas for Convenience are North America and Europe, and we also have a foothold in the promising South American market, thanks to the acquisition of the Paulínia plant in Brazil in early 2014. The outlook for the Convenience busi- ness area is auspicious, as demand for non- wovens used in wiping products is projected to increase in all market areas. Convenience business area The Convenience business area offers high value-added nonwovens for a range of wiping applications and for travel and catering products. In 2015, the business area accounted for 93% of Suominen’s total net sales. Net sales in 2015, Convenience411.5 EUR million Suominen in brief / How we create value / Year 2015 / Business / Sustainability / Governance / Financial Statements 23 / 127 Suominen Corporation Annual Report 2015
  • 24. Suominen in brief / How we create value / Year 2015 / Business / Sustainability / Governance / Financial Statements The forecasted growth varies, however, across applications. For instance, the growth rate in nonwovens for baby wipes is around 2% in our main market areas, reflecting the relative maturity of these markets. On the other hand, the forecasted growth rates in nonwovens for flushable wipes, for example, are as high as 9% in the same geographical areas. Growth rates may vary widely also across market areas. This is visibly illustrated in non- wovens for household wipes, as the growth rate for the application is projected to be 2% in Europe, but 7% in North America. The variation in estimated growth rates indicates, among other things, that the market for disposable household wipes is still emerging in Europe. The conditions for growth are favorable, as the appreciation of a healthy lifestyle, well-being and a high level of personal hy- giene, as well as efforts to achieve everyday comfort and convenience are global meg- atrends that are gaining momentum. For the Convenience business area, the name of the game is higher added value for customers. In line with Suominen’s strategy, Conveni- ence will continue to seek growth especially in applications where our product leadership is established and where we have the oppor- tunity to create higher added value. We trust in our capabilities of profound consumer un- derstanding, value-adding key account man- agement and innovation, which, combined with our global manufacturing footprint and supply chain, will help us bring even better products and knowledge to the market. In the near future, our focus will be on boost- ing our product development as well as en- hancing and harmonizing our services and internal processes. North America Europe South America Baby wiping 2% 2% 5% Personal care wiping 6% 6% * Household wiping 7% 2% * Workplace wiping 5% 3% * Flushable wiping 7% 9% * Travel & catering products 5% 5% * * Commercially small amounts supplied Suominen in brief / How we create value / Year 2015 / Business / Sustainability / Governance / Financial Statements The growth rates for the applications of Suominen’s products in the main market areas 24 / 127 Suominen Corporation Annual Report 2015
  • 25. Suominen in brief / How we create value / Year 2015 / Business / Sustainability / Governance / Financial Statements The main end-use applications for Suominen’s nonwovens for hygiene prod- ucts are: • Baby diapers • Feminine hygiene products • Adult incontinence products The main end-use applications for medical products include: • Wound care applications • Orthopedic care applications • Surgical drape components • Drug delivery components In hygiene and medical pro- ducts, nonwovens most often act as components of end products. For example, feminine care products can consist of several layers of different materi- als, with nonwovens being just one of them. Customers of the Care business area in- clude global consumer brands, manufactur- ers of medical and hygiene products and regional nonwoven converters. Care in 2015 The net sales of the Care business area to- taled EUR 32.4 million in 2015 (EUR 32.3 mil- lion in 2014). In 2015, Care’s sales suffered due to a large customer having non-Suominen- related operational issues. This is the main reason behind the flat sales growth in 2015. However, there was more good news than bad news in 2015: Care significantly expanded its global customer base during 2015, launched five new branded products and leveraged our global platform through investments at our plants in Alicante, Spain and Paulínia, Brazil. What is more, market growth in hygiene and medical markets re- mained positive. We are confident that these aspects will give us positive momentum in years to come. Care outlook The main market areas for Care are North America and Europe. The investment made at Suominen’s plant in Brazil in 2015 also enables the business area to supply medi- cal and hygiene products in South America. Solid growth in demand is forecasted to continue at Care’s target markets. In North America, demand for nonwovens for medical products is projected to grow roughly 5%, while in Europe the estimated annual growth rate is around 3%. These growth forecasts are supported by the current global health and well-being megatrends: an increase in the number of pandemics and hospital-acquired infections, as well as the challenges and changing operating models faced by the healthcare sector. The growth prospects for hygiene appli- cations are driven by demographic factors such as population growth, the increase in income in developing countries and the ag- ing of the population in developed coun- tries. In nonwovens for hygiene products, annual market growth in North America and Europe is close to 4%. The goal for the Care business area is to achieve substantial growth. This will be sought by concentrating on two areas: firstly, on expanding our product portfolio and, secondly, on nurturing our customers, be- cause developing business relationships can take time in medical and hygiene markets. Care business area The Care business area provides high-performance nonwovens for use in hygiene and medical products. In 2015, the business area accounted for 7% of Suominen’s net sales. Net sales in 2015, Care 32.4 EUR million Suominen in brief / How we create value / Year 2015 / Business / Sustainability / Governance / Financial Statements 25 / 127 Suominen Corporation Annual Report 2015
  • 26. Suominen in brief / How we create value / Year 2015 / Business / Sustainability / Governance / Financial Statements During 2015, the Care business area launched five new branded products within the FIBRELLA® product family. Three of them are for medical and two for hygiene ap- plications. All these new products support Suominen’s strategic goal of developing and introducing high value- added nonwovens with unique features, which make them particularly interesting for very specific applications. For example, FIBRELLA® Move is a major step forward in fluid acquisition and fluid management and it raises the bar for materials in the construction of feminine care products as well as for other absorbent hygiene applica- tions. It enhances wearer comfort and body fit, and at the same time gives convertors a new nonwoven that easily runs on high-speed converting lines and is highly compatible with other components. FIBRELLA® Perf is another good example, as it repre- sents everything required of a best-in-class wound- care product: it is breathable, skin-friendly, low-linting and very absorbent. These features make it equally applicable to surgical laminates and apparel. There is also another interesting aspect of FIBRELLA® Perf: since it is the first nonwoven product Suominen manufactures for Care business area in Paulínia, Brazil, it opens up the South American medical markets to us. Case Five new branded products launched in 2015 Suominen in brief / How we create value / Year 2015 / Business / Sustainability / Governance / Financial Statements 26 / 127 Suominen Corporation Annual Report 2015
  • 27. Suominen in brief / How we create value / Year 2015 / Business / Sustainability / Governance / Financial Statements In December 2014, Suominen launched a growth investment program to execute its strategy for 2015–2017. At the time of the launch, the value of the program was esti- mated at EUR 30–50 million in total, but was later raised to approximately EUR 60 million due to the promising growth prospects in high value-adding nonwovens applications. Intensifying the growth investment program supports our strategic target of achieving above-industry-average growth in net sales. Growth investment program Plant Estimated value Installed during Bethune approx. EUR 50 million estimated H2/2016 Alicante approx. EUR 4 million 2015Nakkila Paulínia To be confirmed approx. EUR 6 million Suominen’s investments in a nutshell ~50 EUR million Nakkila, Finland Alicante, Spain Paulínia, Brazil Bethune, USA Suominen in brief / How we create value / Year 2015 / Business / Sustainability / Governance / Financial Statements EUR million ~4 27 / 127 Suominen Corporation Annual Report 2015
  • 28. Suominen in brief / How we create value / Year 2015 / Business / Sustainability / Governance / Financial Statements The investment program is helping Suominen to transform its product port- folio; in other words, to increase the share of products with higher added value. This will enhance our ability to supply superior products to our customers and, ultimately, to end users. The program benefits both the Conveni- ence and Care business areas: it will further strengthen Suominen’s leading position in wiping markets and provide us with a clearly improved opportunity to grow the Care busi- ness area. At the end of 2015, the investment pro- gram covered four of Suominen’s produc- tion plants. Clear rationale for choosing the Bethune plant In early 2015, we announced our plans to invest in a new wetlaid production line in order to implement our growth strategy. As the planning advanced, Suominen’s existing plant in Bethune, SC, USA, was chosen as the location of the new production line. We selected the Bethune plant for several strategic and financial reasons: 1. Bethune is located in North America, where demand for high value-adding nonwovens has both developed favorably historically and has attractive growth forecasts. 2. The Bethune plant is ideally located in the Carolinas, the nonwovens hub of North America, and is favorably located from the logistical standpoint of serving our customers and managing our raw materials. 3. The plant already has ongoing operations, highly skilled staff and considerable infrastructure already in place for expansion. The Bethune investment is the most significant project in Suominen’s growth investment program. The new production line is essential for the execution of Suominen’s growth strategy, for it will serve several high value-adding end-use applications. It will be tailor-made, based on our unique nonwovens technology expertise, and will take wetlaid technology to a whole new level in the nonwovens industry. The total value of the Bethune investment, including both equipment and facilities, will be close to EUR 50 million. The investment is significant for Suominen both financially and strategically, but, since it is expected to create at least 25 jobs in Bethune, it is also vital to the local community. The new production line is expected to be installed during the second half of 2016. Three investment projects in Europe and South America In Alicante, Spain, we executed a production line modification. The modification further improves production reliability at the Alicante plant and expands its product offering to non- wovens for household and workplace wipes and also for medical products. The Alicante investment is expected to open up new opportunities for Suominen in the European market. In Nakkila, Finland, a production line that was shut down in 2012 was restarted in March 2015. The improved demand in the European market and Suominen’s strategic objective to grow encouraged us to re-eval- uate the situation. The line restart at Nakkila also had an ef- fect on Suominen’s personnel, with 13 new employees being recruited. In Paulínia, Brazil, we invested in produc- tion technology that makes it easier for us to supply nonwovens for, e.g., medical applica- tions in South America. The upgraded tech- nology additionally enables us to manufac- ture more differentiated nonwovens, which is vital in the growing South American wipes market. Installations of all three investments were completed on schedule in 2015. Read more > How we create value Read more at suominen.fi > Investorsw Suominen in brief / How we create value / Year 2015 / Business / Sustainability / Governance / Financial Statements 28 / 127 Suominen Corporation Annual Report 2015
  • 29. Suominen in brief / How we create value / Year 2015 / Business / Sustainability / Governance / Financial Statements Sustainability Sustainability stems from the business and ultimately supports the business. It cannot be reduced to reporting or charity activities. Instead, it involves, e.g., developing more responsible products, which our customers and end users crave. That is the way we see it. 5 % Reduction in GHG emissions in 2015 Pinja Taittonen Assistant Business Controller Our purpose is to make nonwovens continuously better for people. That is the basis of sustainability at Suominen. Suominen in brief / How we create value / Year 2015 / Business / Sustainability / Governance / Financial Statements 29 / 127 Suominen Corporation Annual Report 2015
  • 30. Suominen in brief / How we create value / Year 2015 / Business / Sustainability / Governance / Financial Statements At Suominen, sustainability means that we take also environmental and social matters into account in our decision-making. Our sustainability strategy – the first of its kind at Suominen – was composed at the end of 2014 to support our business targets. It defines precisely where we should target our efforts and resources. Sustainability was not, however, a new concept for us. Still, this was the first time we clearly laid down its strategic importance and specified which themes are the most crucial to us and our stakeholders. In practice, the sustainability strategy crystallizes our focus areas in promoting sustainable development, as well as our key projects for the strategy period 2015–2017. The focus areas of sustainability for Suominen, determined through a materiality analysis, are: 1. Reaching product leadership 2. Operating sustainably across the company 3. Fostering responsibility through the value chain During 2015, we kicked off three key projects to implement the sustainability strategy: 1. Product Sustainability Review 2. Non-Discrimination and Equal Opportunities Program 3. Supplier Code of Conduct However, as Suominen’s purpose is to make nonwovens continuously better for people, it is worth keeping in mind that sustainability is not present only in specific projects or programs. In fact, almost the op- posite is true: sustainability is a day-to-day matter that is concretized, for example, in the development of more responsible products and in all interaction with our stakeholders. Focus areas of sustainability at Suominen Operating sustainably across the company Reaching the product leadership Fostering responsibility through the value chain Sustainability strategy Suominen in brief / How we create value / Year 2015 / Business / Sustainability / Governance / Financial Statements 30 / 127 Suominen Corporation Annual Report 2015
  • 31. Suominen in brief / How we create value / Year 2015 / Business / Sustainability / Governance / Financial Statements Stepping up the sustainability of nonwovens Having a sustainable product offering is one of the core elements of Suominen’s sustain- ability strategy, since all three focus areas of the strategy are directly or indirectly related to products. This means that Suominen’s products are always safe and fit for the purpose, renewable raw materials are used more often, and we strive to meet all sustain- ability requirements set by our customers and end users. In 2015, we launched a distinct product sustainability project, which was based on a holistic, three-part concept of sustainability. This involved reviewing selected case products in our offering, based on all the dimensions of sustainability. The first phase of the project, examining the sustainability of the case products, was completed at the end of 2015. As a result, we now have a better-than-ever understanding of what our customers, end users and legislators may re- quire from Suominen’s products in terms of sustainability and how our product portfolio currently meets expectations. The next step is to plan and prioritize the identified cross- functional development measures and put the plan into action. Sustainability reporting at Suominen Suominen’s Annual Report 2015 examines sustainability from the social, environmental and financial perspectives of responsibility. We report on our sustainability work every year in the Annual Report. Health, safety and environmental data is collected from Suominen’s production units. In accordance with the materiality principle, locations that do not have production opera- tions are not included in the data. The graphics in the Sustainability sec- tion present historical data as of 2013. All of the graphs reflect Suominen’s continuing business. The Windsor Locks plant in CT, USA, is utilized by both Suominen and Ahlstrom Corporation. Where the Windsor Locks plant is concerned, only the resources used by Suominen are taken into account in the en- vironmental figures. In the safety indicators, personnel who have worked on Suominen’s production lines but are not on Suominen’s payroll are excluded. We continuously develop our sustainabil- ity reporting with the goal of open, meaning- ful and equal stakeholder communication. Suominen in brief / How we create value / Year 2015 / Business / Sustainability / Governance / Financial Statements 31 / 127 Suominen Corporation Annual Report 2015
  • 32. Suominen in brief / How we create value / Year 2015 / Business / Sustainability / Governance / Financial Statements In 2015, the significance of the social di- mension of sustainability rose higher on Suominen’s agenda as a result of the chosen strategic emphasis and, thanks to the mate- riality analysis, the increased understanding of which themes of social responsibility are essential to us. Suominen is committed to offering its employees a fair, safe and healthy work environment. This is the bread and butter of our social responsibility, but, of course, there’s more to it than that. To boost our social responsibility efforts, we launched a Non-Discrimination and Equal Opportuni- ties Program as part of our strategic target to further promote sustainable operations across the company. Developing our employees’ capabilities and promoting motivation and a commit- ment to our common goals is a prerequisite for successful strategy execution. In 2015, Suominen spent EUR 122,902 (EUR 250,607 in 2014) in personnel training. Personnel training costs are investments in the company’s future success Only healthy employees are capable employees. That is why Suominen strives to improve employees’ working ability and well-being. Last year, absences due to illness amounted to 2.2% of total working hours (2.4% in 2014). Social responsibility Suominen in brief / How we create value / Year 2015 / Business / Sustainability / Governance / Financial Statements Eyes on equal pay As part of the strategic Non-Discrimination and Equal Opportunities Program, Suominen conducted internal research on pay equity between men and women in 2015. The research involved all salaried employees globally, i.e. 277 people in total. Employees with hourly wages were excluded from the research because of the comparability issues between employees. *100 = salaried employee average, indexed Salaries at Suominen, indexed* All Female Male 0 100 200 300 400 500 Steer Manage Execute All 347 389 326 156 149 160 60 64 59 97105100 Personnel training costs, EUR 13 14 15 0 50,000 100,000 150,000 200,000 250,000 300,000 106,125 122,902 250,607 Sick absences, % of total working hours 13 14 15 0.0 0.5 1.0 1.5 2.0 3.0 2.2 2.8 2.4 32 / 127 Suominen Corporation Annual Report 2015
  • 33. Suominen in brief / How we create value / Year 2015 / Business / Sustainability / Governance / Financial Statements We are committed to the “equal pay for equal contribution” principle. We gained valuable information on the current situation through the research and, much to our delight, we discovered that the overall situation is fairly good. We found out that the gender pay gap varied somewhat from country to country due to structural reasons. For example, at certain plants wom- en and men are not equally represented in all functions and on all organizational lev- els, which makes valid comparison difficult. Our conclusion was that the root cause of gender pay gaps at Suominen is structural imbalance, rather than men and women be- ing paid unequally for the same work. We will monitor the gender pay gaps and are committed to taking corrective measures whenever necessary. Disappointments in safety rates In 2015, we continued to target zero lost- time accidents but, unfortunately, our safety rates weakened from the record-low level of the previous year. As part of the Non-Discrimination and Equal Opportunities Program, we kicked-off a so- called Blind Hiring Pilot Project in 2015 to see if this could serve as a method of promoting diversity and ensuring equal opportunities when applying for a job at Suominen. Al- though we knew that most of the personal data of the applicants, e.g., full name, gender and ethnicity, is irrelevant to Suominen, we were aware that such data could uncon- sciously bias the recruitment process. This led Suominen to test out blind hiring – that is, leaving the personal data of the applicants hidden in the process as fully as possible. Blind hiring was piloted in late 2015 in the recruitment of an Assistant Business Con- troller in our Helsinki office. First, we de- fined a few pivotal selection criteria that were objective, quantifiable and based on the job description. An external recruitment consultant assessed all applications using Case Sustainability strategy put into practice in blind hiring these criteria and selected the first group of candidates. The hiring manager at Suominen then narrowed the group down to six can- didates based on their applications and ré- sumés, with any personal data hidden. This ensured that the applicants were assessed only on their merits, and their identities were revealed to the hiring manager only in the interview phase. The pilot was successful, and the blind hiring process also brought efficiency, clarity and structure to the hiring process. Suominen aims to have blind hiring as the default ap- proach in recruiting across the company. The principle is meant to be utilized in all new recruitment, including top management. Read more at suominen.fi > What’s new / Hiring manager’s blind date w Suominen in brief / How we create value / Year 2015 / Business / Sustainability / Governance / Financial Statements 33 / 127 Suominen Corporation Annual Report 2015
  • 34. Suominen in brief / How we create value / Year 2015 / Business / Sustainability / Governance / Financial Statements Suominen’s eight plants recorded a total of nine lost-time accidents. That is nine too many. We develop occupational safety accord- ing to the principle of continuous improve- ment. In improving safety, Suominen places particular emphasis on influencing attitudes, behavior, and operating models and on building a culture of work safety. Safety monitoring is part of the daily activities of our production plants. Our Accident Frequency Rate (AFR) in- creased to 8.29 in 2015 (1.83 in 2014). We did not identify one single reason why the rate went up and, therefore, Suominen main- tains its focus on people’s safety behavior, as in most of the cases the root cause of an accident is unsafe behavior. In addition, we are paying more and more attention to be- ing proactive when it comes to preventing accidents. This has led us to, among other things, introduce and monitor some new in- dicators, such as days without professional medical intervention (PMI). Behavior-Based Safety program The Behavior-Based Safety (BBS) program kept rolling for the second year in 2015 and, during the year, the program was imple- mented at all remaining Suominen plants. BBS emphasizes the individual’s responsibil- ity in occupational safety, takes the human factor into account, and focuses on influenc- ing the attitude and motivation of individuals. The Behavior-Based Safety program is our way to achieve a new level in safety. BBS is implemented through Safety Walks. In a Safety Walk, a trained employee walks through the plant premises, identifying both safe and unsafe behaviors and conditions, and then engages in an open conversation with the employees. Safety Walks are based on the notion that safety is everyone’s re- sponsibility. They create a safety partnership between the observer and the observed indi- vidual, focus people’s attention and actions on their own daily safety behavior as well as on the safety behavior of those around them. By the end of 2015, a total of 196 Suomin- en employees had participated in Safety Walk training. A total of 8,611 Safety Walks were performed and altogether 3,508 safe acts and conditions, and 3,524 unsafe be- haviors and conditions were identified dur- ing the walks. Lost time accidents (LTA) Accident severity rate (ASR) 13 14 15 0.0 0.1 0.2 0.3 0.4 0.5 Accident frequency rate (AFR) 13 14 15 0 2 4 6 8 10 0.48 9.00 8.29 1.83 0.37 0.04 13 14 15 0 2 4 6 8 10 99 2 Suominen in brief / How we create value / Year 2015 / Business / Sustainability / Governance / Financial Statements 34 / 127 Suominen Corporation Annual Report 2015
  • 35. Suominen in brief / How we create value / Year 2015 / Business / Sustainability / Governance / Financial Statements Suominen strives to reduce the environ- mental load of its operations and minimize the environmental impacts of its products throughout their life cycle. In 2015, we es- pecially sought to improve our energy and water efficiency. Suominen’s environmental responsibility stems from our purpose “to make nonwovens continuously better for people”. Suominen is committed to considering the environmental impacts of its opera- tions in accordance with the International Chamber of Commerce’s (ICC) principles of sustainable development. We have identified that our environmental impacts are primar- ily related to the raw materials, energy and water used in production, and to the waste generated during the production process. We prioritize the continuous improvement and streamlining of our operations, and foster the principle of reusing and recycling materials. Raw materials as important as ever Since roughly 60–70% of Suominen’s expens- es consist of raw materials, they play a promi- nent role in our business. In 2015, Suominen purchased 138,215 tons of fiber raw mate- rial (138,519 tons in 2014), most of it being viscose, pulp, polypropylene and polyester. 48.2% of Suominen’s raw materials originated from renewable resources. Energy and water efficiency in focus Improving our energy and water efficiency is something we especially focused on dur- ing 2015. In energy efficiency, the target was to achieve a 2% reduction in consumption, while in water efficiency the goal was set at a 12% consumption decrease in 2015. Suominen’s energy consumption, 12.78 GJ/t, decreased from the level of 2014 Environmental responsibility (13.02 GJ/t). The targeted reduction of 2% was nearly met, as we managed to achieve a reduction of 1.9%. Our work towards energy efficiency does not, however, end here, for we will continue our efforts to reduce our energy consumption also in the future. 21.9% of the energy Suominen consumed in 2015 came from renewable sources. Our water efficiency improved in 2015, as consumption fell to 42.08 m³/t from 43.01 m³/t in 2014. However, the decrease fell short of our target. One of the identified rea- sons for this is that the water consumption measurement system at our plant in Windsor Locks, CT, USA, is based on estimates, as the facility is also utilized by Ahlstrom Cor- poration. We are working on improving the measurement accuracy of our specific water consumption at that plant and, hence, will have flow meters installed during 2016 in Energy consumption by source in 2015 (in total 1,683,166 GJ) Natural gas 43% Grid - electrical power 40% Steam 17% Suominen in brief / How we create value / Year 2015 / Business / Sustainability / Governance / Financial Statements Energy consumption and energy efficiency 12,65 12,95 12,85 12,75 13,05 13 14 15 0 400,000 800,000 1,200,000 1,600,000 2,000,000 GJ GJ/ton of product 1,572,013 1,644,398 1,683,166 Raw material usage in 2015 (in total 138,215 tons) Viscose 26% Pulp 20% Polypropylene* 23% Polyester 26% Other 6% *Including sourced PP Spunbond 35 / 127 Suominen Corporation Annual Report 2015
  • 36. Suominen in brief / How we create value / Year 2015 / Business / Sustainability / Governance / Financial Statements 00 30 20 10 40 50 0.012 0.008 0.004 0.016 0.020 0 0.72 0.48 0.24 0.96 1.20 order to show factual consumption and improvements. The Windsor Locks plant alone represents around 70% of Suominen’s water consumption, due to the wetlaid pro- duction technology utilized at the plant. Suominen’s production plants do not discharge a single drop of untreated water. Thanks to our continuous efforts to im- prove our water-treatment systems, all the water used in Suominen’s operations is as clean or cleaner than it was when taken into our process. That’s why we can say that we don’t have any untreated water among our outputs – only treated water. A proud moment in 2015 was when Suominen’s plant in Green Bay, WI, USA, achieved the Gold Award in recognition of full compliance with Federal, State and local waste-water operations and discharge stand- ards and requirements for four years in a row. Choices for lower emissions Last year, Suominen focused efforts on en- hancing the measurement of its greenhouse gas emissions. This was our planned first step in reducing emissions as effectively as possible in the future, because it is only by knowing where emissions stem from that we can take corrective actions. In 2015, Suominen’s total greenhouse gas emissions (direct, scope 1, and indirect, scope 2) fell to 1.07 t/t of CO2 equivalent, down from 1.12 t/t in 2014. Suominen has purposely chosen to pur- chase energy from lower-carbon-emission sources and, as a result, the total indirect CO2 emissions (scope 2) were 10.4% lower in 2015 than the average in the countries where we operate. Waste volumes kept going down After the massive 60% reduction in 2014, we managed to further decrease the amount of landfill waste to 6.96 kg/t (7.03 kg/t in 2014). Suominen in brief / How we create value / Year 2015 / Business / Sustainability / Governance / Financial Statements Water intake by source in 2015 (in total 5,542,291 m3 ) Surface water 72% Municipal water supplies 19% Ground water 9% Water consumption and water efficiency 13 14 15 1,000,000 0 2,000,000 3,000,000 4,000,000 5,000,000 6,000,000 Waste to landfill 13 14 15 0 500 1,000 1,500 2,000 2,500 Greenhouse gas emissions* 13 14 15 0 30,000 60,000 90,000 120,000 150,000 *including direct and indirect emissions tons tons/ton of product tons tons/ton of productm3 m3/ton of product 2278 114,679 888 141,493 916 140,774 4,860,948 5,431,730 5,542,291 36 / 127 Suominen Corporation Annual Report 2015
  • 37. Suominen in brief / How we create value / Year 2015 / Business / Sustainability / Governance / Financial Statements Suominen wants to be a good corporate citizen. We comply with local laws and regu- lations and follow good corporate govern- ance and other generally accepted business practices. We strive to carry out our business activities according to the expectations of society and our stakeholders wherever we operate. Suominen’s turnaround into a company aiming for growth has been successful. We are economically vital and we intend to keep it that way. As the development of our operating profit – from EUR 25.9 million in 2014 to EUR 31.8 million in 2015 – sug- gests, progress has been made in profitabil- ity. Last year, our profitability was impacted by both internal work, such as maintaining cost-consciousness, and by external effects, such as exchange rates. Our internal work on profitability will continue also in the fu- ture. Good profitability and a strong financial position are prerequisites for meeting our fi- nancial obligations to our various stakehold- ers and contributing to increasing general economic well-being. From a financial perspective, the EUR 60 million growth investment program was probably the biggest piece of news from Suominen in 2015. The most significant ini- tiative in the program – the investment in a new state-of-the art production line at the Bethune plant in SC, USA – is also the largest investment in organic growth in Suominen’s history, with an approximate value of EUR 50 million. The growth investment program is significant not only for Suominen, but also for the local communities, since the invest- ments create jobs. In Bethune, we will create at least 25 new jobs by the end of 2016 and in Nakkila, Finland, 13 new employees were recruited in 2015, thanks to the re-opening of a production line. Stakeholder Direct financial impact in 2015 Customers Net sales EUR 444.0 million Suominen’s major customers include, e.g., global consumer brands and private label manufacturers. Employees Wages and salaries EUR 34.8 million Suominen employed over 600 people in Europe and in North and South America in 2015. Partners Materials and services EUR 322.3 million Suominen purchases raw materials and other products and services from local and international business partners. Society Corporate income taxes paid EUR 8.3 million Suominen is a significant employer in the communities where we operate, which makes us a promoter of general well-being. Financiers Net financial expenses EUR 5.3 million Shareholders EUR 0.01 per share fund distribution, approx. EUR 2.5 million in total, from the financial year 2014. On 31 December 2015, Suominen had 4,818 shareholders. Read more > Business section Read more at suominen.fi > Sustainability > Sustainability / Code of Conduct w Economic responsibility Suominen in brief / How we create value / Year 2015 / Business / Sustainability / Governance / Financial Statements 37 / 127 Suominen Corporation Annual Report 2015
  • 38. Suominen in brief / How we create value / Year 2015 / Business / Sustainability / Governance / Financial Statements Corporate Governance The Corporate Governance section of the Annual Report provides a comprehensive review on Suominen’s governance and remuneration. As a new feature in our reporting, a letter from the Chair of the Personnel and Remuneration Committee has been included. 4,818 Number of Suominen shareholders at the end of 2015. The supreme decision-making body of Suominen is the General Meeting of Shareholders. Suominen in brief / How we create value / Year 2015 / Business / Sustainability / Governance / Financial Statements Shareholders and market value in 2015 5000 4750 4250 3750 4500 4000 225 275 250 200 325 300 350 /20151 2 3 4 5 6 7 8 9 10 11 12 Market value, EUR million Number of shareholders In 2015, the Board of Directors convened 18 times. EUR millionShareholders 38 / 127 Suominen Corporation Annual Report 2015
  • 39. Suominen in brief / How we create value / Year 2015 / Business / Sustainability / Governance / Financial StatementsSuominen in brief / How we create value / Year 2015 / Business / Sustainability / Governance / Financial Statements Corporate Governance Statement of Suominen Corporation for 2015 In financial year 2015, Suominen Corpora- tion (hereinafter “Suominen”) complied with the Finnish Corporate Governance Code 2010 (hereinafter “Code”) issued by the Se- curities Market Association. Suominen com- plies with the Finnish Corporate Governance Code 2015, effective as of 1 January 2016, for the first time in the financial year starting 1 January 2016. The Corporate Governance Statement (hereinafter Statement), required by the Code, Chapter 7, Section 7 of the Securities Markets Act, and Section 7 of the Ministry of Finance’s Decree on the Regular Duty of Dis- closure of an Issuer of a Security, is published as a separate statement in connection with the Report by the Board of Directors. The Statement is in accordance with the Code’s Recommendation 54. In addition, selected requirements set in the Corporate Govern- ance Code 2015 have been taken into ac- count in this Statement, even though they will be effective only in financial year 2016. The Statement can also be viewed on Suominen’s website, www.suominen.fi. The Audit Committee and the Board of Directors of Suominen Corporation have reviewed the Statement. The Statement will not be updated during the financial year, but up-to-date information on its various topics is available on Suominen’s website. The Finnish Corporate Governance Code 2010 for listed companies as well as the new Finnish Corporate Governance Code 2015 are available on the website of the Securities Market Association, www.cgfinland.fi. Suominen Group Responsibility for Suominen Group’s business operations is held by the constitutional bod- ies required by the Finnish Companies Act: the General Meeting of Shareholders, which elects the members of the Board of Directors; and the President and CEO, who is appointed by the Board of Directors. The Group’s supreme decision-making body is the General Meeting of Sharehold- ers, where shareholders exercise their deci- sion-making power. The Board of Directors is responsible for the company’s manage- ment and its appropriate organization. As the Group’s parent company, Suominen Corporation is responsible for the Group’s management, accounting and financing, product development and management of intellectual property, human resources, ICT, as well as communications and inves- tor relations. While Suominen has two business areas, Convenience and Care, the company has only one operating segment. Shareholder’s Nomination Board of Suominen Corporation Suominen’s Annual General Meeting of 26 March 2013 resolved to establish a perma- nent Shareholders’ Nomination Board ac- cording to a proposal by the Board of Direc- tors. The task of the Nomination Board is to prepare and present to the Annual General Meeting and, if necessary, to an Extraordi- nary General Meeting, a proposal on the remuneration of the members of the Board of Directors, a proposal on the number of members of the Board of Directors and a proposal on the members of the Board of Di- rectors. In addition, the task of the Nomina- tion Board is to seek candidates as potential board members. The Nomination Board shall consist of four (4) members, three of which shall be appointed by the company’s three largest shareholders, who shall appoint one member each. The Chair of the company’s Board of Directors shall serve as the fourth member. The Nomination Board is established to exist and serve until the General Meeting of the company decides otherwise. The mem- bers shall be nominated annually and their term of office shall end when new mem- bers are nominated to replace them. The members of the Nomination Board shall be independent of the company, and a per- son belonging to the company’s operative management cannot be a member of the Nomination Board. The representatives appointed by the company’s three largest shareholders form Suominen’s permanent Nomination Board. The shareholders entitled to appoint mem- bers to the Nomination Board during finan- cial year 2015 were determined on the basis of the registered holdings in the company’s shareholder register on 1 September 2014, on 7 October 2014 and on 1 September 2015. 39 / 127 Suominen Corporation Annual Report 2015
  • 40. Suominen in brief / How we create value / Year 2015 / Business / Sustainability / Governance / Financial Statements From 1 January to 1 September 2015, the members of the Nomination Board were: - Thomas Ahlström, Managing Director of Antti Ahlström Perilliset Oy and member of the Board of Directors of Ahlström Capital - Timo Ritakallio, President and CEO of Ilmarinen Mutual Pension Insurance Company - Reima Rytsölä, Executive Vice- President, Investments of Varma Mutual Pension Insurance Company - Jorma Eloranta, Chair of Suominen’s Board of Directors. As of 2 September 2015, the members of the Nomination Board were: - Thomas Ahlström, Managing Director of Antti Ahlström Perilliset Oy and member of the Board of Directors of Ahlström Capital - Mikko Mursula, Chief Investment Officer of Ilmarinen Mutual Pension Insurance Company - Reima Rytsölä, Executive Vice- President, Investments of Varma Mutual Pension Insurance Company - Jorma Eloranta, Chair of Suominen’s Board of Directors. In 2015, the Nomination Board convened two times. The attendance rate at the meet- ings was 100%. Board of Directors Composition in 2015 Until the Annual General Meeting of 2015, Mr. Jorma Eloranta (Chair), Mr. Risto Ant- tonen (Deputy Chair), Ms. Suvi Hintsanen, Mr. Hannu Kasurinen and Ms. Jaana Tuominen formed the Board of Directors of Suominen. The Annual General Meeting held on 19 March 2015 re-elected Mr. Risto Anttonen, Mr. Jorma Eloranta, Mr. Hannu Kasurinen and Ms. Jaana Tuominen as members of the Board of Directors. Additionally, Mr. Andreas Ahlström and Ms. Laura Raitio were elected as new members. The term of office of the members of the Board of Directors ends at the close of the Annual General Meeting 2016. Biographical details of the members are as follows: Jorma Eloranta, b. 1951, M. Sc. (Tech.), Dr. Sc. (Tech.) h.c., Chair of the Board Risto Anttonen, b. 1949, B. Sc. (Econ.), Deputy Chair of the Board Andreas Ahlström, b. 1976, M. Sc. (Econ. and Business Adm.), Investment Manager, Ahlström Capital Oy Suvi Hintsanen, b. 1967, M. Sc. (Econ.), Head of Cash Management and Trade Finance, Pohjola Bank plc (member of the Board of Directors until 19 March 2015) Hannu Kasurinen, b. 1963, M. Sc. (Econ.), Senior Vice President, Head of Carton Board Business Unit, Stora Enso Corporation Laura Raitio, b. 1962, Licentiate of Tech- nology (Forest Products), CEO, Diacor terveyspalvelut Oy Jaana Tuominen, b. 1960, M. Sc. (Chem. Eng.), CEO, Paulig Group Tasks and responsibilities The Board of Directors is responsible for the administration and appropriate organization of Suominen’s operations. The Board is re- sponsible for making decisions on matters that are likely to have a major impact on the company’s operations. The Board convenes according to an annual meeting plan. The main duties of the Board include: • deciding on the company’s corporate structure and organization • nominating and dismissing the President & CEO • deciding on the salaries, bonuses, and other benefits paid to the President & CEO and his/her immediate subordinates • deciding on the company’s salary and incentive scheme • considering and approving annual accounts, reports by the Board of Directors, financial statement releases, and interim reports • monitoring and supervising the Group’s performance and ensuring the effectiveness of its management • approving the company’s operating policies (financing policy, insurance and risk management policy, and principles for corporate governance) • deciding on the acquisition and assignment of fixed assets • deciding on strategically and financially significant investments, acquisitions, divestments, or other arrangements • deciding on financial borrowings and pledging securities • considering and approving strategies and action plans • establishing a dividend policy and confirming the company’s targets. Suominen in brief / How we create value / Year 2015 / Business / Sustainability / Governance / Financial Statements 40 / 127 Suominen Corporation Annual Report 2015
  • 41. Suominen in brief / How we create value / Year 2015 / Business / Sustainability / Governance / Financial Statements The Board of Directors is elected by the Gen- eral Meeting of Shareholders. It consists of at least three and at most seven members. Meeting practice The Board of Directors convenes under the direction of the Chair or, if the Chair is un- able to attend, the Deputy Chair. Principally, the matters are presented by the President & CEO. In 2015, the Board of Directors convened 18 times, of which 9 times per capsulam. The average attendance rate at meetings was 99%. The participation of each individual member is presented in the table below. of the company, and at least one member must be independent of the company’s sig- nificant shareholders. From 1 January 2015 until 19 March 2015, until the constitutive meeting of the Board, the Audit Committee consisted of Hannu Kasurinen as Chair and Suvi Hintsanen and Jaana Tuominen as members. In its constitu- tive meeting on 19 March 2015, the Board of Directors elected Hannu Kasurinen as Chair and Andreas Ahlström and Laura Raitio as members of the Audit Committee. In 2015, the Audit Committee convened four times. The attendance rate at the meet- ings was 100%. The participation of each in- dividual member is presented in the table below.Name Participation Jorma Eloranta Chair 18/18 Risto Anttonen Deputy Chair 18/18 Andreas Ahlström Member as of 19 March 2015 14/14 Suvi Hintsanen Member until 19 March 2015 4/4 Hannu Kasurinen Member 18/18 Laura Raitio Member as of 19 March 2015 13/14 Jaana Tuominen Member 18/18 Name Participation Hannu Kasurinen Chair 4/4 Andreas Ahlström Member as of 19 March 2015 3/3 Suvi Hintsanen Member until 19 March 2015 1/1 Laura Raitio Member as of 19 March 2015 3/3 Jaana Tuominen Member until 19 March 2015 1/1 Evaluation of independence The Board of Directors has evaluated the in- dependence of its members. All members are independent of the company and its significant shareholders, with the exception of Andreas Ahlström, who is dependent on a significant shareholder. In financial year 2015, Andreas Ahlström acted as Investment Manager at Ahlström Capital Oy. The larg- est shareholder of Suominen, AC Invest Two B.V., is a group company of Ahlström Capital. Self-evaluation The Board of Directors reviews its opera- tions and procedures through an annual self-assessment.  Board committees Audit Committee The main tasks of the Audit Committee re- late to ensuring the company’s good gov- ernance, accounting and financial reporting, internal control systems and monitoring of third-party auditing. The Audit Committee prepares for the Board matters that fall under its areas of responsibilities, but it does not have independent decision-making pow- ers unless the Board resolves otherwise on certain matters. The Chair and members of the commit- tee are elected annually at the Board’s con- stitutive meeting. At least three members are elected to the committee. The members of the Audit Committee must be independent Personnel and Remuneration Committee The Personnel and Remuneration Com- mittee will prepare the remuneration and appointment matters concerning the com- pany’s President & CEO and other members of senior management, as well as principles and procedures related to the remuneration of the company’s employees. The Commit- tee will prepare for the Board matters that fall under its areas of responsibilities, but it does not have independent decision-making powers unless the Board resolves otherwise on individual matters. The Chair and members of the commit- tee will be elected annually at the Board’s constitutive meeting. Until 19 March 2015, the minimum number of committee mem- bers was two, which deviated from recom- mendation 22 of the Code 2010, which states that Board committees must have at least three members. Suominen’s Board of Directors states that, taking into considera- tion the number of members of the Board and the scope and nature of the company’s business operations, the Personnel and Remuneration Committee was able to ef- fectively handle the matters assigned to it even with only two members. As of 19 March 2015, the Committee has consisted of three members. The majority of the members of the Personnel and Remuneration Commit- Suominen in brief / How we create value / Year 2015 / Business / Sustainability / Governance / Financial Statements 41 / 127 Suominen Corporation Annual Report 2015
  • 42. Suominen in brief / How we create value / Year 2015 / Business / Sustainability / Governance / Financial Statements tee must be independent of the company. The President & CEO or a member of the company’s or Group’s management may not be a member of the Personnel and Remu- neration Committee. From 1 January 2015 until 19 March 2015, until the constitutive meeting of the Board of Directors, the members of the Personnel and Remuneration Committee were Jorma Eloranta (Chair) and Risto Anttonen. In its constitutive meeting held on 19 March 2015, the Board of Directors elected Jorma Elor- anta as the Chair of the Personnel and Re- muneration Committee and Risto Anttonen and Jaana Tuominen as members. In 2015, the Personnel and Remunera- tion Committee convened three times. The attendance rate at the meetings was 100%. The participation of each individual member is presented in the table below. Technology, the CIO, the Vice President of Marketing & Product Management, the Vice President of Sourcing, and the Vice President of Corporate Communications & Investor Relations. Insider management From 1 January to 30 November 2015 Suominen Group observed the guidelines for insiders issued by the NASDAQ OMX Helsinki Ltd on 1 July 2013, and as of 1 December 2015, the new Nasdaq Helsinki Guidelines for Insiders. The members of the Board of Directors, the President & CEO and the Principal Audi- tor are included in the company’s public in- sider register. The public register is available at Suominen’s website via the online service provided by Euroclear Finland Ltd. The company also maintains a com- pany-specific register of non-public insid- ers. Permanent insiders listed here include the members of the Corporate Executive Team and certain other employees of the company, who by virtue of their position or responsibilities regularly receive insider information. A project-specific insider reg- ister is maintained to cover persons that are involved with the planning and preparation of significant projects dealing with insider information. President & CEO and the Group management The President & CEO of Suominen Corpora- tion is appointed by the Board of Directors. The President & CEO is responsible for day- to-day operations in accordance with the Companies Act and guidelines and instruc- tions provided by the Board of Directors. The President & CEO is responsible for ensuring that the company’s accounting practices comply with the law and that its assets are reliably managed. The President & CEO acts as the Chair of the Corporate Execu- tive Team and as the immediate supervisor of the Team’s members. Ms. Nina Kopola, b. 1960, M.Sc. (Chemi- cal Eng.), Technology Licentiate acts as the President & CEO of Suominen Corporation. The President & CEO is supported by the Corporate Executive Team and Corporate Leadership Team. In 2015, the Corporate Ex- ecutive Team comprised, in addition to the President & CEO who acts as its Chair, the Senior Vice Presidents of the business areas, the Senior Vice Presidents of Operations, the Senior Vice President, CFO, and the Senior Vice President of Human Resources. The Corporate Leadership Team compris- es, in addition to the members of the Cor- porate Executive Team, the Vice President of R&D, the Vice President of Investments & The Senior Vice President, CFO, is respon- sible for Suominen’s insider management. Insiders are not allowed to trade in se- curities issued by the company for a period beginning at the end of a financial period or a financial year and ending with the pub- lication of the interim report or financial statement release for the period or financial year in question (closed window). In case an insider aims to trade with the company’s shares, a trading scheme concerning the ac- quisition or transfer of the company’s shares must be employed. Trading scheme must be submitted to the person responsible for insider issues for his/her approval and for storage prior to initiating trading with the company’s shares. Auditing Until 19 March 2015, PricewaterhouseCoop- ers Oy, Authorised Public Accountants, act- ed as auditor of the company, with Heikki Lassila, Authorised Public Accountant, as the principal auditor. The Annual General Meeting held on 19 March 2015 elected Ernst & Young Oy, Authorised Public Accountants, as auditor of the company, with Kristina Sandin, Au- thorised Public Accountant, as the principal auditor. Name Participation Jorma Eloranta Chair 3/3 Risto Anttonen Member 3/3 Jaana Tuominen Member as of 19 March 2015 2/2 Suominen in brief / How we create value / Year 2015 / Business / Sustainability / Governance / Financial Statements 42 / 127 Suominen Corporation Annual Report 2015