Zoom Video Communications Inc.pdf
•
0 likes•6 views

ZM Stock Forecast & Price: Based on the Zoom Video Communications Inc stock forecasts from 25 analysts, the average analyst target price for Zoom Video Communications Inc is USD 132.44 over the next 12 months. Zoom Video Communications Inc’s average analyst rating is Buy . Stock Target Advisor’s own stock analysis of Zoom Video Communications Inc is Slightly Bullish , which is based on 8 positive signals and 4 negative signals. At the last closing, Zoom Video Communications Inc’s stock price was USD 81.32. Zoom Video Communications Inc’s stock price has changed by -25.52% over the past week, -23.68% over the past month and -76.17% over the last year.

Recommended
Recommended
More Related Content
Similar to Zoom Video Communications Inc.pdf
Similar to Zoom Video Communications Inc.pdf (20)
More from Stocktargetadvisor.com
More from Stocktargetadvisor.com (20)
Recently uploaded
Recently uploaded (20)
Zoom Video Communications Inc.pdf
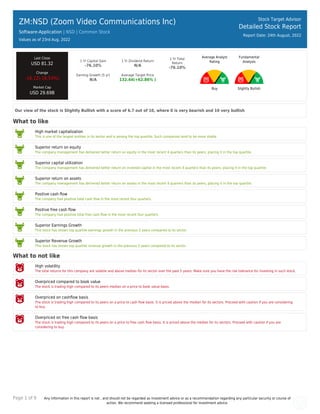
- 1. Page 1 of 9 Any information in this report is not , and should not be regarded as investment advice or as a recommendation regarding any particular security or course of action. We recommend seeking a licensed professional for investment advice. ZM:NSD (Zoom Video Communications Inc) Software-Application | NSD | Common Stock Values as of 23rd Aug, 2022 Stock Target Advisor Detailed Stock Report Report Date: 24th August, 2022 Last Close USD 81.32 Change -16.12(-16.54%) Market Cap USD 29.69B 1 Yr Capital Gain -76.10% 1 Yr Dividend Return N/A 1 Yr Total Return -76.10% Earning Growth (5 yr) N/A Average Target Price 132.44(+62.86% ) Average Analyst Rating Buy Fundamental Analysis Slightly Bullish Our view of the stock is Slightly Bullish with a score of 6.7 out of 10, where 0 is very bearish and 10 very bullish What to like High market capitalization This is one of the largest entities in its sector and is among the top quartile. Such companies tend to be more stable. Superior return on equity The company management has delivered better return on equity in the most recent 4 quarters than its peers, placing it in the top quartile. Superior capital utilization The company management has delivered better return on invested capital in the most recent 4 quarters than its peers, placing it in the top quartile. Superior return on assets The company management has delivered better return on assets in the most recent 4 quarters than its peers, placing it in the top quartile. Positive cash flow The company had positive total cash flow in the most recent four quarters. Positive free cash flow The company had positive total free cash flow in the most recent four quarters. Superior Earnings Growth This stock has shown top quartile earnings growth in the previous 5 years compared to its sector. Superior Revenue Growth This stock has shown top quartile revenue growth in the previous 5 years compared to its sector. What to not like High volatility The total returns for this company are volatile and above median for its sector over the past 5 years. Make sure you have the risk tolerance for investing in such stock. Overpriced compared to book value The stock is trading high compared to its peers median on a price to book value basis. Overpriced on cashflow basis The stock is trading high compared to its peers on a price to cash flow basis. It is priced above the median for its sectors. Proceed with caution if you are considering to buy. Overpriced on free cash flow basis The stock is trading high compared to its peers on a price to free cash flow basis. It is priced above the median for its sectors. Proceed with caution if you are considering to buy.
- 2. Page 2 of 9 Any information in this report is not , and should not be regarded as investment advice or as a recommendation regarding any particular security or course of action. We recommend seeking a licensed professional for investment advice. ZM:NSD (Zoom Video Communications Inc) Software-Application | | Common Stock Stock Target Advisor Detailed Stock Report Report Date: 24th August, 2022 Adjusted Closing Share Volume Relative Returns Relative Performance (Total Returns) Security Capital Gain Dividend Return Total Return ZM Zoom Video Communications Inc -76.2% 0 -76.2% QQQ Invesco QQQ Trust -15.8% +0.4% -15.5% Company Overview Zoom Video Communications, Inc. provides unified communications platform in the Americas, the Asia Pacific, Europe, the Middle East, and Africa. The company offers Zoom Meetings that offers HD video, voice, chat, and content sharing through mobile devices, desktops, laptops, telephones, and conference room systems; Zoom Phone, an enterprise cloud phone system; and Zoom Chat enables users to share messages, images, audio files, and content in desktop, laptop, tablet, and mobile devices. It also provides Zoom Rooms, a software-based conference room system; Zoom Hardware-as-a-Service allows users to access video communication technology from third party equipment; Zoom Conference Room Connector, a gateway for SIP/H.323 endpoints to join Zoom meetings; Zoom Events, which enables users to manage and host internal and external virtual events; OnZoom, a prosumer-focused virtual event platform and marketplace for Zoom users to create, host, and monetize online events; and Zoom Webinars to provide video presentations to large audiences from many devices. In addition, the company offers Zoom Developer Platform that enables developers, platform integrators, service providers, and customers to build apps and integrations using Zoom's video-based communications solutions, as well as integrate Zoom's technology into their products and services; Zoom App Marketplace, which helps developers to publish their apps, as well as third-party integrations of Zoom; and Zoom Contact Center, an omnichannel contact center solution. It serves individuals; and education, entertainment/media, enterprise infrastructure, finance, government, healthcare, manufacturing, non-profit/not for profit and social impact, retail/consumer products, and software/Internet industries. The company was formerly known as Zoom Communications, Inc. and changed its name to Zoom Video Communications, Inc. in May 2012. The company was incorporated in 2011 and is headquartered in San Jose, California.
- 3. Page 3 of 9 Any information in this report is not , and should not be regarded as investment advice or as a recommendation regarding any particular security or course of action. We recommend seeking a licensed professional for investment advice. Company Website https://www.zoom.us Address 55 Almaden Boulevard, San Jose, CA, United States, 95113 Fiscal Year End January Employees 6787 Technical Indicators Value Value Beta -0.61 52 Week High 357.93 Short Ratio 2.92 52 Week Low 79.03 Shorted Shares 11,554,988 200 Day Moving Average 138.11 Shorted Shares Previous Month 10,318,117 50 Day Moving Average 109.25 Shares Held By Insiders 1,237.70% Short Percentage 3.00% Shares Held by Institutions 62.58 Dividend Yield N/A
- 4. Page 4 of 9 Any information in this report is not , and should not be regarded as investment advice or as a recommendation regarding any particular security or course of action. We recommend seeking a licensed professional for investment advice. ZM:NSD (Zoom Video Communications Inc) Software-Application | | Common Stock Stock Target Advisor Detailed Stock Report Report Date: 24th August, 2022 Market Performance Market Performance vs. Industry / Classification (Software-Application) Market Performance vs. Exchange (Nasdaq Global Select) Value Sector Median Percentile Rank Grade Market Median Percentile Rank Grade YTD Capital Gain -55.78% -33.9% 27% -18.4% 21% Dividend Return N/A 0.9% N/A 1.4% N/A Total Return -55.78% -33.9% 27% -17.2% 21% Trailing 12 Months Capital Gain -76.10% -45.5% 20% -21.2% 15% Dividend Return N/A 1.5% N/A 2.4% N/A Total Return -76.10% -45.5% 20% -18.9% 15% Trailing 5 Years Capital Gain N/A 24.3% N/A 7.0% N/A Dividend Return N/A 10.4% N/A 10.9% N/A Total Return N/A 28.0% N/A 17.4% N/A Average Annual (5 Year Horizon) Capital Gain 83.80% 16.7% 91% 0.4% 94% Dividend Return N/A 1.0% N/A 1.8% N/A Total Return 83.80% 17.1% 91% 1.6% 94% Risk Return Profile Volatility (Standard Deviation) 182.78% 42.6% 11% 32.8% 6% Risk Adjusted Return 45.85% N/A 62% 14.3% 78% Market Capitalization 29.69B 0.48B 94% 0.35B 97%
- 5. Page 5 of 9 Any information in this report is not , and should not be regarded as investment advice or as a recommendation regarding any particular security or course of action. We recommend seeking a licensed professional for investment advice. Key Financial Ratios Ratios vs. Industry / Classification (Computer Hardware) Ratios vs. Exchange (Nasdaq Global Select) Value Sector Median Percentile Rank Grade Market Median Percentile Rank Grade Market Value peratio 24.8 39.5 59% 16.8 35% pbratio 5.1 3.5 38% 1.8 19% pcfratio 18.5 10.9 43% -0.1 17% pfcfratio 23.1 1.7 28% 0.5 12% Management Effectiveness retequity 24.89% -11.8% 90% -0.9% 89% retinvcap 27.75% -3.8% 95% -0.5% 92% retass 9.85% -2.4% 96% -0.1% 92% debtequityratio N/A 48.4% N/A 32.6% N/A Technical Ratios yield N/A 1.4% N/A 2.7% N/A sratio 2.92 4.05 64% 3.66 57% spercent 4.60% 3.3% 42% 2.8% 35% beta -0.61 1.15 100% 1.07 99%
- 6. Page 6 of 9 Any information in this report is not , and should not be regarded as investment advice or as a recommendation regarding any particular security or course of action. We recommend seeking a licensed professional for investment advice. ZM:NSD (Zoom Video Communications Inc) Software-Application | | Common Stock Stock Target Advisor Detailed Stock Report Report Date: 24th August, 2022 Recent Analyst Ratings Price Action Rating Action Analyst Rating Price date Maintains Deutsche Bank Capital Hold USD 105 » USD 95 2022-08-23 Maintains Mizuho Securities Buy USD 190 » USD 120 2022-08-23 Maintains Benchmark Buy USD 128 » USD 118 2022-08-23 Maintains Robert W Baird Outperform USD 140 » USD 125 2022-08-23 Maintains Citigroup Sell USD 91 » USD 76 2022-08-23 Maintains Stifel Nicolaus Research Hold USD 120 » USD 90 2022-08-23 Maintains Wells Fargo Equal-Weight USD 105 » USD 95 2022-08-23 Maintains Goldman Sachs Neutral USD 142 » USD 122 2022-08-23 Targtet Down STA Research Buy USD 100 2022-08-23 Target Down Evercore ISI USD 95 2022-08-23 Maintains MKM Partners Buy USD 135 » USD 125 2022-08-23 Maintains RBC Royalbank Outperform USD 150 » USD 130 2022-08-23 Downgrades BTIG Research Neutral 2022-08-23 Target Down UBS USD 92 2022-08-23 Maintains Piper Sandler Neutral USD 115 » USD 91 2022-08-23 Maintains Morgan Stanley Overweight USD 140 » USD 130 2022-08-23 Initiated by MKM Partners Buy USD 135 2022-08-04 Initiates Coverage On Sanford Bernstein Market Perform USD 122 2022-07-20 Maintains STA Research Hold USD 120 2022-07-13 Target Raised by Piper Sandler USD 96 » USD 115 2022-07-13 Upgraded by Daiwa Securities Underperform » Outperform USD 121 2022-05-30 Target Down Guggenheim Securities USD 130 2022-05-25 Adjusts STA Research Hold USD 120 2022-05-24 Maintains Benchmark Buy USD 124 » USD 128 2022-05-24 Maintains Stifel Nicolaus Research Hold USD 150 » USD 120 2022-05-24
- 7. Page 7 of 9 Any information in this report is not , and should not be regarded as investment advice or as a recommendation regarding any particular security or course of action. We recommend seeking a licensed professional for investment advice. ZM:NSD (Zoom Video Communications Inc) Software-Application | | Common Stock Stock Target Advisor Detailed Stock Report Report Date: 24th August, 2022 Annual Financial (USD)
- 8. Page 8 of 9 Any information in this report is not , and should not be regarded as investment advice or as a recommendation regarding any particular security or course of action. We recommend seeking a licensed professional for investment advice. ZM:NSD (Zoom Video Communications Inc) Software-Application | | Common Stock Stock Target Advisor Detailed Stock Report Report Date: 24th August, 2022 Quarterly Financial (USD)
- 9. Page 9 of 9 Any information in this report is not , and should not be regarded as investment advice or as a recommendation regarding any particular security or course of action. We recommend seeking a licensed professional for investment advice. ZM:NSD (Zoom Video Communications Inc) Software-Application | | Common Stock Stock Target Advisor Detailed Stock Report Report Date: 24th August, 2022 Largest Industry Peers for Software-Application Symbol Company Name Price(Change) Market Cap INTU Intuit Inc +3.44 (+0.8%) USD 130.87B TEAM Atlassian Corp Plc -0.19 (-0.1%) USD 68.79B CDNS Cadence Design Systems Inc -1.65 (-0.9%) USD 50.64B ADSK Autodesk Inc -2.77 (-1.3%) USD 47.02B WDAY Workday Inc -3.19 (-2.0%) USD 40.86B DDOG Datadog Inc +1.14 (+1.1%) USD 33.46B TTD Trade Desk Inc -0.55 (-0.9%) USD 31.38B ANSS ANSYS Inc -3.40 (-1.3%) USD 22.58B COIN Coinbase Global Inc -0.29 (-0.4%) USD 19.40B NUAN Nuance Communications Inc N/A USD 17.88B ETFs Containing ZM Symbol Company Name Weight Mer Price(Change) Market Cap QBTL:CA AGFiQ US Market Neutral Anti-B.. 0.17 % 0.00 % -0.17 (-4.7%) USD 0.24B ARKK ARK Innovation ETF 0.00 % 0.75 % -0.24 (-4.7%) USD 9.34B ARKW ARK Next Generation Internet E.. 0.00 % 0.75 % -0.83 (-4.7%) USD 1.46B IPO Renaissance IPO ETF 0.00 % 0.60 % +0.01 (+-4.7%) USD 0.20B MUS:CA Mackenzie Maximum Diversificat.. 0.00 % 0.58 % -0.68 (-4.7%) USD 0.16B MWD:CA Mackenzie Maximum Diversificat.. 0.00 % 0.60 % -0.32 (-4.7%) USD 0.38B QGRO American Century U.S. Quality .. 0.00 % 0.00 % +0.06 (+-4.7%) USD 0.22B FPXU:PA First Trust US Equity Opportun.. 0.00 % 0.00 % +0.05 (+-4.7%) USD 9.98M 5XYE:F Hanetf Icav - Hanetf Cloud Tec.. 0.00 % 0.00 % -0.06 (-4.7%) USD 0.02B DATA:CA Evolve Cloud Computing Index F.. 0.00 % 0.00 % -0.02 (-4.7%) USD 0.03B The Stock Target Advisor platform run millions of calculations every day on over 30,000 Canadian and American stocks, comparing and ranking their financial and market performance against their sectors and exchange. We represent the percentile ranking using the following grading system. Letter Grade Percentage Letter Grade Percentage Letter Grade Percentage A+ 97%-100% A 93%-96% A- 90%-92% B+ 97%-89% B 83%-86% B- 80%-82% C+ 77%-79% C 73%-76% C- 70%-72% D+ 67%-69% D 63%-66% D- 60%-62% F 0%-59%