1. Effect of Container/Closure, Solute and Processing Parameters
on Relative Rates of Sublimation During Primary Drying
Carrie A. Dasconio, Amy M. Espieg, Lyophilization Technology, Inc., Ivyland, PA
Heat transfer coupled with resistance to water vapor transport
is well recognized as a rate limiting factor in achievable rates of
sublimation during Primary Drying. This study quantifies the
influence of the surface area of the container, closure design,
and/or the presence of solutes in the formulation on the vapor
pathway during the sublimation of ice under both aggressive
and conservative conditions. Included in the study design are
commonly used containers that provide different surface areas
relative to the 20mm finish end of the container. Also included
were two popular stopper designs as well as a new closure system
that allows for stoppering and sealing the container within the
lyophilizer. The rates of sublimation of ice, along with rates of
sublimation of two model formulations, under both aggressive
and conservative conditions, were measured for comparison. The
results were evaluated to assess the relative impact of surface area
of the container, closure design, solute and processing parameters.
EXPERIMENTAL DESIGN
Effect of vial size:
• Type I 20mm finish Tubing glass vial size – surface area for
sublimation
▪ 10cc 35.78 cm2
▪ 20cc 58.72 cm2
▪ 50cc 107.47 cm2
Effect of closure type:
• Grey halobutyl 20mm stoppers – total open vent area
▪ Single Vent 1.81 cm2
▪ Double Vent 2.50 cm2
• Stoppers with and without the addition of a three vent
Lyoseal 20™
▪ Lyoseal 20™ 5.04 cm2
Effect of solute:
• No solutes – Purified Water
• Model Formulations – Type of solutes
▪ 5% w/v Mannitol – crystalline
▪ 5% w/v Sucrose – amorphous
Effect of process:
• Aggressive conditions
▪ ΔTsp
= Ts
- Tp
• Ts
(Temperature of the Shelf)
• Tp
(Temperature of the Product)
▪ ΔPoc
= Po
- Pc
• Po
(Vapor Pressure of Ice at the Temperature of the
Frozen Product)
• Pc
(Pressure of the Chamber)
• Conservative conditions
▪ ΔTsp
= Ts
- Tp
• Ts
(Temperature of the Shelf)
• Tp
(Temperature of the Product)
▪ ΔPoc
= Po
- Pc
• Po
(Vapor Pressure of Ice at the Temperature of the
Frozen Product)
• Pc
(Pressure of the Chamber)
Measurement of effect:
• Weight loss
▪ Weight of vial and volume before
▪ Weight of vial and volume after
▪ Weight before - weight after = weight loss
• Rate calculation
▪ Weight loss / duration of drying = rate of sublimation
• ΔTsp
• ΔPoc
Evaluation of results:
• Variation within vial size
▪ Minimum, maximum and average rate
▪ ΔTsp
▪ ΔPoc
• Differences between stoppers
▪ Minimum, maximum and average rate
▪ Single Vent vs Two Vent
▪ Single Vent vs Single Vent with Lyoseal 20™
▪ Double Vent vs Double Vent with Lyoseal 20™
• Effect of formulation
▪ Minimum, maximum and average rate
▪ No solute vs crystalline vs sucrose
• Variation of parameters
▪ Minimum, maximum and average rate
▪ ΔTsp
▪ ΔPoc
P R O C E D U R E
• Bulk solution was formulated in a controlled laboratory
environment.
• The batch was then processed in a Class 100 clean room where
the solution was filtered through a 0.2 micron sterilizing filter.
• Vials were prepared by washing with Purified Water, USP in
a Class 100 clean room.
• For each sublot, 25 vials were marked and weighed.
• Half of the marked vials were placed along the perimeter and
half were placed towards the center of a full tray of vials.
• All vials were filled in a Class 100 clean room at different
volumes to maintain a constant fill height.
▪ 4.00ml for a 10cc
▪ 6.50ml for a 20cc
▪ 11.20ml for a 50cc
• West 20mm stoppers were partially inserted into the vials.
• Half of the vials were fitted with a Lyoseal 20™.
• Thermocouples were placed in the bottom center of at
least two vials of each vial size.
• Bottomless trays containing the product were placed on
the shelves of a Hull Model 24FS40 pilot size lyophilizer and
the tray bottoms were removed.
• The chamber was evacuated to between 9 and 12 psia
to ensure proper vacuum function.
• The lyophilization cycle was completed using the parameters
outlined by the following cycle graphs.
• The cycles were terminated at set time intervals during
primary drying.
The intent was to determine the magnitude of the relative influence
of the vial size, closure design and the presence of solutes in
the formulation with aggressive and conservative processing
conditions. Vial size dictates the nominal surface area of the
sublimation front. Design and geometry of the closure provides
the pathway for the water vapor out of the vial. Characteristics
of the solute influence the vapor pathway through the dried
solute layer above the ice-vapor interface during the sublimation
of ice. The magnitude of such differences may vary based on the
processing conditions and resulting rate of water vapor evolution.
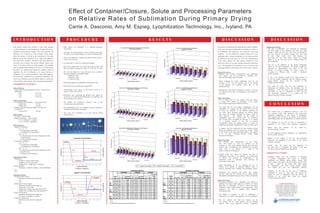
Effect of the vial size:
• Different heat transfer characteristics and sublimation
front surface areas were provided by including 10cc,
20cc and 50cc tubing vials in the study.
• When evaluating the results, sublimation rates per vial
increases as the vial size increases due to an increase
in the diameter and resulting surface area of the
sublimation front.
• Differences in heat transfer characteristics relative to vial size
are reflected in the rates of sublimation in the absence of
any solute.
Effect of the closure:
• Use of single and two vent stoppers with and without
a Lyoseal 20™ allowed an assessment of the impact
due to design and geometry of different closures.
• The single and two vent stopper configuration, and the
combination of a stopper and the Lyoseal 20™ was used
to assess any influence of the different pathways for
the water vapor traveling through the closure. When
used alone, the pathway through the stopper would be
least restricted. The influence of the stopper in
combination with the Lyoseal 20™ was unknown.
The Lyoseal 20™, developed by Biocorp is of interest
as a possible solution to the risk of particle
contamination during the capping process: It allows for
stoppering and capping simultaneously within the freeze dryer.
• A Student t-test was performed for each container closure
design and condition across the various sets of data. Based
on the results of this basic statistical analysis, there appears
to be no clear correlation between closure design
and rates of sublimation.
Effect of the solute:
• The presence and characteristics of the solutes
have been shown to have an influence on the
resistance to water vapor transport through the dried layer.
Relative rates of sublimation were measured for constructs
where there is an absence of a solute, or the
solute is crystalline or amorphous.
• Purified Water was chosen to measure the rates of
sublimation when there is no influence of a dried layer.
In addition, any potential for condensation at the
sublimation front is minimized when allowing the
water vapor to leave freely.
• Model formulations of 5% w/v Mannitol and 5% w/v
Sucrose were selected to represent different types of
behavior associated with crystalline and amorphous solutes.
• Calculated ΔTsp
between the shelf and product
decreases while the ΔPoc
between the ice vapor pressure
and chamber atmosphere increases when a solute is introduced.
Effect of the process:
• Processing parameters were established and utilized to
challenge the system under aggressive conditions to induce
high rates of sublimation, as well as more conservative
conditions to span a greater range of cycle parameters. These
parameters were used to magnify subtle differences
in sublimation rates.
• The impact of container on rates of sublimation is
magnified as you utilize more aggressive process parameters.
• The ΔTsp
between the shelf and product and the
ΔPoc
between the ice vapor pressure and the chamber
increase with more aggressive process parameters.
• The overall rates of sublimation increase as the vial
size increases under both aggressive and conservative
conditions, independent of the content or formulation.
These greater rates are due to an increase in the diameter
and resulting surface area for sublimation, as would be expected.
• The influence of vial size on rates of sublimation is
magnified as you utilize more aggressive parameters.
• Based upon the presence of the solute, ΔTsp
decreases and ΔPoc
increases.
• As more aggressive process parameters are implemented,
the ΔTsp
and ΔPoc
increase.
• Relative to the impact of vial size and processing
parameters, the magnitude of the impact of the closure
geometry is minimal.
• Overall, when the solute and the impedence of
the dried layer is introduced, the impact of the type
of closure on rates of sublimation is insignificant.
ADDITIONAL STUDIES
• Additional studies have been performed to determine
if product temperatures and times to complete
sublimation are different during primary drying when
using a single vent stopper with and without a Lyoseal 20™
in place. Based on the results from these studies
the temperatures and times during primary drying
over lapped and were not significantly different.
• Evaluation of the data of the rates of sublimation
normalized to g/cm2
hr. This data will provide the
impact on rates of sublimation with and without the
influence of the dried layer when the variable
of vial size has been removed.
ACKNOWLEDGMENTS
Edward Trappler, Lyophilization Technology, Inc.
Christine Adams, Lyophilization Technology, Inc.
Melissa Bentley, Lyophilization Technology, Inc.
Morrisa Jones, Lyophilization Technology, Inc.
Andrew Smith, Lyophilization Technology, Inc.
Heather Stankiewicz, Lyophilization Technology, Inc.
Nithin Kalathooparampil, Drexel University
Steven Smith, Drexel University
Support for this study from Biocorp
Measurement of Effect:
• The rates of sublimation were calculated by subtracting
the final weight of the measured vials from the initial
weight to obtain the mass loss. The mass loss divided by
the time interval for primary drying gives the result
of g/hr. These results were then averaged for
each data set. The final results reflect the average
grams of ice per hour that can be sublimed within the
given parameters.
• The ΔTsp
is the difference of the product temperature
relative to the shelf temperature. The product temperature,
measured by thermocouples, was taken at the end
interval of primary drying. Ice alone results in
a greater ΔTsp
. Whereas, when a solute is introduced
the ΔTsp
decreases.
• A ΔPoc
is the difference between the vapor pressure of
ice of the product temperature and the chamber pressure
during primary drying. The ΔPoc
increases as the
chamber pressure increases.
• The range of each data set was calculated by
subtracting the minimum from the maximum rate of
sublimation. From this data, it can be determined that
the impact on rates of sublimation by both vial size
and processing parameters is so great that the
impact of the type of closure is minimal.
I N T R O D U C T I O N R E S U L T S D I S C U S S I O N D I S C U S S I O N
C O N C L U S I O N
Aggressive Cycle Parameters
-50
-40
-30
-20
-10
0
10
20
30
0 100 200 300 400 500 600 700 800 900
Elapsed Time (Minutes)
Temperature(°C)
0
100
200
300
400
500
Pressure(Microns)
SHELF IN MICRONS
3 hrs @ 5 ° C
30 °C/hr
5.5 hrs @ -40 °C
30°C/hr
4 hrs @ 25°C
200 μm Hg
Conservative Cycle Parameters
-50
-40
-30
-20
-10
0
10
0 100 200 300 400 500 600 700 800 900 1000 1100
Elapsed Time (Minutes)
Temperature(°C)
0
100
200
300
400
500
Pressure(Microns)
SHELF IN MICRONS
3 hrs @ 5 ° C
30 °C/hr
5.5 hrs @ -45 °C
80 μm Hg
30°C/hr
8 hrs @ -20°C
SV SV+ LS DV DV + LS SV SV+ LS DV DV + LS SV SV+ LS DV
DV + LS
0.000
0.500
1.000
1.500
2.000
2.500
AverageRateofSublimation(g/hr)
10cc Vials of Purified Water, 5% Mannitol, and 5% Sucrose
Conservative Conditions
Minimum Average Maximum
Purified Water
5% Mannitol
5% Sucrose
SV
SV+ LS
DV
DV + LS
SV
SV+ LS
DV
DV + LS
SV
SV+ LS
DV
DV + LS
0.000
0.500
1.000
1.500
2.000
2.500
RateofSublimation(g/hr)
20cc Vials of Purified Water, 5% Mannitol, and 5% Sucrose
Conservative Conditions
Minimum Average Maximum
Purified Water
5% Mannitol
5% Sucrose
SV
SV+ LS
DV
DV + LS
SV
SV+ LS
DV
DV + LS
SV
SV+ LS
DV
DV + LS
0.000
0.500
1.000
1.500
2.000
2.500
RateofSublimation(g/hr)
50cc Vials of Purified Water, 5% Mannitol, and 5% Sucrose
Conservative Conditions
Minimum Average Maximum
Purified Water
5% Mannitol
5% Sucrose
SV
SV + LS
DV
DV + LS
SV
SV + LS
DV
DV + LS
0.000
0.500
1.000
1.500
2.000
2.500
RateofSublimation(g/hr)
10cc Vials - Purified Water and 5% Mannitol
Aggressive Conditions
Minimum Average Maximum
Purified Water
5% Mannitol
SV
SV + LS
DV
DV + LS
SV
SV + LS
DV
DV + LS
0.000
0.500
1.000
1.500
2.000
2.500
RateofSublimation(g/hr)
20cc Vials - Purified Water and 5% Mannitol
Aggressive Conditions
Minimum Average Maximum
Purified Water
5% Mannitol
SV
SV + LS
DV
DV + LS
SV
SV + LS
DV
DV + LS
0.000
0.500
1.000
1.500
2.000
2.500
RateofSublimation(g/hr)
50cc Vials - Purified Water and 5% Mannitol
Aggressive Conditions
Minimum Average Maximum
Purified Water
5% Mannitol
ΔTsp
(°C)
1
ΔPoc
3
(Pa)
2
Avg. Rate of
Sublim. (g/hr)
ΔTsp
(°C)
1
ΔPoc
3
(Pa)
2
Avg. Rate of
Sublim. (g/hr)
ΔTsp
(°C)
1
ΔPoc
3
(Pa)
2
Avg. Rate of
Sublim.
(g/hr)
SV 17.5 0 0.208 6.3 23.3 0.124 9.7 14.2 0.133
SV + LS 16.8 0 0.191 8.3 16.3 0.128 10.2 11.3 0.126
DV 17 0 0.214 7.4 20.2 0.128 9.6 14.2 0.151
DV + LS 16.6 0 0.198 10 11.3 0.119 10.2 11.3 0.130
SV 16.2 0.3 0.293 8.1 16.3 0.184 10.2 11.3 0.191
SV + LS 9.7 13.3 0.281 8.3 16.3 0.183 10.4 11.3 0.182
DV 16.1 0.3 0.299 8 16.3 0.188 10.3 11.3 0.210
DV + LS 16.1 0.3 0.278 9.5 11.3 0.180 9.9 11.3 0.198
SV 15.6 1.3 0.459 8.2 16.3 0.290 10 11.3 0.316
SV + LS 13.6 5.3 0.440 7.1 20.2 0.294 10 11.3 0.285
DV 14.2 1.3 0.491 8.1 16.3 0.303 9.6 11.3 0.345
DV + LS 12.8 5.3 0.450 7.9 16.3 0.297 10.6 11.3 0.336
1
± 0.5°C
2
± 0.1 Pa
3
ΔPoc calculated by the vapor pressure of ice based on the temperature of ice
CONSERVATIVE CONDITIONS
10cc
Vials
20cc
Vials
50cc
Vials
Purified Water 5% Mannitol 5% Sucrose
Closure
Type ΔTsp (°C)
1
ΔPoc
3
(Pa)
2
Avg. Rate of
Sublim. (g/hr) ΔTsp (°C)
1
ΔPoc
3
(Pa)
2
Avg. Rate of
Sublim. (g/hr)
SV 42.2 111.4 0.760 35.3 233.3 0.655
SV + LS 43.1 98.5 0.718 39.3 154.8 0.566
DV 43.2 98.5 0.767 36 212.1 0.656
DV + LS 46 67.7 0.725 38.1 172.8 0.581
SV 43.7 98.5 1.208 36.5 190.9 0.912
SV + LS 48.9 43.5 1.155 35.5 212.1 0.923
DV 48.9 43.4 1.178 36.6 190.9 0.953
DV + LS 52.5 20.1 1.166 36.5 190.9 0.970
SV 48.1 51.1 2.025 37.5 190.9 1.524
SV + LS 49.2 43.5 1.964 35.2 233.3 1.576
DV 49.3 43.4 1.942 36.4 212.1 1.556
DV + LS 47.7 58.7 2.008 36.2 212.1 1.515
1
± 0.5°C
2
± 0.1 Pa
3
ΔPoc calculated by the vapor pressure of ice based on the temperature of ice
AGGRESSIVE CONDITIONS
20cc
Vials
50cc
Vials
Purified Water 5% Mannitol
10cc
Vials
Closure
Type
LS = Lyoseal 20™DV = Double Vent StopperSV = Single Vent Stopper
LS = Lyoseal 20™DV = Double Vent StopperSV = Single Vent Stopper
LYOPHILIZATION
T E C H N O L O G Y, I N C.
I n t e g r a t i n g S c i e n c e a n d T e c h n o l o g y