More Related Content
Similar to PortfolioSample1
Similar to PortfolioSample1 (20)
PortfolioSample1
- 1. February 26, 2015 | es.sgo2.14.29.08.CMT.Week2 | © Lab Consulting Partnership, Inc.
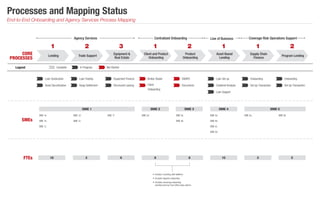
Processes and Mapping Status
End-to-End Onboarding and Agency Services Process Mapping
CORE
PROCESSES
SMEs
FTEs
1
Lending
2
Trade Support
3
Equipment &
Real Estate
1
Client and Product
Onboarding
2
Product
Onboarding
1
Asset Based
Lending
1
Supply Chain
Finance
2
Program Lending
Agency Services Coverage Risk Operations SupportLine of BuisnessCentralized Onboarding
Legend Complete In Progress Not Started
Loan Syndication
Asset Securitization
Loan Trading
Swap Settlement
Equipment Finance Loan Set up OnboardingSWAPS OnboardingBroker Dealer
Client
Onboarding
Structured Leasing Collateral Analysis Set Up-Transaction
Loan Support
Documents Set Up-Transaction
SME 1a
SME 1b
SME 1c
SME 1d
SME 1e
SME 1f SME 2a
• Includes 2 pending staff additions
• Excludes deposits onboarding
• Excludes remaining onboarding
activities done by Front Office sales admins
SME 3a
SME 3b
SME 4a
SME 4b
SME 4c
SME 4d
SME 5a SME 5b
SME 1
18 2 9 8 8 10 3 5
SME 2 SME 3 SME 4 SME 5
- 2. February 26, 2015 | es.sgo2.14.29.08.CMT.Week2 | © Lab Consulting Partnership, Inc.
CVM: End-to-End Customer Relationship - Representative Samples
Comparison of Processes Where Onboarding Is- and Is Not Involved
Front Office
(Unique group per LOB)
Organizational Groups:
Middle Office
(Unique group per LOB)
Client Onboarding
(Broker-Dealer, Swaps, Documents)
Agency Services
Asset Based Lending
Program Lending
Supply Chain Finance
Commercial Credit Services
(CCS)
Client or Partner1
Onboarding
Product Setup Closing
(Booking, Funding, Settlement)
Servicing
(Maintenance, Wires)
Termination
1 11
2 4
7 10 13
129
1 2
5 64
8
Legend:
Customers by Product
Program Lending
Asset Securitization
653
3
End-to-End Process Flow
- 3. February 26, 2015 | es.sgo2.14.29.08.CMT.Week2 | © Lab Consulting Partnership, Inc.
1. Accuracy
2. Timeliness
3. Responsiveness
4. Understand Customer’s Needs
5. Business Enablement
6. Reporting
Internal Perceptions Interviews
Strengths, Weaknesses, Improvement Opportunities and Customer Priorities
Interviewees Believe that ‘Experience’
Is the Top Strength of Their Own Teams
Despite the Belief that ‘Experience’ Is a Strength, Half of
Interviewees Believe They Need ‘Better Skill Set/Training of People’
Interviewees Identify Technology, Processes
Skill Set/Training as Primary Weaknesses of Their Teams
Interviewees Also Believe that Their Areas
Fail to Excel at Their Customers’ Top Priorities
Q = What in your opinion are the weaknesses of your team?
Q = What are the top three priorities of your customers? What are the ratings against priorities?
Q = What in your opinion are the strengths of your team?
Q = What needs to happen to achieve a 10?
Of 10 Weaknesses...Of 8 Strengths...
Of 12 Improvement Opportunities...
...3 Are Highlighted...3 Are Highlighted
...3 Are Highlighted
1. Technology
2. Processes in Place
3. Skill Set/Training of People
4. Leadership/Management
5. Policies and Procedures
6. Usage of resources
7. Duplicity of activities
8. Customer Service
9. Communication
10. Problem Solving Capability
1. Experience
2. Skill Set/Training of People
3. Processes in Place
4. Problem Solving Capability
5. Customer Service
6. Leadership/Management
7. Policies and Procedures
8. Technology
Customer Priorities Ranking
Perceived Performance
Against Priority (1-10)
6.5
6.5
8.8
8.8
3.5
8.5
1. Better Skill Set/Training of People
2. Improve Technology
3. Better Process Management
4. Enhance Usage of Resources
5. Eliminate Non–Value–Added Tasks
6. Work More Effectively
7. More Accountability
8. Improve Customer Service
9. Accept Changes
10. Better Defined Procedures
11. Reduce Errors
12. Better Sense of Urgency
Percentage of Respondents
0% 10% 20% 30% 40% 50%
Skill Set/
Training of People
Processes in Place
Technology 50%
33%
25%
Percentage of Respondents
0% 20% 40% 60% 80% 100%
Processes in Place
Skill Set/Training
of People
Experience 92%
42%
67%
Percentage of Respondents
0% 10% 20% 30% 40% 50%
Better Process
Management
Improve Technology
Better Skill Set/
Training of People
50%
25%
25%